ETHEREUM ETHUSDT is awaiting a directional bias .but at the moment it has to break a weekly supply roof and sustain the gains as buy confirmation.
ETHUST.P trade ideas

FULL MARGIN TEST ETH✅ 2. ETHUSD (Strong bias rising)
Entry: 2565 Long on retracement
Stop Loss: 2540
Take Profit: 2600
Recommended lot size: 0.20 lot (1:100)

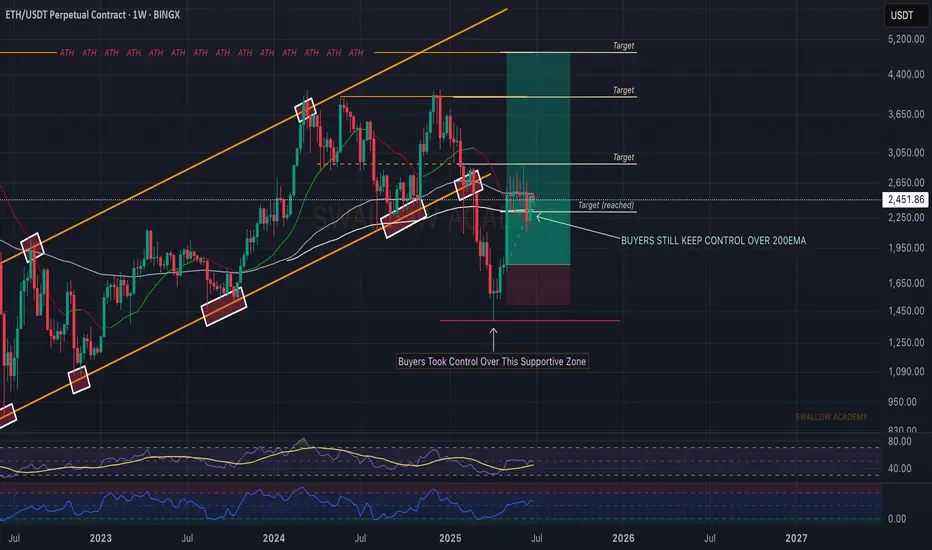
Ethereum (ETH): Buyers Took Back Control Over 200EMABuyers are back in control over the 200EMA, so nothing is lost yet. We keep our bullish game plan here. As many know, ETH is still far from its potential...considering the fact that BTC has already outperformed itself.
Time for ETH to shine now!
Swallow Academy
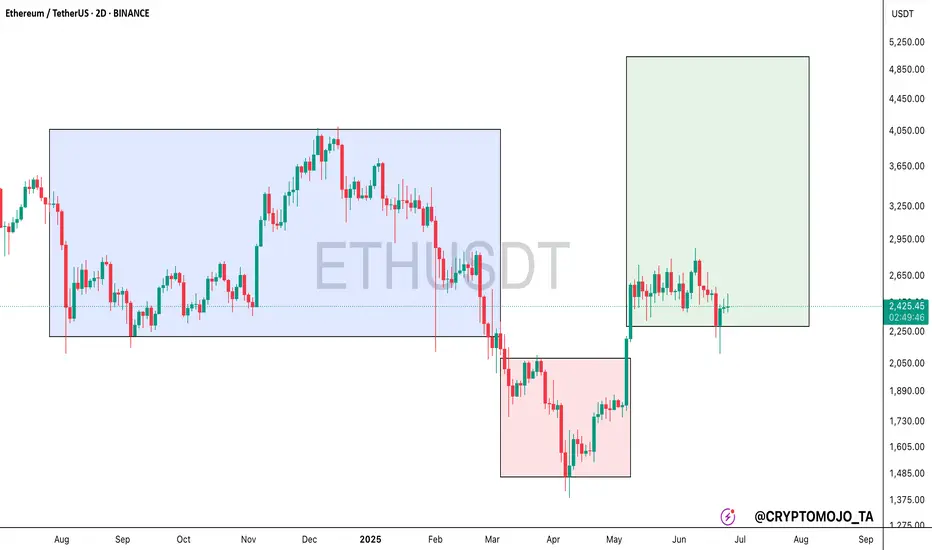
Ethereum (ETH): Good Start, Seeing Buyside DominanceEthereum has done well, where we have established a proper support area near the local buy zone, which should be enough for us to have a proper bounce from here towards our target of $2800.
As long as buyers keep the dominance near the buy area, we are bullish!
Swallow Academy

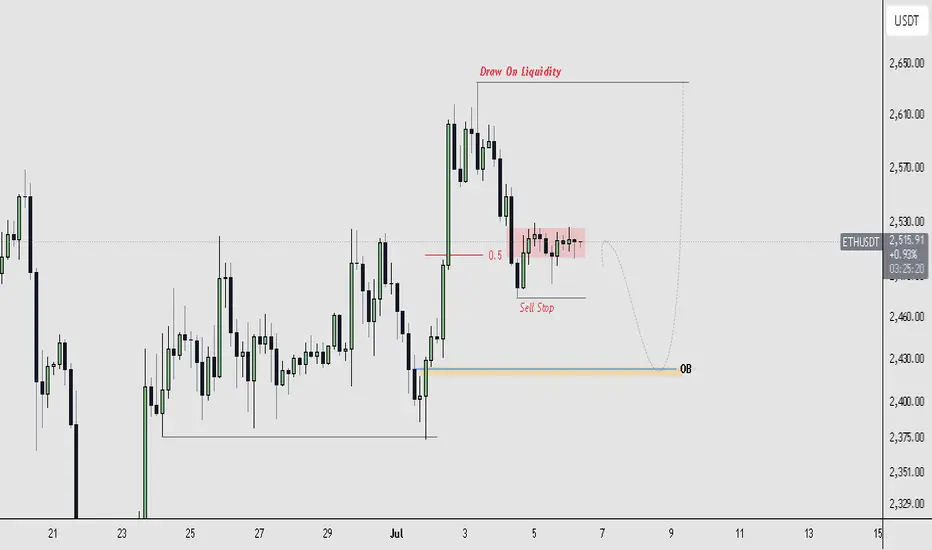
Weekly trading plan for EthereumBINANCE:ETHUSDT Last week, price mostly traded in a range. For this week, I've updated key levels, marked them on the chart, and modeled several scenarios. We can expect a pullback—possibly a deeper correction—before another push toward resistance levels. If price breaks the local low but then reclaims the weekly pivot point, I'll consider opening long positions without waiting for a deeper pullback.
Write a comment with your coins & hit the like button and I will make an analysis for you
The author's opinion may differ from yours,
Consider your risks.
Wish you successful trades ! mura

$ETH is showing signs of a potential bullish move!CRYPTOCAP:ETH is showing signs of a potential bullish move.
The recent consolidation looks like it's building up for a strong breakout.
With market sentiment improving and growing interest in ETH-based projects, this could be a good time to accumulate before the next move up.
I’m watching the key resistance levels closely, if they break, we could see a fast rally.
#Ethereum
ETHUSDT WEEKLY UPDATE — PART 1
When Conviction Fails: Apex Rejection, Hidden Redistribution, and the Illusion of Demand
Good morning, good afternoon, good evening, wherever you're tapping in from. Now, as always, I’m not here to waste your time with unnecessary waffle. Let’s get straight into it and unpack this mess step-by-step.
THE APEX REJECTION | MORE THAN JUST A WICK
So picking up from last week's update, we find ourselves right at the crossroads, and not the romantic kind either. What we’re looking at right now so far, is a clean yet 100% conclusive rejection from the apex of a key macro structure.
This isn’t just any level. This is the intersection of vertical momentum and horizontal memory, the apex of a triangle that’s been forming for months. This is where bullish intent was supposed to hold, supposed to assert dominance, but instead, what did we get? A strong push into resistance, a failure to fix above it, followed by exhaustion and signs of institutional unloading.
Now, to the untrained eye, this may look like a pullback, or even a healthy correction. But we’re not here to look at charts with retail goggles. We’re here to track the true intent behind the price action, and if you know your schematics, this is screaming redistribution. And not just any redistribution, the kind that happens right before the market changes its personality.
WHERE ARE WE IN THE SCHEMATIC?
If we overlay Wyckoff logic on top of this structure, it's very clear:
We’ve had our PSY (preliminary support).
Followed by a spring, a shakeout, and a fake rally.
Now we’re dancing around what appears to be the UTAD (upthrust after distribution) — but weaker.
This isn’t classic distribution, it’s redistribution masked in macro confusion.
Here’s the thing this range isn’t just price consolidation, it’s behavioural conditioning. This long, choppy sideways movement is designed to wear out both bulls and bears, making them question their bias, mismanage their risk, and either overstay or exit too early.
The market is methodical, not random. These candles aren’t accidents, they are footprints of algorithmic trap setting, and right now, it looks like the net is about to close.
VOLUME TELLS THE TRUTH
Let’s not forget volume. Look at the weekly volume through this recent push:
Decreasing volume on the rallies,
Higher volume on the red closes,
And multiple spikes that failed to carry price past resistance.
That’s your dead giveaway. You don’t need to be a wizard, just follow the clues. Price is being pushed, not lifted. Demand isn’t stepping in, liquidity is being removed. This isn’t smart money accumulation, if confirmed by the endd of this week, this most recent move up cout be doing of smart money unloading, Quietly and Efficiently.
THE MARKDOWN IS PRIMED
Let’s now address the elephant in the room, the range low and point C of the triangle on the 4H.
T hat’s where liquidity is sitting.
That’s where the market’s next objective lies.
We’ve now failed to reclaim the apex, the wick was slapped down, and unless something significant shifts, the next logical move is to sweep that C point, take out the emotional support, and either:
Tap into true demand (if it exists), or
Begin the cascade toward the final green demand zones between 2,150–2,070, which we marked weeks ago.
And don’t forget, this sweep may not be clean. We could get a fakeout bounce mid-range — enough to bait in more longs, only to roll over again.
PSYCHOLOGICAL LAYER
What’s happening here isn’t just technical, it’s emotional warfare. This entire range has been one long gaslight for the average trader. Between the failed breakouts, failed breakdowns, and chaotic intraday behaviour, retail has been turned into liquidity.
And if you’re still trying to long blindly at the top of this, hoping for 3k ETH without a confirmed structure reclaim, then respectfully, you’re the product right now.
Coming next in Part 2:
A full breakdown of the 4H macro setup
Analysis of the internal range mechanics
Recalculated fib zones
Where the liquidity pockets are
What the most probable path is short, medium, and long-term
Stay tuned — I’ll keep the flow coherent, structured, and aggressive. No fluff. No hopium. Just structure, psychology, and execution.

$ETHUSDT 1H Trade Setup CRYPTOCAP:ETH – 1H Trade Setup
- Entry: CMP
- SL: $2,410
- Target: $2,506
ETH broke above the falling trendline and retested it. Clean breakout setup, bullish continuation likely above $2,445.
DYRO, NFA

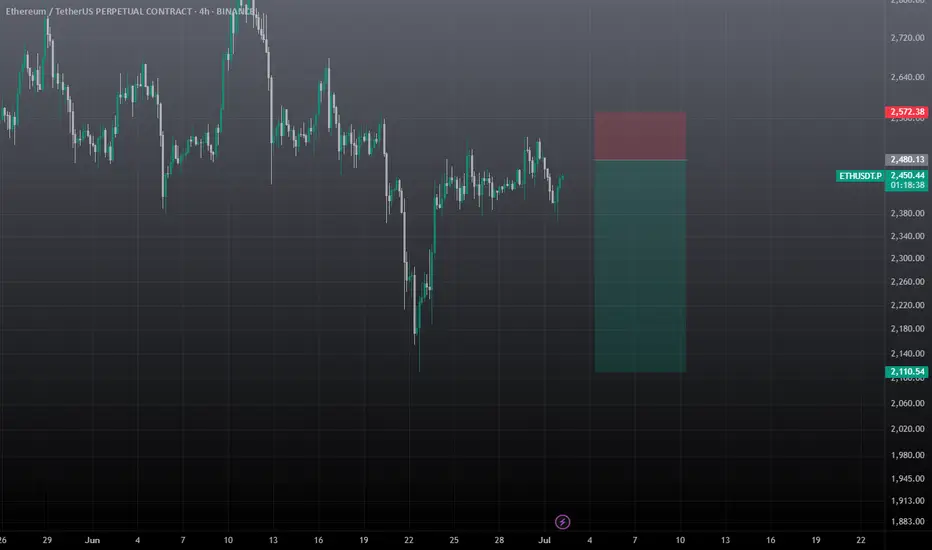
ETHEREUM TRADE PLAN!!!Ethereum still remains bullish, especially on the daily timeframe there's a +OB/BISI supporting the price.
My focus is on the "4-Hour TF" I want to see price revisit (BISI) level as a more favorable entry point for continuation. This level aligns with a key bullish order block, which I anticipate will draw price down before resuming the uptrend.
ETHUSDT SWING TRADE SetupWait for the entry and must use sl, if sl hits then wait for candle closure, candle managed to close above the SL, still there is lot of supply zone for eth till 2.7k, So fakeout also possible. I will comment the update, SO closely follow me.
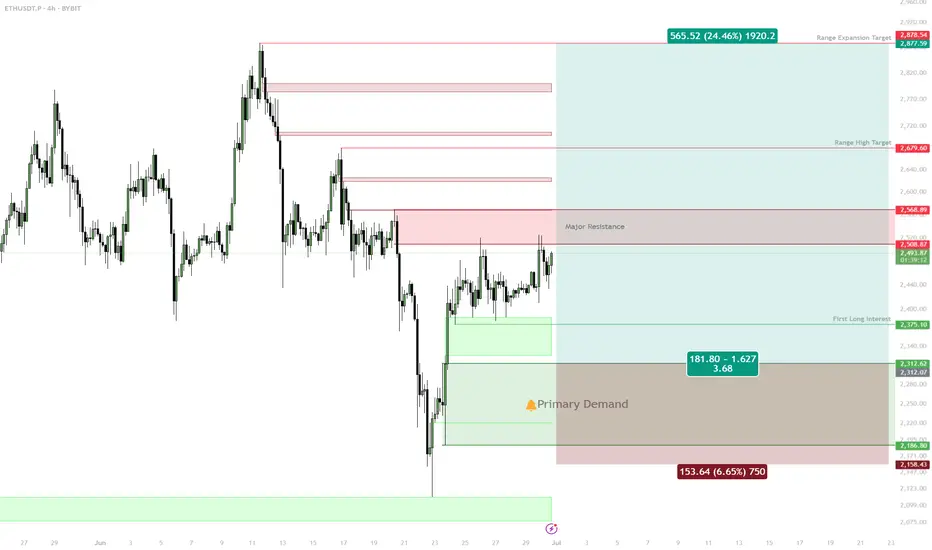
ETH: Deep Retrace or Shallow? Two Key Long Zones into Next Week✅ Two main long setups: Equal Lows @ $2,376, Untapped Demand $2,250–$2,314
✅ Best R/R from deeper demand zone, but will watch both levels
✅ Targets: $2,738 (range high), ~$3,000 (expansion)
✅ Shallow retrace may limit upside to a new local high, not full expansion
Setup 1:
Buy trigger on sweep and reclaim of $2,376 (equal lows)
Target: $2,508, then $2,738
Setup 2:
Preferred: Buy trigger into $2,250–$2,314 untapped demand
Target: $2,738, $3,000
Risk:
Wait for reaction/confirmation at both zones; no FOMO in between
🚨 Risk Warning:
If no strong bounce from these levels, stand aside — don't force the setup.
ETH Bullish Update
Ethereum is looking bullish, and is respecting clearly defined support and resistance levels.
In my primary count, we have finished black wave 1. The question is to determine if black 2 is already finished, which could lead to strong upside.
There is no way to know without further price action, and a break of green resistance is a very bullish signal.

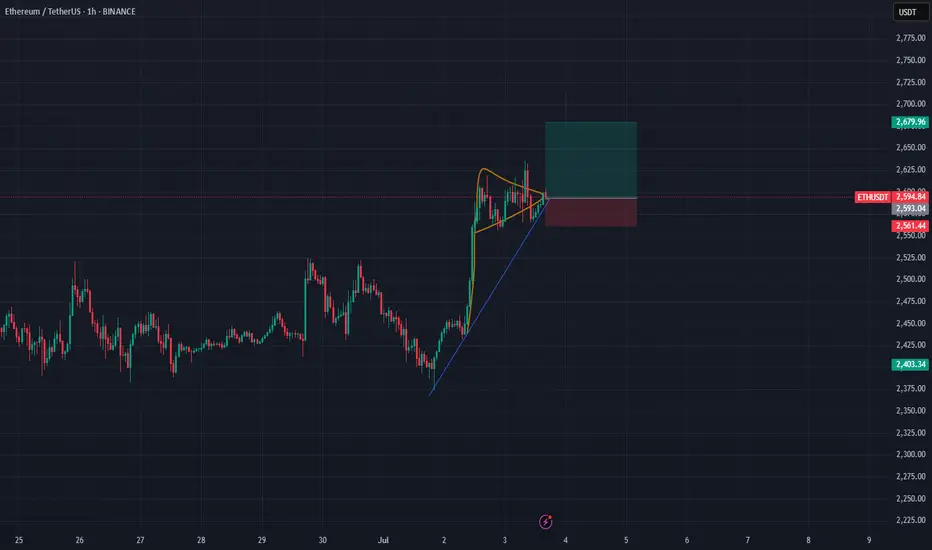
ETH/USDT – Symmetrical Triangle Breakout Setup (1H Chart)After a strong bullish impulse, ETH is consolidating in a symmetrical triangle formation — a classic continuation pattern. Price is coiling up near the apex, with higher lows forming against a horizontal resistance line.
Setup Highlights:
Pattern: Symmetrical Triangle (1H)
Trend: Bullish continuation after breakout
Entry Zone: ~2592 USDT
Target: 2679 USDT (upper green box)
Stop Loss: Below 2561 USDT (lower red box)
Risk-Reward: Favorable R:R structure
Watching closely for a decisive breakout above the triangle resistance to confirm bullish momentum continuation.
Let me know what you think — bullish continuation or fakeout risk?
#Ethereum #ETHUSDT #CryptoTrading #TechnicalAnalysis #BreakoutSetup #TradingView
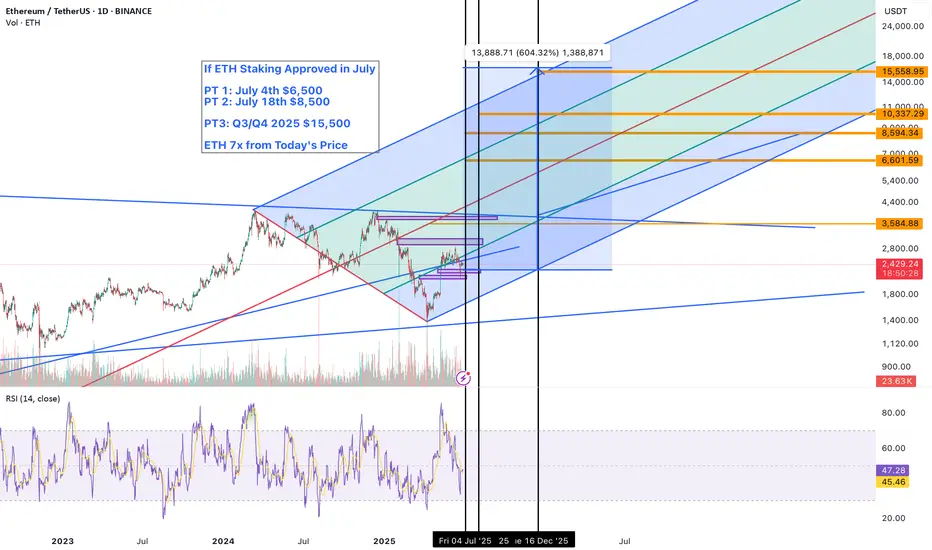
Ethereum’s $10K Breakout Is in Sight — BRock's Staking ETF July🚨 Ethereum’s $10K Breakout Is in Sight — BlackRock’s Staking ETF Could Trigger a Historic Supply Squeeze
All eyes are on the SEC’s pending decision regarding BlackRock’s Ethereum Staking ETF, and if approval lands in July 2025, it could trigger one of the most powerful supply-side shocks in Ethereum’s history.
This isn’t just about price speculation. It’s about structural demand meeting vanishing supply.
🟢 Why This ETF Is a Game-Changer
BlackRock isn’t just filing for an Ethereum ETF—it’s filing for a staking-enabled ETF. That’s a huge distinction. This means:
ETH held in the ETF will be staked, earning real yield
Staked ETH is locked and removed from circulation
Institutional capital gains exposure to yield + price upside
Ethereum becomes a yield-bearing digital commodity
It’s no longer just “digital oil.” It’s now digitized yield, and institutions are hungry for real yield in a low-rate environment.
📈 Technical Setup Is Bullish
ETH is coiling under its former ATH of ~$4,800
RSI shows no major bearish divergence
ETH/BTC ratio shows signs of breakout after long consolidation
Bitcoin dominance is peaking → altseason rotation imminent
Add a major ETF approval catalyst to this technical structure, and ETH could move explosively.
🔮 Ethereum Price Forecasts Post-Approval
Scenario Price Target Timeframe
Conservative $6,000–$7,000 2–4 weeks post-approval
Upside / Momentum $9,000–$10,000 Q3 2025
Supercycle Case $12K–$15K Q4 2025–Q1 2026
Why $10K ETH is Realistic:
Bitcoin’s ETF sparked $15B+ in inflows in <6 months
ETH has smaller market cap, so similar flows have outsized impact
Staking ETF removes ETH from float, making price reflexively bullish
TradFi gets exposure to yield + deflationary asset in one product
🔥 This Could Be Ethereum’s “GBTC Moment”
Remember how Grayscale’s GBTC product in 2020 created a reflexive premium and drove massive BTC inflows?
This is version 2.0, with yield attached. And instead of retail FOMO, we now have pension funds, RIAs, and endowments allocating via regulated ETF rails.
That’s not hype. That’s capital rotation—on-chain.
🛑 Risks to Watch
SEC delays or waters down staking component
Macro headwinds (rate volatility, geopolitical shock)
ETF approval gets front-run and sells the news
But even with these risks, the ETH supply structure is fundamentally stronger than during prior cycles. The burn is active. The float is tightening. And now TradFi wants in.
✅ Conclusion: July Could Be Ethereum’s Tipping Point
With a BlackRock staking ETF on deck, a macro environment ripe for a Fed rate cut, and Ethereum sitting under its ATH with rising momentum…
$10K ETH isn’t a moonshot—it’s the logical next leg.
If approved in July, Ethereum may never trade below $5,000 again.
🔔 Follow for updates on ETH ETF flows, ETH/BTC ratio breakouts, and altseason timing models.
📊 Comment below—what’s your Ethereum price target if the ETF is approved?
#Ethereum #ETHUSD #CryptoETF #BlackRock #Altseason #ETHAnalysis #CryptoNews #TradingView
ETH BEARISH AT RESISTANCE ETH rejecting daily resistance, likely price will look to find supports at zones marked below
DYOR

ETH | Long | 3 Hrs | Target: 2,540This technical analysis is for informational and educational purposes only. It does not constitute financial advice. Remember to always research and consult with a professional before making investment decisions. Good luck! 📈💼🚀


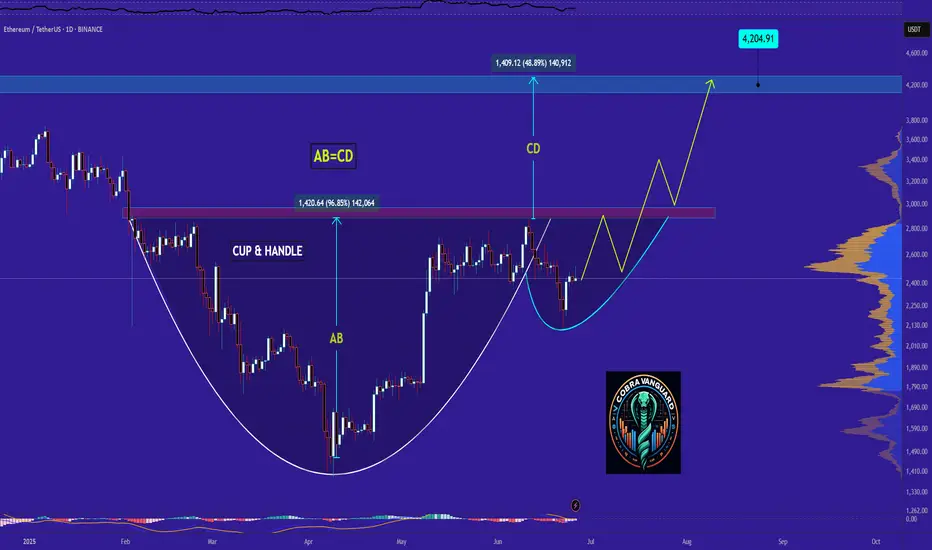
ETH It will grow soon...It can be said that the price has formed a cup and handle pattern, which it is completing soon. If the price follows this pattern, it can be expected that Ethereum will reach its peak again.
Best regards CobraVanguard.💚
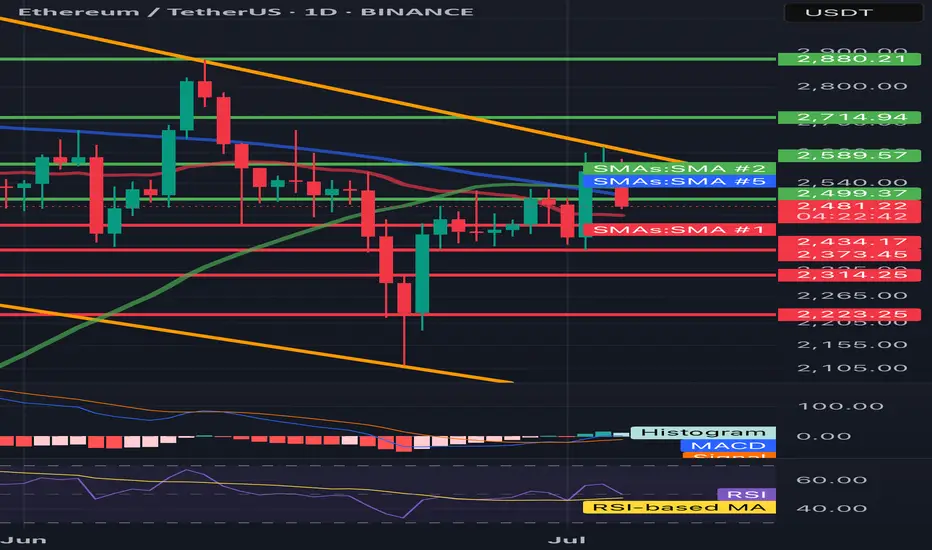
ETH/USDT 1D🔍 ETH/USDT - technical analysis (1D interval):
📉 Price: 2478 USDT (-4.36%)
🔧 Resistance:
• SMA 200 (green): ~ 2589
• Resistance zone: ~ 2715 → 2880 USDT
• SMA 100 (blue): ~ 2500 (just rejected)
🔧 Support:
• SMA 50 (red): ~ 2434 - currently tested
• Strong support: 2373, 2314, 2223 USDT
📊 indicators:
• MacD: freshly intersected, but the momentum is weakening
• RSI: ~ 45 - neutral/weak, under 50 (no bull strength)
• Trend: Still in the downward channel (yellow trend lines)
⸻
⚠️ Conclusions:
• Price rejected from 2500 (SMA 100) and flies down.
• If 2434 falls, a further discount is possible to 2373–2314.
• Lack of bulls with key resistance - the inheritance scenario dominates.
• Watch behavior at 2434 - this is now a key level.
ETHEREUM PRICEACTION TRADINGETHUSET have tested the broken demand floor and it looks like buyers are going for another .
if that level is broken ,it will be a wave of long which will hope to take profit on the supply zone .

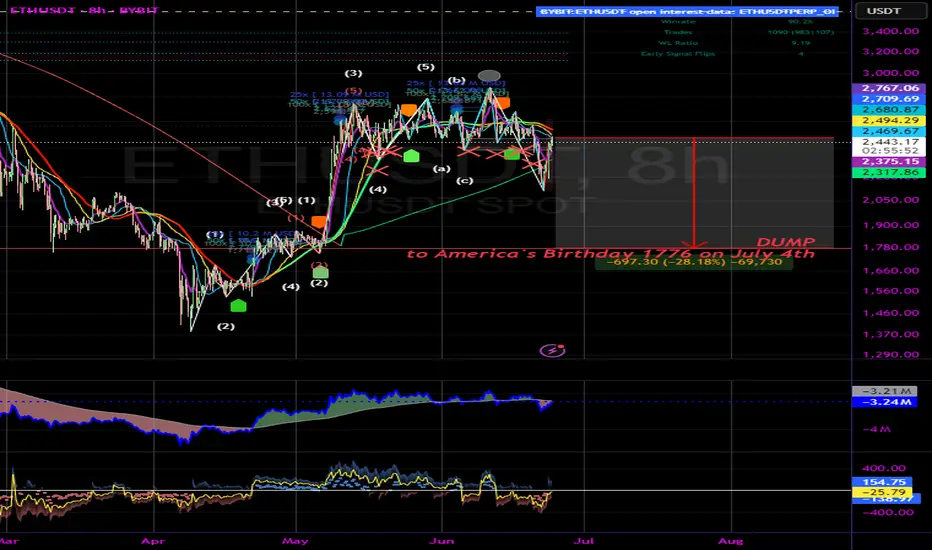
ETH Dumping to 1776 in honor of America's birthdayBART express incoming. Nice liquidity grab down there as well.
Not financial advice.
Happy July 4th!
ETHUSDTThis movement downtrend. If breake 2.790 movr to 3.500$ but breke 2.200 move trend to 1.500$.

EthusdttHis asset has presented my expectation information, in which my my sell confident level is 90% for now, while the 10% left can be defined by FA.
the entry zone is valid. but if price kick my stoploss then , i will like to see price seek little higher price to the zone i point magnifier.
