ETH 1W IdeaLooks like Ethereum is forming inverse H&S pattern. Wait for the price to break out of the neckline and then re-test it and not close below this neckline. When this is confirmed you can enter a long trade. Target will be given under this idea later when re-test happens.
ETHUST.P trade ideas

Another Bullish Hope… or a Bearish Setup!?🧠 Multi-Timeframe Analysis of ETH/USDT
Monthly Timeframe:
Since early 2023, Ethereum has been in a solid uptrend, managing to reach a key level (pink line).
After a strong move, it got rejected in May 2024, falling to around 2111.
Buyers made another aggressive attempt, pushing the price up to 4094, breaking the previous high — but this time, the rejection was much more intense.
Price quickly dropped all the way to 1385.
So, where are we now?
The market structure has clearly flipped to sell on the monthly timeframe.
We appear to be in a pullback/retrace phase, likely setting up for a deeper move down.
First downside target? Around 1957 — but remember:
Every level = a new decision point!
Weekly Timeframe:
After the rejection from 4093, buyers attempted a recovery. Maybe it was just profit-taking from bears.
The price briefly entered the "expensive zone" — but the momentum didn’t hold.
Last week, a strong bearish weekly candle confirmed the shift to a sell structure.
We might still see one more push to test the 2920 level, but honestly...
It smells like a bull trap. The market might lure buyers in just to drop the price again.
Right now, the bears are in control 🐻
Daily Timeframe:
Looking at the daily chart, the sell structure is clear.
Two likely scenarios:
1- The downtrend continues from here
2- A slight push upward to trap aggressive buyers before the next leg down
🌫️ The market may give a false sense of strength to the bulls, but the true momentum is still bearish.
Is this a bear trap? Maybe.
For now, I'm favoring sell setups — unless I see something that strongly shifts the structure.
Summary:
From monthly to daily, all signs currently point to bearish pressure dominating the market.
Until proven otherwise, the trend remains downward.
🎯 Possible targets if the drop continues:
1957
1793
1752
📌 Remember: every level is an opportunity to re-evaluate, not a fixed prediction.
📣
If you found this breakdown helpful, drop your thoughts in the comments
Have a question or a chart you'd like reviewed? Let me know!
Follow me to stay updated — especially if price action shifts and this scenario changes.
Save and share with fellow traders who appreciate deep, multi-timeframe analysis
⚠️ Disclaimer:
This content is intended for educational and informational purposes only and does not constitute financial advice or a trading signal.
Trading carries risk. Please do your own research, practice solid risk management, and never rely solely on external analysis.
You are solely responsible for your trading decisions.

Bullish on ETHThis is my personal idea of what will happen in the near future for ETHUSDT. Lets see how this plays out.

Everyone sees consolidation. I see positioningETH is holding just above a key fib cluster, showing signs of controlled distribution, not weakness. Smart Money doesn’t chase — they build positions while the crowd second-guesses.
The Structure:
Current Price: ~2,419
Local High (Premium): 2,482.09
Fib Retracements:
0.236 → 2,394.72 (mild correction)
0.382 → 2,340.68 (initial re-entry zone)
0.5 → 2,296.99 (ideal discount)
0.618 → 2,253.31 (deep entry, high confluence)
0.786 → 2,191.11 (structure last line)
Key Zones:
FVG already filled during the move up — imbalance mitigated
Order block (OB) at 2,191.11: high-probability reaction zone
Strategy Outlook:
Scenario A (Shallow pullback):
ETH tests 2,394 → 2,340, then continues the push to 2,482
→ Aggressive buyers step in early
Scenario B (Deeper sweep):
A drop to 2,296 → 2,253 opens the door for reaccumulation
→ Classic Smart Money trap before the next rally
Invalidation:
A break below 2,191 (and OB failure) kills this bullish narrative
Execution Logic:
Accumulation Zones:
Light: 2,340–2,296
Strong: 2,253–2,191 (discount reload)
Target:
2,482
Extension optional if momentum builds above recent highs

ETH: Short 25/06/25Trade Direction:
ETH: Short
Position Strategy:
- Risk approx 0.5%
Reason for Entry:
- Daily FVG
- Big resistance level
- Critical level of resistance, until flipped bias on eth must remain bearish intraday
- H4 Liquidity Swept

ETHEREUM is having a bearish retest?#ethereum price has been moving in a distribution zone and needs to breakout at least 3000$ to be optimistic and 3300$ to be bullish. #eth price is now having a bearish retest where broke the former support zone and now testing the current resistance zone. 4H ichimoku cloud must be broken out. A heavy declination from this zone may cause heavier dumps.

ETH Retracement 50% FibHi there, I think there will be a retrace at ETH to 50% fib. My new buy zone will be 2300 and I am short at the moment to 2300. Hope this helps you out. Do your research and this is no financial advice, just an idea. Oh and by the way, I got my SL just above the current high (~2490).
Let me know what your thoughts are in the comment below!

ETH/USDT | ICT Price Delivery Model: AMD📍 ETH/USDT – Daily Timeframe | ICT Smart Money Framework
This analysis outlines a clean execution of the ICT Price Delivery Model:
🔹 Accumulation Phase:
Price consolidates in a defined range, building liquidity above and below the zone.
🔹 Manipulation Phase:
Liquidity sweep to the downside taps into the Balanced Price Range (BPR) — engineered to trap late sellers.
🔹 Repricing Phase:
Price reacts sharply from the Daily Fair Value Gap (D FVG), confirming bullish intent.
🔹 Distribution Objective:
Smart Money likely targeting external liquidity resting above the $3,400 level.
Key ICT Concepts Applied:
✔ Break of Structure (BOS)
✔ Market Structure Shift (MSS)
✔ Fair Value Gap (FVG)
✔ Balanced Price Range (BPR)
✔ External Liquidity ($$$)
📈 Directional Bias: Bullish
🎯 Primary Target: $3,400 (Distribution Zone)
🕒 Chart Type: Daily (1D)
📉 Invalidation: Break and close below BPR without mitigation
📊 Shared by SeenForex – Precision Analysis through ICT Methodology

ETH - When $3,000??The one who frontrun ETH at the bottom are the real boss, looks good from 2460 for longs, and slit for buys at the range if something outlasts

ETHUSDT Weekly: $2550 - The Bullish Pivot Point• Current Price Consolidation and Immediate Range : The ETHUSDT price is currently consolidating within a critical immediate range, bounded by the 2000−2200 weekly support below and the 2900−3000 overhead resistance area. This 2000−3000 zone defines the current primary trading boundaries on the weekly timeframe.
• Key Bullish Catalyst at $2550 : For the bullish sentiment to gain significant momentum and indicate a potential continuation of the recent upward movement, a decisive weekly close above the $2550 level is paramount. This price point acts as an immediate pivot; successfully clearing and holding above it would suggest a re-energized buying interest targeting the upper bound of the current range.
• Significance of the "Deciding Area" : The 2900−3000 region, labeled as a "Deciding Area," represents a crucial resistance confluence. This zone previously served as significant support and the long-term green ascending trendline, which was subsequently broken. A successful retest and breakout above this area would indicate a potential shift in market structure from bearish to bullish, opening the path towards the higher Key Resistance at 3900−4000.
• Critical Support and Downside Risk : Maintaining the 2000−2200 weekly support is essential for bulls. A sustained weekly closure below this level would invalidate the current bullish outlook and likely lead to a retest of the strong demand zone around 1400−1500, signaling a deeper retracement or a renewed bearish trend.
Disclaimer:
The information provided in this chart is for educational and informational purposes only and should not be considered as investment advice. Trading and investing involve substantial risk and are not suitable for every investor. You should carefully consider your financial situation and consult with a financial advisor before making any investment decisions. The creator of this chart does not guarantee any specific outcome or profit and is not responsible for any losses incurred as a result of using this information. Past performance is not indicative of future results. Use this information at your own risk. This chart has been created for my own improvement in Trading and Investment Analysis. Please do your own analysis before any investments.

ETH Long TradeLooks bullish here for continuation
Futures are higher on holiday
Order flow neutral to bullish

ETHAs seen on the ETH chart, after breaking the upward trend, it performs a retest on the downward trend and creates the second peak of the downtrend by taking liquidity. All the moving averages (7, 25, 50, 100, 200) have converged, reinforcing and supporting the trend.
We have 3 scenarios here:
Wait for a break of the downtrend and enter a trade with a reversal candle.
Wait for the moving averages to act as support.
Wait for support from the block order zone around the 500 level — this is the worst-case scenario.
If the first two scenarios happen together, it could push us significantly higher.
At this point, only short positions are advisable — but they must be adjusted according to risk.
Everything written here is based on the weekly chart. It is possible to trade on lower timeframes, but don’t forget — the overall trend is still down.

ETH Forming Bullish AB=CD Pattern | Eyes on Breakout #Ethereum (ETH) is showing strong bullish momentum on the 4H timeframe and is currently developing a classic AB=CD harmonic pattern, which often precedes a continuation of trend.
✅ Key Observations:
#ETH is holding within a solid uptrend structure
No signs of bearish divergence or reversal patterns yet
Momentum remains healthy, with buyers in control
🔍 What to Watch For:
We are closely watching the previous Higher High (HH) — currently acting as a key resistance level. A 4H candle close above this level will serve as confirmation for the continuation of the bullish trend.
📈 Trading Plan:
Once #ETH breaks above the resistance and confirms with a close, we’ll look to enter a long position with proper risk management and stop-loss placement below recent structure.
💬 What’s your bias on #ETH in the short term? Are you already long, or waiting for the breakout too?
📌 Don’t forget to Like, Comment, and Follow for more clean setups and strategy-based analysis!
#ETH #Ethereum #CryptoTrading #ABCDPattern #TechnicalAnalysis #Harmonics #TradingSetup #Breakout #PriceAction

"Trap Ahead : Liquidity has a Price"Everyone’s screaming “bull market!” again…
Yeah, until the market humbles them—like always.
Let me walk you through what’s actually happening:
ETH is headed for a flashy detour to $3,300
—everyone’s gonna feel rich for a second.
Then?
Down she goes. Straight below $2,300.
Trust me, euphoria has a price.
Meanwhile, BTC is dressing up for above $113,500.
But don’t fall in love with the pump—it’s not here to stay.
That move? Just enough to get everyone trapped.
Next stop: sub-$93K.
Yup, the wolf said it.
This market doesn’t care about your hopes.
It rewards the patient, and devours the emotional.
Liquidity is the meal. You’re either the hunter… or the feast.
Follow Alpha Sigma Wolf
If you’re tired of hopium and want clarity instead.
Because I don’t do “maybe.”
I do moves.
Let the sheep cheer. We’ll be waiting.
#SMC #SmartMoney #CryptoAnalysis #ETH #BTC #AlphaSigmaWolf
ETH shortETH looking weak after failing to reclaim 2,250. Eyeing a short entry here with targets at
2137 and 2100. Stop-loss above $2325. Trend still bearish—don’t catch a falling knife! #ETH #CryptoTrading #BearishSignal

Using PAR indicator to find divergence gaps to find clues of PA Using PAR indicator to find divergence gaps to find clues of PA

MACD Divergence Flashing Red, Could This Trigger a -30% Crash?Hey Realistic Traders!
Bearish Reversal Signal Flashing on BINANCE:ETHUSDT , Is the Bull Run Over?
Let’s Break It Down..
On the daily timeframe, Solana (SOL) has formed an ascending broadening wedge, which has now broken to the downside through both the lower trendline and a major support zone, indicating a shift in market structure.
Price action has also remained consistently below the 200-day EMA, signaling a potential transition from a bullish to a bearish trend.
A bearish divergence has appeared on the MACD indicator, where price makes higher highs while the MACD forms lower highs. This divergence indicates that buying momentum is weakening, even as the price pushes higher. Such a pattern often precedes a trend reversal and supports the expectation that the price may continue to move lower.
Given these technical signals, the price is likely to continue moving lower toward the first target at 1849.07, with a possible extension to the second target at 1534.44.
This bearish outlook remains valid as long as the price stays below the stop-loss level, currently marked at 2734.40. A move above this level would invalidate the bearish setup.
Support the channel by engaging with the content, using the rocket button, and sharing your opinions in the comments below.
Disclaimer: "Please note that this analysis is solely for educational purposes and should not be considered a recommendation to take a long or short position on ETHUSDT.

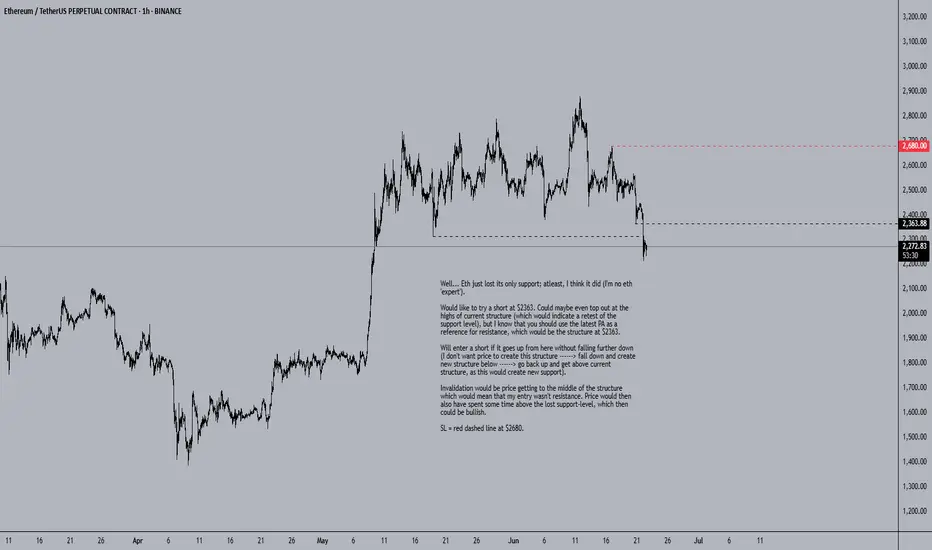
ETH Short SetupWell... Eth just lost its only support; atleast, I think it did (I'm no eth 'expert').
Would like to try a short at $2363. Could maybe even top out at the highs of current structure (which would indicate a retest of the support level), but I know that you should use the latest PA as a reference for resistance, which would be the structure at $2363.
Will enter a short if it goes up from here without falling further down (I don't want price to create this structure ------> fall down and create new structure below ------> go back up and get above current structure, as this would create new support).
Invalidation would be price getting to the middle of the structure which would mean that my entry wasn't resistance. Price would then also have spent some time above the lost support-level, which then could be bullish.
SL = red dashed line at $2680.
Still in the range(box of triangle)Keep an eye on candle pattern.
Especially, week candle.
( Hint🤫, No lower shadow(wick) usually makes price action. But there is high probability to make one more dip )

ETH Weekly – Eyes on $1900When panic creeps in, zoom out.
ETH on the weekly has lost both the 200MA and the 0.5 Fib.
In my opinion, if the BB center doesn’t hold here, price could retest the 0.618 Fib level a zone it tends to flirt with often.
The $1900 area might become a solid buy zone.
Always take profits and manage risk.
Interaction is welcome.

#ETHUSDT: Currently On The Way Towards Filling The FVG?ETCUSDT is currently experiencing a significant correction as the price approaches a pivotal juncture where a substantial bullish price reversal is anticipated, potentially propelling it to new all-time highs or even surpassing them. It is imperative to exercise meticulous risk management and conduct your own thorough analysis before engaging in any cryptocurrency trading or investment activities.
Should the price indeed undergo a major correction, it is likely to decline to our second designated area, where it is anticipated to fill the liquidity gap and subsequently reverse course, continuing its trajectory towards our established targets.
Please consider this analysis as a secondary influence only, or even solely for educational purposes. It is crucial to conduct your own independent analysis and risk management prior to engaging in any cryptocurrency trading or investment endeavours, as they inherently carry substantial financial risks.
We extend our best wishes and encourage you to trade safely and responsibly.
Should you wish to demonstrate your support, you are welcome to express your appreciation through likes, comments, or sharing this information.
Thank you for your consideration.
Have a pleasant weekend.
Team Setupsfx_

ETHEREUM for $750?In this chart, I am showing you the worst possible scenario. If we compare this cycle to the past, we see some very similar things on the weekly chart:
- Weekly RSI divergence
- Testing the 50-level RSI and the trend line from the bottom to the top
- Correction to the 0.5 fibbonacci level.
- Last time we had a war between Ukraine and Russia and now we have a war between Israel and Iran
- Last time everyone on X(twitter) was talking and cheering about Alt-Seoson and ToTheMoon and now we have the same situation, DYOR, check X
$750-800 for Ethereum are the lows of the two global channels. So it's a logical bottom. And after the price reaches the bottom, we can reach the top of the channel.
Hence after this mega-dump we will see #ETH at $18000-20000.
What do you think about this scenario?

ETh more dump to $2100-$2030Just recently hopped into ETH short. Aiming for $2100 to $2030
Market is correcting on the weekly tf and this is a probably area that it might use to create the new HL for continuation back up.
Time sensitive.
Stop: $2235-$2245 area. $2245 is safer a bit lower RR though.
