Ethereum's Road to $7500 – Strategic Entries & Profit Optimizati🔵 Entry Zone: My first position is placed at $2225.5, aligning with a strong support level, while a secondary entry at $1857.5 serves as an additional safeguard against unexpected market swings—lowering my average purchase price and protecting capital.
💰 Profit-Taking Strategy: For low-risk traders, securing a 40% profit from the first entry is a prudent move to lock in gains early. However, my long-term target remains ambitious.
🚀 Main Target: Based on valuation models and fundamental news, Ethereum’s upside potential points toward $7500. However, I personally plan to secure 90% of my holdings at $6000, ensuring strong profit realization while leaving room for further upside.
This setup balances risk management, smart positioning, and strategic profit optimization. Let’s see how ETH’s trajectory unfolds!
Entry1: 2225.5
Entry 2: 1857.5
If your second entry is successful, you are required to withdraw 50 to 70 percent of your capital to maintain your capital. I will definitely update this setup.
ETHUST trade ideas

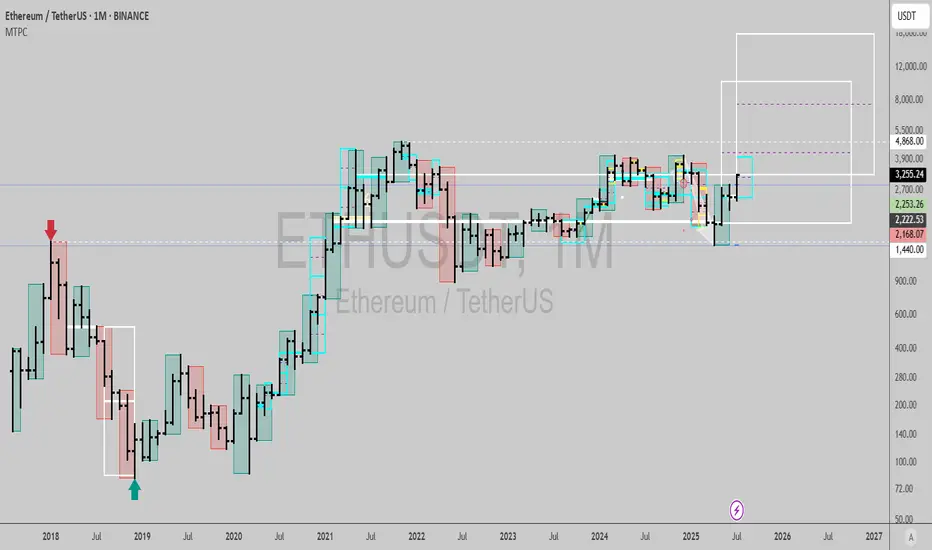
$ETHUSDT: Time at mode trend signalMonthly chart signal gives me a 17,975 United States of America Dollars per Vitalik Coin target🎯, within 19 months from now...
I don't think many people can fathom this but it is entirely possible, and probable now. (few bulls and those bullish mention 10k as a target, but nothing as high as this)
Best of luck!
Cheers,
Ivan Labrie.
ETH/USDT : $3000 Reached, It's time foe $4000? (READ)By analyzing the Ethereum chart on the weekly timeframe, we can see that the price has finally broken the strong $2700 resistance and pushed toward the next target at $3000! Currently trading around $3150 and now within the $3130–$3440 zone, I expect a short-term rejection from this area. However, given the overall market trend, this level may not hold for long, and we could soon see a breakout toward the next targets at $3500, $3740, $4100, and $4470!
Please support me with your likes and comments to motivate me to share more analysis with you and share your opinion about the possible trend of this chart with me !
Best Regards , Arman Shaban
THE LATEST ANALYSIS :

ETH to $4K ? Whales Accumulate as ETFs Break Records🕞 Timeframe: 4H
.
🟢 Bias: Bullish
1. 🧭 Fundamental Overview:
📈 Massive Institutional Inflows:
Ethereum ETFs have recorded over $1.2 billion in net inflows this July, with $908M just in the week ending July 11. This strong demand from institutional players (notably through ETHA and Bitwise) has pushed ETF AUM above $13.5 billion.
🏢 Corporate Accumulation:
Companies such as SharpLink Gaming have begun adding ETH to their balance sheets. SharpLink's 10,000 ETH (~$49M) purchase highlights growing corporate adoption of Ethereum as a store of value and strategic reserve.
🛠️ Ecosystem Resilience:
Ethereum continues to lead in network upgrades (e.g., Dencun), institutional DeFi, and tokenized assets—strengthening the long-term fundamentals of the chain.
2. 🧠 Sentiment & On‑Chain Metrics
🏦 Institutional Sentiment:
Ethereum ETFs have seen 12 straight weeks of inflows, outperforming Bitcoin in institutional allocation growth (ETH: 1.6%, BTC: 0.8%).
🐋 Whale Activity & Exchange Flows:
Declining ETH balances on exchanges suggest accumulation and reduced sell pressure. Whales and smart money are taking positions.
📊 Public Sentiment:
Bullish expectations remain strong amid price consolidation above key levels and positive ETF momentum.
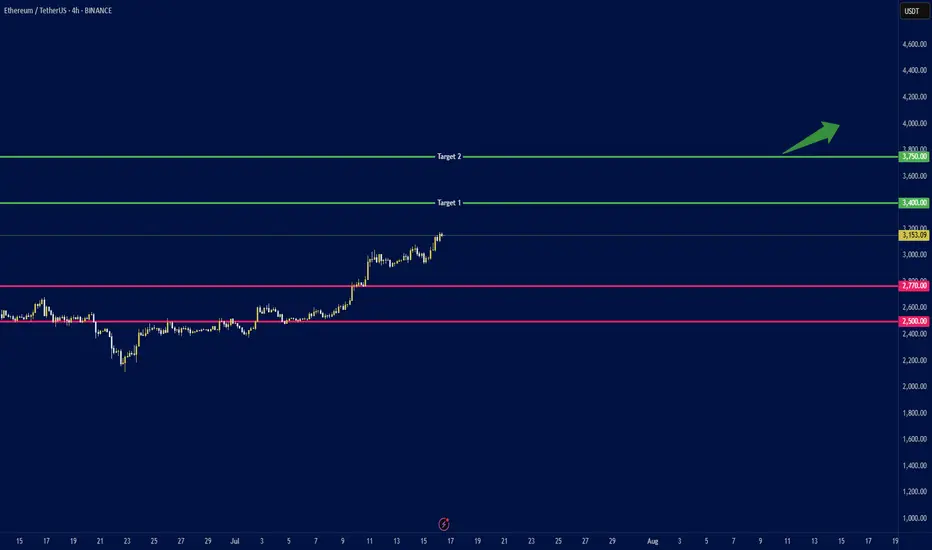
3. 🔼 Key Levels:
Support: $2,770 and $2,500 (major trendline and psychological level).
4.🎯 Price Targets:
Short‑term (2–4 weeks):
If ETH breaks above $3,150: next targets at $3,400 and $3,750.
Medium‑term (by end of Q3 2025):
ETH could reach $3,500 with potential upside to $4,000.
.
.
.
⚠️ Disclaimer: This analysis is for educational purposes and not financial advice. Please do your own research and risk management.
.
✅ If you like this analysis, don't forget to like 👍, follow 🧠, and share your thoughts below 💬!
ETHUSD – Final Resistance Test Ahead Ethereum is ripping toward a major historical resistance zone between $4,000–$4,300 — a level that rejected price cleanly in both 2024 and early 2025. With momentum high and sentiment bullish, this area becomes the real test of trend strength.
Failure here could form a triple top.
Breakthrough? Expect fireworks.
#ETHUSD #Ethereum #Crypto #ResistanceZone #SmartMoney #QuantTradingPro #TradingView

ETH Flash Crash Setup – Gaps Below to WatchEthereum broke out fast, too fast. In the process, it left two clear value gaps around $2850 and $2690 — areas where price barely traded. These usually get revisited.
I’m watching those zones for a potential flash crash setup. If we get a sharp wick down, that’s where I want to be a buyer. No chasing.
Limit orders layered in. Plan is simple:
$2850 — first tap
$2690 — full imbalance fill
Stops below $2600 if triggered
Not saying it has to happen, but if it does, I want to be ready. Mark your levels.
—
Trade safe. This is just my setup, not advice.

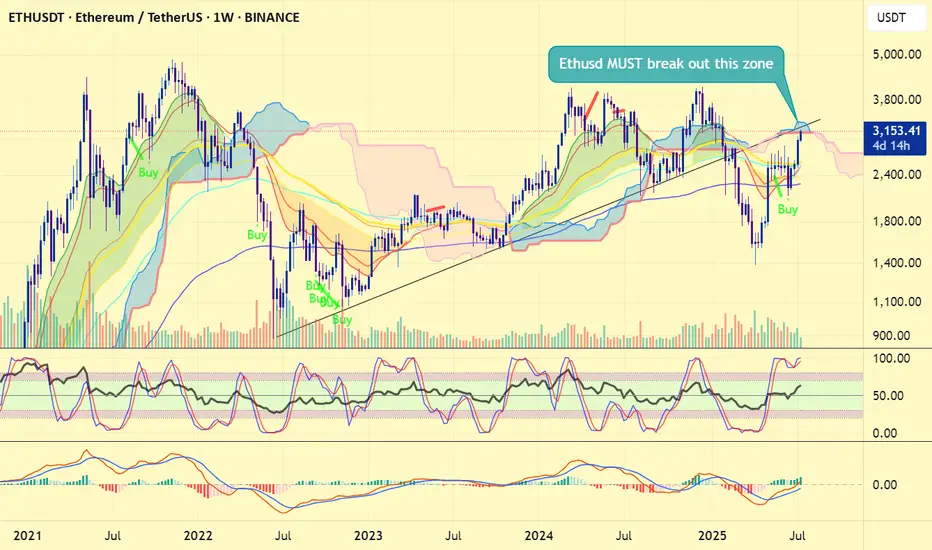
Ethereum price is critical now#ethereum #eth price is now testing very very important resistance zone now and this also the bearish retest if #ethusd fails to leap over 3500 usd. 4 months ago, #ethusdt breakdown the 3 years of trendline, heavily dumped below 1400 usd and bounced. Now, CRYPTOCAP:ETH is testing this 3 years of trendline resistance zone + weekly ichimoku cloud.
Therefore ETH price has no other chance to at least reclaim 3450 - 3500 usd. True bullrun requires a new ATH. Heavy declination at current zone will not be tasty. This week' s close will determine the things i think.
Not financial advice.
Ethereum (ETH): Buy Entry 2 Reached | $3300-$3400 IncomingNo remorse from buyers on ETH, where the price is pushing further and we are looking now at our new target, the $3300-3400 area, to be reached within this week.
There is not much more to talk about here, other than that we keep our bullish view (that we shared on a weekly timeframe).
Time for Ethereum to shine.
Swallow Academy

eth buy longterm"🌟 Welcome to Golden Candle! 🌟
We're a team of 📈 passionate traders 📉 who love sharing our 🔍 technical analysis insights 🔎 with the TradingView community. 🌎
Our goal is to provide 💡 valuable perspectives 💡 on market trends and patterns, but 🚫 please note that our analyses are not intended as buy or sell recommendations. 🚫
Instead, they reflect our own 💭 personal attitudes and thoughts. 💭
Follow along and 📚 learn 📚 from our analyses! 📊💡"

BUY ETHUSDT 16.7.2025Confluence order: BUY at M15
Type of order: Limit order
Reason:
- M15~FIBO 0,5-0,618 (same position)
Note:
- Management of money carefully at the price of sub key M15 (3152)
Set up entry:
- Entry buy at 3137
- SL at 3127
- TP1: 3152
- TP2: 3164
Trading Method: Price action (No indicator, only trend and candles)

ETH LONG TRADELooking for a retest of approximately $3000 for a bounce off the top of the prior channel.

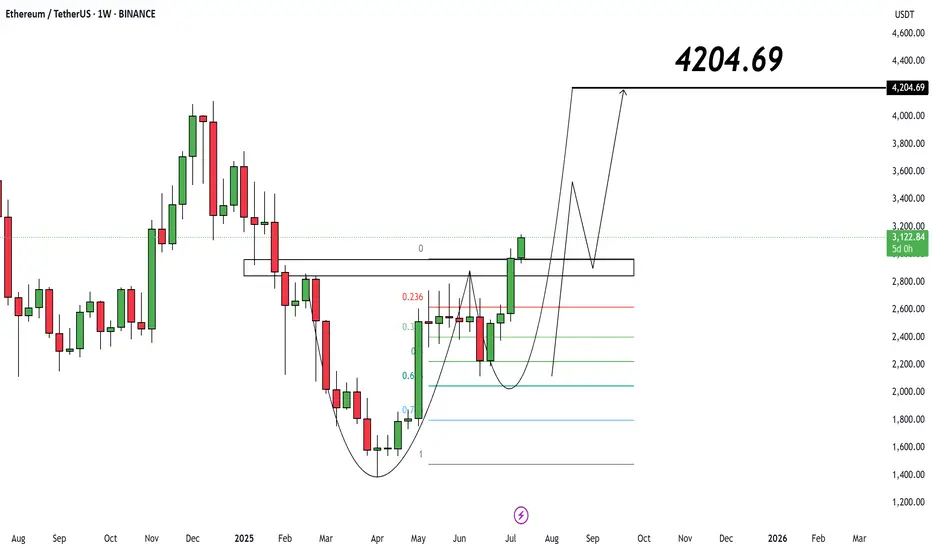
Ethereum ($ETH/USDT) – Weekly Analysis
Current Price: $3,127
📌 As long as ETH holds above $2,950, the bullish structure is intact.
🎯 Target:
• $4,204.69
🔍 Price is building momentum after multi-week consolidation. Pullbacks to $3K are potential re-entry zones.
$ETH IS GOING TO MAKE ATHsBitcoin amd Etheureum will continue to rise until Ethereum clears these highs. The market is not done yet.
Although, I expect Bitcoin to retrace and consolidate more, i expect more bullish scenario’s than Bearish.

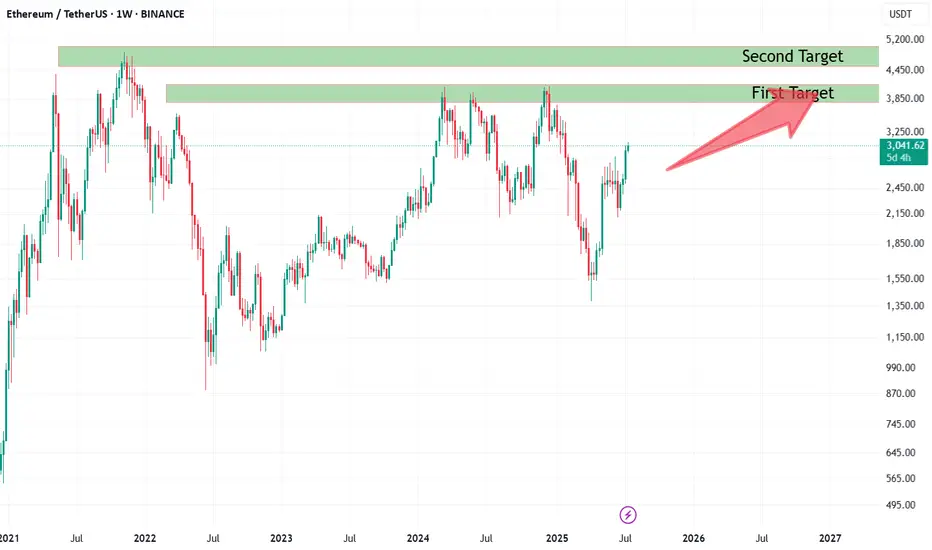
Binance Holds 25% of Exchange ETH: Smart Accumulation?According to cryptoonchain’s analysis of on-chain data from CryptoQuant, Binance now holds about 25% of the total Ethereum reserves across all exchanges. This significant figure could be a sign of smart accumulation by major market participants. Notably, Binance’s rising share has occurred while overall ETH reserves on exchanges have remained stable. In a situation where Ethereum’s price is still below its all-time highs—even as Bitcoin has set new records—this accumulation on Binance may signal that large investors are entering and expecting future price growth.
On the weekly chart, Ethereum is showing signs of strength and a possible continuation of its upward trend. If buyers maintain their momentum, the first target lies in the 3,900–4,200 zone, with the second target in the 4,850–4,950 range—close to previous all-time highs.
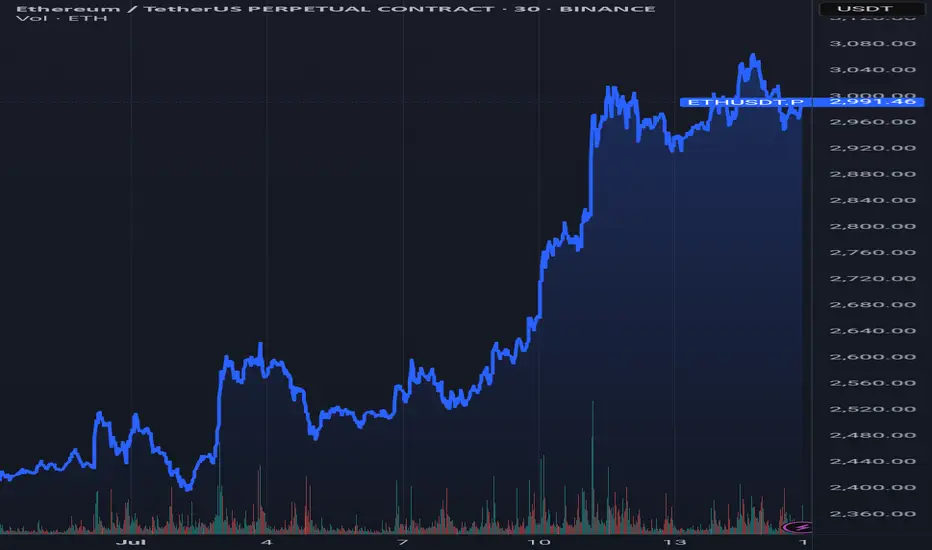
ETH is testing resistance. False breakout?ETH is gathering liquidity ahead of a possible decline
The gray square is the active buying zone. When the price returned below the 3040 level, a liquidation phase occurred. Against the backdrop of the news, a retest of resistance is forming, but not with the aim of breaking through the level, but with the aim of gathering liquidity for a move to 2960-2913.
A false breakout of resistance could trigger another phase of liquidation (correction) to 2961. A halt should be expected in the 2900 zone.

Don't miss Ethereum todayHello friends
Given the good rise we had, you can see that the price has entered a correction and has provided us with a good opportunity to buy in steps, of course with capital and risk management.
*Trade safely with us*

Ethereum trading planBINANCE:ETHUSDT showed a minor pullback compared to Bitcoin. The price attempted to retest the $3,082 level again but faced strong rejection. Right now, $3,043 is acting as our reversal level - if we break through it, we've got a clear shot at our monthly target of $3,259. But as long as we're trading below this level, our immediate target is to test the $2,800-$2,700 range. More details are in yesterday's video analysis
Watch the triggers, and happy trading

Ethereum:Daily signalhello guys👋
According to the drop we had, you can see that buyers came in and the price had a good growth, and after that a trading range was made in which the price got stuck.
Now, considering that the price is in the trading range and it seems that the buyers have shown their support, it is possible to step into the specified support areas with risk and capital management and move up to the set goals.
🔥Follow us for more signals🔥
*Trade safely with us*

When does Bolran start?Read carefullyhello friends👋
💰Many of you are asking when Bolran will start or if it will start at all, we decided to explain it to you in a full post.
Well, you can see the Ethereum chart moving in a channel, and with a drop, it created a big fear that a fall is coming, and meanwhile, the buyers returned the price to above 2000 dollars with a strong and unexpected return.
✅️Now the price is stuck in the specified box between 2200 and 2500, and if this range is maintained, the price will easily move up to the range of 3200 in the first wave, and if it fails to maintain this range, the price will fall below 1500 dollars.
🧐Now, in our opinion, due to the rapid return of the price from the channel, this failure is a fake channel and the range will be maintained, and we are likely to see Ethereum rise in the coming weeks.
🤔You know that Ethereum is the leader of altcoins, and if it grows, important altcoins will grow, which is the beginning of Bolran, and there are important altcoins that can be used for good profit.
🌟You can join us if you like.🌟
🔥Follow us for more signals🔥
*Trade safely with us*

HolderStat┆ETHUSD prepare for a breakthroughBINANCE:ETHUSDT is trending upward with strong conviction after triangle breakouts and clearing the $2,900 level. Structure points toward a move into the $3,300–$3,400 region. The trend is reinforced by repeated bullish retests and channel momentum.

Eth killer Today was a solid trading day with some interesting moves across the markets:
S&P 500: The market trended upwards from the open, gradually moving into and above the prior day’s value area, closing near the high of that range.
NASDAQ 100: After some initial back-and-forth, it climbed above the prior day’s high and value area, showing strength into the close.
Russell 2000: This market was quite choppy and balanced for a good part of the session, but eventually pushed up to close near the prior value area high.
Gold: It stayed range-bound, moving between the CVA high and the prior day’s value area without breaking out.
#ETH Update #3 – July 15, 2025#ETH Update #3 – July 15, 2025
After its recent impulsive move, Ethereum appeared to make a slight correction. However, this correction did not complete and instead formed a second peak. Since a full correction hasn't played out yet, caution is still warranted when trading Ethereum.
The first correction level is around $2,850, the second around $2,780, and the third around $2,700. If Ethereum pulls back to the second correction level, it will balance out the second imbalance zone created during the last impulse, which could allow for a healthier continuation upward.
As long as Ethereum doesn't break down below the $2,900 zone, I do not expect a correction. But if it does break below $2,900, corrections are likely to occur one after another.
At this point, neither a long nor a short position seems suitable for Ethereum.

Ethereum (ETH): Targeting $3300-$3400 | Detecting Buy ZonesIt's not a secret to anyone that we are targeting $3300-$3400 next on ETH, where we have detected 2 potential buy zones for us.
One of the zones is near the lower support area, where we should see proper MSB in order to enter into a trade, which would mean a switch in trend.
The second entry is upon forming BOS on upper zones, which would be the ideal buying entry for us if performed well (I mean the break of structure).
Swallow Academy
