When does Bolran start?Read carefullyhello friends👋
💰Many of you are asking when Bolran will start or if it will start at all, we decided to explain it to you in a full post.
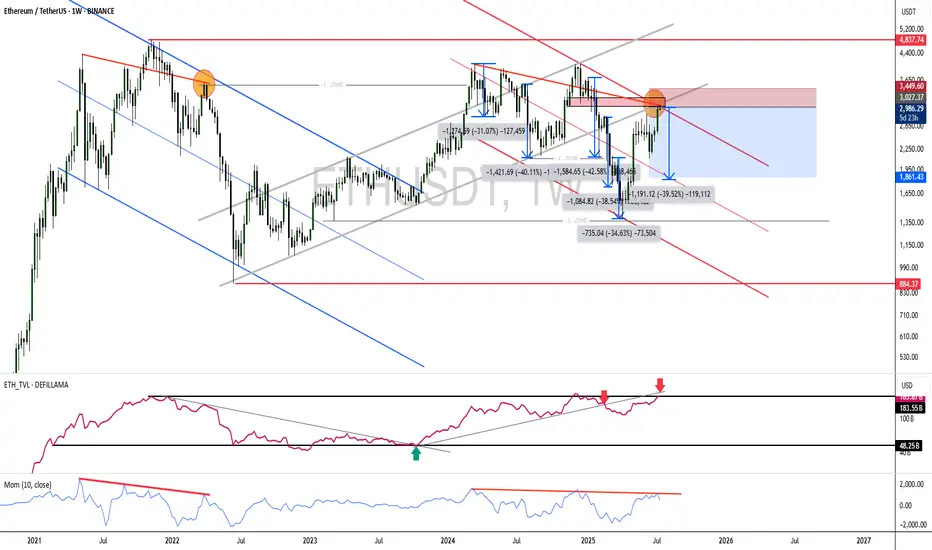
Well, you can see the Ethereum chart moving in a channel, and with a drop, it created a big fear that a fall is coming, and meanwhile, the buyers returned the price to above 2000 dollars with a strong and unexpected return.
✅️Now the price is stuck in the specified box between 2200 and 2500, and if this range is maintained, the price will easily move up to the range of 3200 in the first wave, and if it fails to maintain this range, the price will fall below 1500 dollars.
🧐Now, in our opinion, due to the rapid return of the price from the channel, this failure is a fake channel and the range will be maintained, and we are likely to see Ethereum rise in the coming weeks.
🤔You know that Ethereum is the leader of altcoins, and if it grows, important altcoins will grow, which is the beginning of Bolran, and there are important altcoins that can be used for good profit.
🌟You can join us if you like.🌟
🔥Follow us for more signals🔥
*Trade safely with us*
ETHUST trade ideas

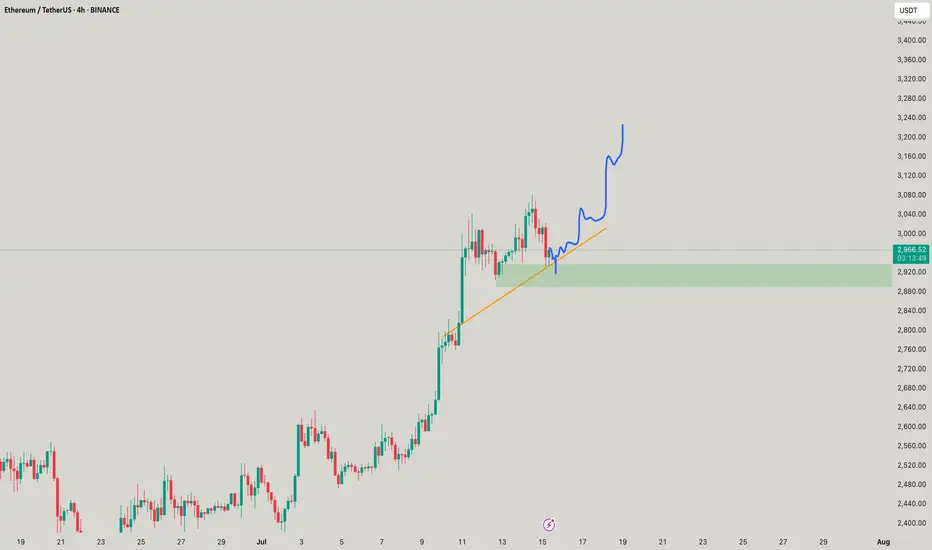
HolderStat┆ETHUSD prepare for a breakthroughBINANCE:ETHUSDT is trending upward with strong conviction after triangle breakouts and clearing the $2,900 level. Structure points toward a move into the $3,300–$3,400 region. The trend is reinforced by repeated bullish retests and channel momentum.

Eth killer Today was a solid trading day with some interesting moves across the markets:
S&P 500: The market trended upwards from the open, gradually moving into and above the prior day’s value area, closing near the high of that range.
NASDAQ 100: After some initial back-and-forth, it climbed above the prior day’s high and value area, showing strength into the close.
Russell 2000: This market was quite choppy and balanced for a good part of the session, but eventually pushed up to close near the prior value area high.
Gold: It stayed range-bound, moving between the CVA high and the prior day’s value area without breaking out.
#ETH Update #3 – July 15, 2025#ETH Update #3 – July 15, 2025
After its recent impulsive move, Ethereum appeared to make a slight correction. However, this correction did not complete and instead formed a second peak. Since a full correction hasn't played out yet, caution is still warranted when trading Ethereum.
The first correction level is around $2,850, the second around $2,780, and the third around $2,700. If Ethereum pulls back to the second correction level, it will balance out the second imbalance zone created during the last impulse, which could allow for a healthier continuation upward.
As long as Ethereum doesn't break down below the $2,900 zone, I do not expect a correction. But if it does break below $2,900, corrections are likely to occur one after another.
At this point, neither a long nor a short position seems suitable for Ethereum.

Ethereum (ETH): Targeting $3300-$3400 | Detecting Buy ZonesIt's not a secret to anyone that we are targeting $3300-$3400 next on ETH, where we have detected 2 potential buy zones for us.
One of the zones is near the lower support area, where we should see proper MSB in order to enter into a trade, which would mean a switch in trend.
The second entry is upon forming BOS on upper zones, which would be the ideal buying entry for us if performed well (I mean the break of structure).
Swallow Academy

ETHEREUM → Correction to 2900 before growth BINANCE:ETHUSDT is entering a correction after a strong breakout of resistance. At the same time, Bitcoin is falling from 123K to 116K, triggering a pullback across the entire market...
On D1, ETH is facing strong resistance and is not yet ready to break it (it lacks strength after the rally). The most likely scenario after a false breakout is a correction to support. But the main focus is on Bitcoin — will there be a correction or a reversal of the local trend? If the flagship continues its decline, the cryptocurrency market will humbly follow suit.
ETH has a nearest zone of interest at 2913, where liquidity capture could attract buyers, but I do not rule out the possibility that the correction could go much deeper before further growth, for example to 2879-2827 (support on D1).
Resistance levels: 2992, 3041
Support levels: 2913.7, 2879, 2827
Technically, consolidation against a bullish trend. Confirmed support area 2913 - 2879. As part of the correction, the market is interested in capturing liquidity. If, against the backdrop of the current correction, the bulls manage to hold their ground above the specified support, ETH may still surprise us with its growth :)
Best regards, R. Linda!

ETHUSDT Ready for 3K$ and New possible ATH after YearsSoon Red trendline resistance And 4K$ resistances will break and market will easily continue this bull Move and reaching new highs here After each other.
I am expecting more rise here at least to 3500$ near red trendline resistance and only after a valid breakout there more pump is expected like green arrow.
DISCLAIMER: ((trade based on your own decision))
<<press like👍 if you enjoy💚

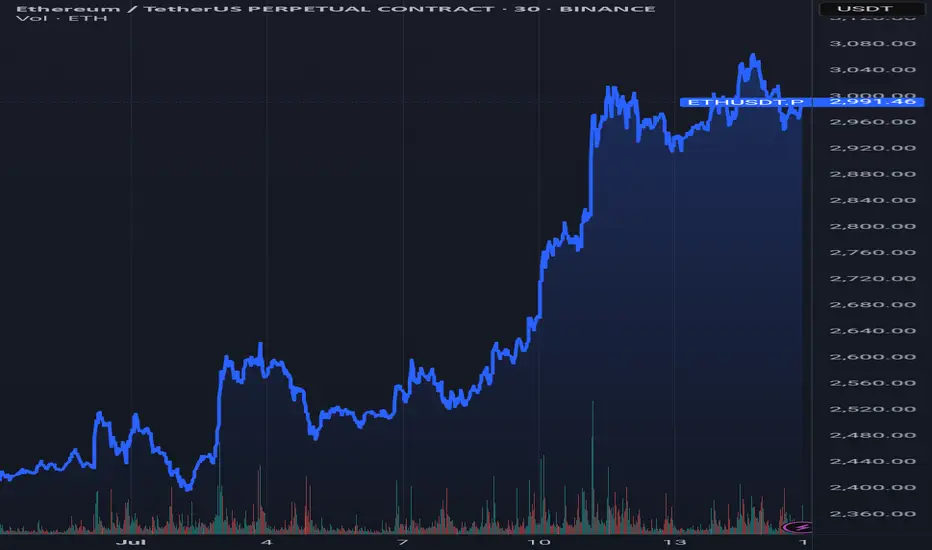
ETH - Can it go $3200??Yes looks good until stays above 2890, all buys are good in this range as scalps! AWESOME aint it?
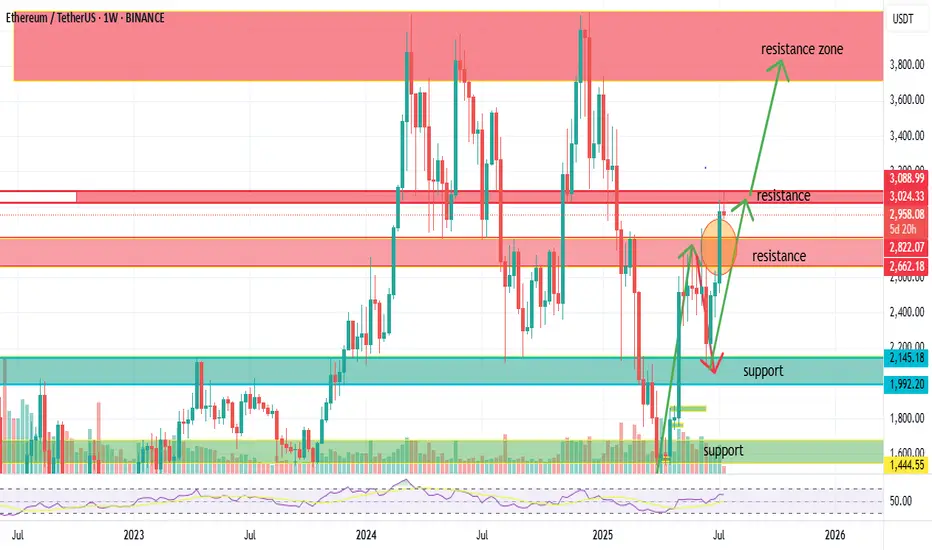
Ethereum Just Broke Out! Is $4,000 Next?Looking at the chart, ETH had a solid bounce from the key support zone around $1,992 to $2,145.
After consolidating, ETH broke above the critical resistance zone between $2,600 and $2,822 last week.
And more importantly – ✅ Last week’s candle closed firmly above this zone, backed by strong volume.
This was one of the most difficult resistance areas in recent months – and now that ETH has broken it, it’s a clear confirmation that the bullish trend is continuing.
🎯
📌 With this breakout confirmed, ETH is now targeting the next major resistance between $3,100 and $3,750.
If that area gets cleared, we could see a move toward the psychological level of $4,000.
📌 However, if ETH faces rejection at $3,100 – we may see a pullback to retest the breakout zone around $2,822 – $2,662 before another leg up.
📈
RSI is currently neutral and has room to climb – a good sign for further upside
Volume on the breakout was strong, confirming that smart money is stepping back in
🎙️
So here’s the bottom line:
✅ ETH successfully broke out of the $2,600–$2,822 resistance zone
✅ Weekly candle closed strong with high volume
✅ Uptrend looks ready to continue
🎯 Short-term target: $3,100 – $3,750
🎯 Long-term breakout target: $4,000+
📌 Support zone to watch: $2,822 – $2,662 (for potential retest)
⚠️ Disclaimer: This is just my personal analysis – not financial advice.
Always do your own research and manage risk properly!
👉 Follow Dat Vinh Airdrop for more solid crypto insights every week!
Is ETH overextended and due for a correction?For those holding ETH, this is a good point to set up a hedge using derivatives.
If the price keeps going up (which I think is unlikely at this moment—perhaps it will move sideways), buying at these levels is crazy.
In fact, there’s been a recent rally, full of people on X and YouTube saying this is the big moment to buy… That immediately raises a red flag for me!
And what about the FEDFUNDS? Have you taken a look? Haha, just something to think about.
--
After a long time away from TradingView and the community, I’m back to breathe some life into it!
Missed you all — let’s enjoy life and make the most of what it has to offer!
Ethereum Just Hit Resistance — Will It Explode or Recoil?Ethereum has powered through previous resistance levels, riding a clean ascending trendline and now entering a key supply zone around $3,000. While bulls have dominated the recent run, price is now brushing up against historical resistance with Stoch RSI entering overbought territory.
This is a pivotal area — if ETH breaks through with volume, the next target sits near $3,400–$3,700. But if momentum fades, a pullback into the $2,800 zone or even a retest of trendline support could offer better entries.
Momentum is hot, but traders should stay sharp — this zone has rejected price before. Smart money watches reactions, not just breakouts.

Can a Bear Market Start With Ethereum At $3,000?Ethereum produced sideways action for 49 days, 7 weeks. Immediately after seeing this I realized the next logical step was a bullish breakout, and the market moved up. But this isn't all. Ethereum is still trading at $3,000, more than $1,800 away from its all-time high.
Now, thinking about the doubt that always creeps up when the market becomes bullish confirmed, I want to clear things up if at least for you. While others can continue to doubt and will continue to do so, many others will even SHORT and lose everything, you will be happy knowing that the market will experience additional growth. You will also be making profits as the market grows. You will be happy because you know for a fact, based on data, that we are set to experience sustained long-term growth.
A bear market can only develop after a bull market. A bull market ends in a major high or new all-time high. Current conditions for ETHUSDT are far from being "peaky." There is no new all-time high. Actually, prices are still relatively low.
First Ethereum needs to challenge its previous all-time high, create a new one and then we can talk about a bear market or correction. We know for a fact that Ethereum is bullish based on recent price action and the chart. We know for a fact that Ethereum will grow because Bitcoin is already high up. Ethereum is the #2 Crypto and what Bitcoin does it tends to follow.
Bitcoin is super strong but this is not to be confused as weakness. Weakness comes when the market has been growing for too long, growth becomes heavy and a drop happens next. Strength happens when the market has been sideways for months, breaks up and produces a major advance (now). This type of pattern predicts additional growth.
Bitcoin is the king and what Bitcoin does the rest follows. You can expect additional growth.
The reason why the bullish cycle is not yet over is because prices are still too low. Many altcoins are trading near all-time lows. Think about it. A bear market develops from all-time highs and bull markets develop from all-time lows. We are only at the start of a major bullish cycle, phase and wave.
The proof is in the chart. A major low was hit 7-April 2025, the lowest since March 2023. This marks the end of the correction and the start of the 2025 bullish phase. I don't know if Ethereum will grow for years or only for a few months. I know with 100% certainty that the Cryptocurrency market will continue to grow. You can bet your house on it.
Thanks a lot for your continued support.
Namaste.

ETH — 3D OB + FVG Swing Long | #3D | BULLISH1️⃣ Buy zone: 2,500–2,600
2️⃣ TP: 3,280–3,495
Stop: < 2,500
Alert: FVG fill

ETH - Confirmed target is 4100- After successfully breakout from the major resistance price is heading towards the next resistance line.
- From the previous all time high, we have a clear resistance around 4100 range.
- We can expect this bullish trend to continue easily and reach the next resistance around 4100.
Stay tuned for more updates
Cheers
GreenCrypto

#ETHUSDT: Time For Big Price Distribution! Get Ready $5000ETH is currently in distribution and is on our target list. We expect a smooth price movement, potentially reaching $3100, $3800, and $5000. Use the entry zone to take a position; anything below the entry will invalidate the idea. Please use accurate risk management while trading.
Like, comment, and share this idea to encourage us to post more.
Team Setupsfx_

#ETHUSDT: Currently On The Way Towards Filling The FVG?ETCUSDT is currently experiencing a significant correction as the price approaches a pivotal juncture where a substantial bullish price reversal is anticipated, potentially propelling it to new all-time highs or even surpassing them. It is imperative to exercise meticulous risk management and conduct your own thorough analysis before engaging in any cryptocurrency trading or investment activities.
Should the price indeed undergo a major correction, it is likely to decline to our second designated area, where it is anticipated to fill the liquidity gap and subsequently reverse course, continuing its trajectory towards our established targets.
Please consider this analysis as a secondary influence only, or even solely for educational purposes. It is crucial to conduct your own independent analysis and risk management prior to engaging in any cryptocurrency trading or investment endeavours, as they inherently carry substantial financial risks.
We extend our best wishes and encourage you to trade safely and responsibly.
Should you wish to demonstrate your support, you are welcome to express your appreciation through likes, comments, or sharing this information.
Thank you for your consideration.
Have a pleasant weekend.
Team Setupsfx_

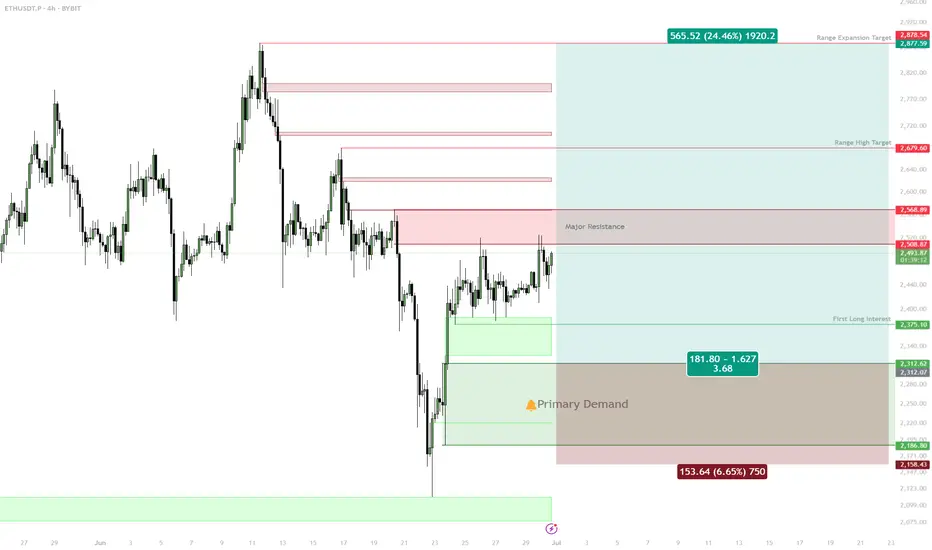
ETH: Deep Retrace or Shallow? Two Key Long Zones into Next Week✅ Two main long setups: Equal Lows @ $2,376, Untapped Demand $2,250–$2,314
✅ Best R/R from deeper demand zone, but will watch both levels
✅ Targets: $2,738 (range high), ~$3,000 (expansion)
✅ Shallow retrace may limit upside to a new local high, not full expansion
Setup 1:
Buy trigger on sweep and reclaim of $2,376 (equal lows)
Target: $2,508, then $2,738
Setup 2:
Preferred: Buy trigger into $2,250–$2,314 untapped demand
Target: $2,738, $3,000
Risk:
Wait for reaction/confirmation at both zones; no FOMO in between
🚨 Risk Warning:
If no strong bounce from these levels, stand aside — don't force the setup.
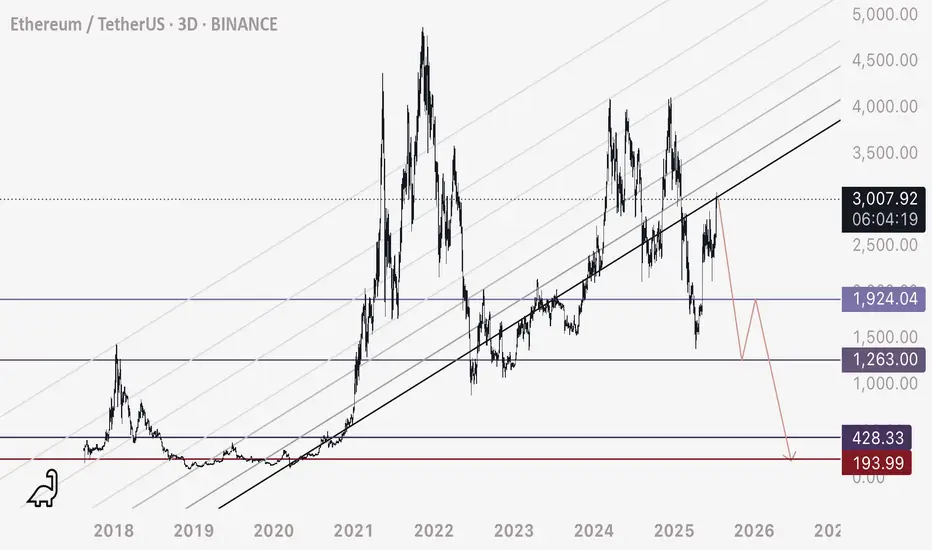
ETH - Potential Cycle Top hereETH is showing a potential cycle top per this parallel ascending channel.
Resistance would be around 3020 zone - if the channel breaks down, we may see these ultra low zones get hit if the macro landscape supports such a drastic fall.
Happy trading.
ETH-----Buy around 3000, target 3070 areaTechnical analysis of ETH contract on July 14:
Today, the large-cycle daily level closed with a small positive line yesterday, the K-line pattern continued to rise, the price was above the moving average, and the attached indicator was running in a golden cross. The general trend of rising was relatively obvious, but it was not as strong as the big cake. The previous historical high was in the 4877 area in November 2021, so in this way, the later rise may be more fierce than the big cake; the short-cycle hourly chart intraday starting point is in the 2970 area, and the current K-line pattern shows a trend of continuous negative retracement. The attached indicator is running in a golden cross, but the general trend is still strong. The four-hour chart retracement moving average support is in the 3000 area.
Today's ETH short-term contract trading strategy:
Purchase in the 3000 area, stop loss in the 2970 area, and target the 3070 area;

Weekly trading plan for EthereumBINANCE:ETHUSDT Price has broken through the psychologically significant $3,000 level, but we're now seeing a clear 4-hour RSI divergence. Historical patterns suggest this divergence has a high probability of playing out. Expect potential correction initiation within the next 48 hours
Should the rally continue toward final targets:
The existing divergence may strengthen
A daily timeframe divergence could form
I'll await confirmation before considering short positions
As always, manage your risk wisely

$ETH LONG POSISI I see potential In CRYPTOCAP:ETH Hi break high , i will take hi for retectment area and order block .
If u want entry area see on chart

ETH's Situation, A Comprehensive Analysis !!!As I said, and no one believed, the cup and handle pattern has completed and broken out, which could quickly drive the price above $4000.
previous Analysis
Best regards CobraVanguard.💚

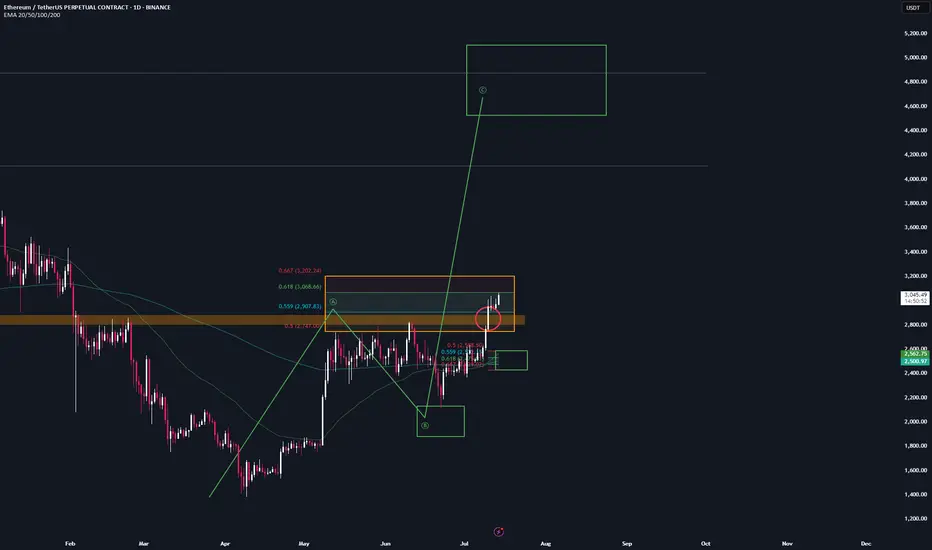
ETH - Trade setup📌 After the breakout from the last high at 2.9k, a bullish sequence (green) has now been activated.
📊 These setups typically occur no more than twice per year on any given altcoin, so I’ll be aggressively buying each level at the B-C retracement area.
Trademanagement:
- I'm placing long orders at each level. ((If the price continues climbing, I’ll adjust the trend reversal level (green) accordingly and update my limit orders.)
- Once the trade reaches a 2 R/R, I’ll move the stop-loss to break-even.
- From a 3 R/R onward, I’ll start locking in profits.
✅ I welcome every correction from here on —
but I won’t enter any new positions at these top levels.
Stay safe & lets make money