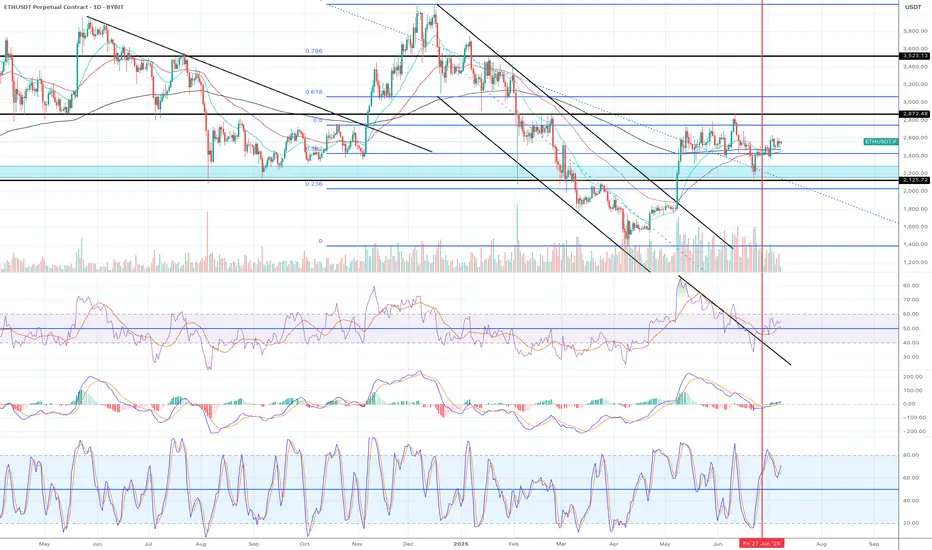
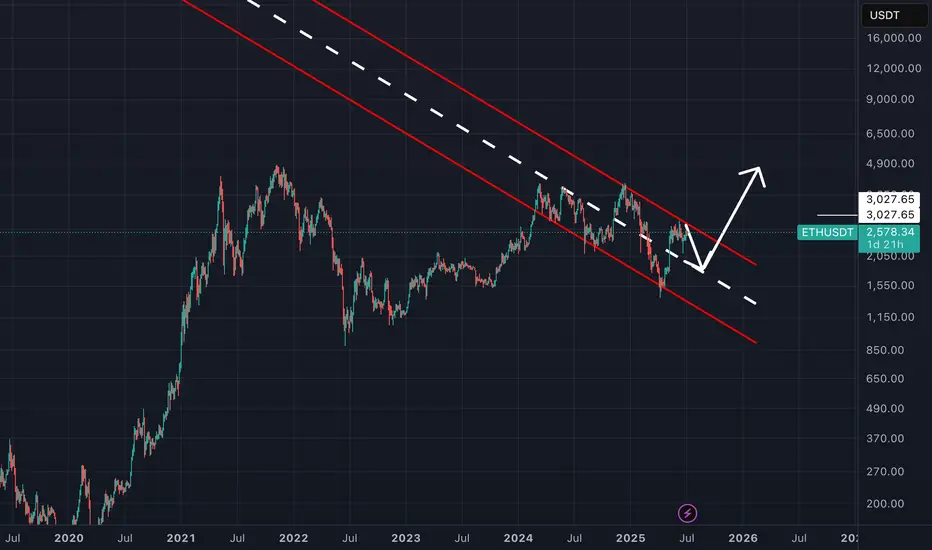
Time to go long!!
1) A candle broke out and closed above the descending parallel channel.
2) The price has been consolidating above Fib0.0382 level for weeks.
3) The recent candles are sitting above EMA21.
4) EMA 21 is above EMA55.
5) EMA200 is running horizontally still but it is getting close to cross EMA55.
6) All momentum indicators are in the bull zone and still plenty to go before it hits overbought territory.
There might be a strong breakout to the upside.
It is time to go long.
ETHUST trade ideas
Ethereum (ETH): Buyers Showing Dominance | $2800 IncomingBuyers are doing a great job currently, keeping the price above the EMAs (which also have been marked by us as a retest area after we did that break of structure on the 2nd of July).
Now as long as we are above our buy zone, we are bullish on ETH. As many know, we are far away from the potential of ETH and the first target is at $2800-$3000.
Swallow Academy

$ETH - SELL to BUY BiasOn the Daily Timeframe, Ethereum cleared the liquidity sitting on the $1755 zone and bounced off the support around $1500 region. It then rallied hard and swept the liquidity at $2800 , doubling and confirming it as a solid Resistance zone.
Using strong buy rejection and good volume as confirmation, a sell from the $2700 - $2750 zone is feasible, with target at the liquidity sitting at $2100 - $2110 zone.
We then, can consider buying from any POI below that zone.
Remember to REACT and not PREDICT. DYOR‼️

Ethereum Faces Key Resistance: Potential Pullback AheadHello Guys!
What I see:
Head and Shoulders Pattern:
Left Shoulder: Formed
Head: Peak, followed by a drop.
Right Shoulder: Formed.
The neckline break around $2,450 initiated a downside move, confirming the bearish setup.
Current Price Action:
ETH is currently trading near $2,519, attempting to reclaim the broken neckline zone, which now acts as resistance.
The price action is showing lower highs, hinting at weakening bullish momentum.
Bearish Retest in Progress:
The chart shows an anticipated bearish retest of the support-resistance flip zone ($2,530–$2,550), with a probable rejection leading ETH back down toward the $2,440–$2,450 support zone.
Demand Zone:
A strong demand area is visible between $2,420–$2,450. Price may revisit this zone before making the next major move.
Trend Channel:
ETH is moving within an ascending channel, and the lower bound coincides with the highlighted demand zone.
________________________
Let's check this deja vu:
You can see that previously the price formed an H&S and after that did a hunting of the head! And after that price experienced a drop there! Same scenario here!

ETH - Should I go long?Ethereum (ETH) is currently positioned at a critical juncture, with multiple technical and fundamental indicators suggesting the potential for a significant move ahead.
Current Price and Momentum: As of the latest real-time data, ETH is trading at $2,549.97, having recently started a fresh increase above the $2,520 zone. The price is above both the $2,550 level and the 100-hourly Simple Moving Average, indicating short-term bullish momentum.
Key Resistance Levels: The immediate resistance is near $2,600, followed by $2,620 and a major barrier at $2,650. A decisive break above $2,650 could open the path toward $2,720 and potentially $2,800 in the near term.
Support Levels: On the downside, $2,520 is a key support zone. A sustained drop below this could trigger declines toward $2,500 or even $2,420, but as long as ETH holds above $2,520, the bullish structure remains intact.
On-Chain and Institutional Signals: Long-term holders have been accumulating ETH, and institutional inflows have surged, with over $750 million invested recently. This accumulation, alongside strong ETF inflows and rising staking activity, points to growing confidence and could act as a catalyst for a major price move.
Technical Patterns: ETH is consolidating above critical moving averages and within bullish chart formations (such as ascending triangles and coiling structures). These patterns often precede significant breakouts, especially when accompanied by increasing trading volumes and improving momentum indicators.
Market Sentiment: While short-term indicators show some cooling, the broader trend remains bullish. Analysts note that if ETH can break above the current resistance cluster, it could ignite a new wave of bullish momentum and set the stage for a broader breakout.
In summary: Ethereum is at a pivotal resistance zone. If it can break and hold above $2,600–$2,650, analysts expect a strong move higher, with targets at $2,800. Institutional inflows, strong on-chain accumulation, and bullish technical setups all support the case for a significant upside move in the coming weeks or months, provided key support levels are maintained.
Note that a possible correction of Bitcoin (which essentially will result in a drop of the entire crypto market) is possible in the next weeks.
#crypto #eth #btc #bitcoin #ethereum #analysis #trading #portfolio #long #algorithm #buysellsignals #tradingsignals #bullrun
Ethereum (ETH): Buyers Back in Control | From $2570 to $2800?Ethereum is still strong on the 1D timeframe, we are seeing the EMAs being controlled by buyers and secured, which is opening for us the gap to move towards the $2800 area.
What we want to see now is a proper BOS on the current timeframe at $2600, which would then be an ideal entry for a smaller long position!
Swallow Academy

Ethereum (ETH): Still Cheap Don't You Think? | $2800 NextEthereum is still cheap compared to what is about to happen. Now saying "about to happen" is a little broad, saying as it might be weeks or months until we see the full potential of ETH but we are bullish for sure.
Bitcoin had its moment of money inflow and now money has to flow somewhere else, which should be ETH. This is the next stage for the bull market and that's what we are looking for.
Targeting currently $2800, but overall we want to see at least $4000.
Swallow Academy

#ETH Update #1 – July 7, 2025🟢 #ETH Update #1 – July 7, 2025
Ethereum is currently testing a resistance level that dates back about 30 days . I’m seeing long upper wicks forming here, suggesting a potential rejection from this zone. Price still hasn’t cleared its previous impulsive high, and this resistance could push ETH back toward the $2,480 level.
As long as ETH holds above $2,480, I don’t see any major concern. But if it loses that support, I’ll be watching the $2,375 level next. Below that, there's a visible imbalance around $2,320, which could act as a magnet for price.
For me, a long position becomes valid above $2,635 with momentum and confirmation. On the flip side, if ETH breaks $2,480 to the downside with strength, I may consider a short setup toward $2,327 .
But for now, I’m staying out. No position until the chart speaks more clearly.

Long opportunity in ETH/USDT.PSThe 2516.37 level has already been broken. So we need to wait to retest the same level.
Reasons : -
1. 30 MIN BOS.
2. it retested the fibonocci 0.611 level.
Entry : 2516.37
TP : 2545.27
SL : 2502.29
Disclaimer : I'm not recommending to take this entry. Do with your analysis too.

eth is waking upETH is finally waking up, but it is likely that there is still one more weekly dump before the real melt up.
ETH : BUY...Hello friends
Due to the entry of buyers and the breakdown of the trading range, we can buy in the direction of the trend and with capital and risk management within the specified limits and move to the specified targets.
*Trade safely with us*

ETH SHORT LIMIT2510–2525 SHORT
TP - 2465 / 2430
SL - 2545
The old pending order is no longer valid, easy to mistakenly touch the high short, resulting in a reverse stop loss

Sunday, 6 July 2025 - ETH/USDT.P ShortTrading Journal Entry: ETH/USDT SHORT
Date of Entry: July 7, 2025
Asset: ETH/USDT Perpetual Futures
Position: SHORT
Entry Price: $2,580.00
Stop Loss: $2,615.00
Take Profit: $2,510.00
Risk/Reward Ratio: 2.00:1
Setup Grade: A+
1. Core Thesis
The trade is a high-confluence short position designed to capitalize on a probable liquidity hunt below an obvious daily support level. The core thesis is that the market is incentivized to purge over-leveraged longs, whose positions are revealed by order flow data, within the context of a clear daily downtrend.
2. High-Timeframe Context (The Strategic Landscape)
My analysis began with a top-down approach to understand the broader market environment.
Weekly Context: The market is in a large-scale consolidation range. This tells us that expecting a massive, sustained trend breakout is a lower probability. Instead, trading between major support and resistance zones is the governing dynamic.
Daily Context: The immediate trend on the daily chart is bearish. Price had established a series of lower highs and lower lows, bringing it down to a major area of historical support and the Volume Profile Point of Control (POC) around the ~$2,550 zone. This created the central conflict: a bearish trend meeting a significant support level. A naive analysis would be to buy this support.
3. Order Flow & Sentiment Analysis (The Deciding Factor)
This layer of analysis was the key to resolving the trend vs. support conflict and formed the backbone of my bearish bias.
Liquidation Analysis: The liquidation maps revealed a very large and proximate pool of long liquidations clustered between $2,470 and $2,500. This liquidity acts as a powerful magnet for price, as market makers are incentivized to push price toward these zones to absorb orders.
Funding Rate Analysis: Funding rates across almost all exchanges were consistently positive. This provided clear evidence that derivative traders were predominantly positioned long, were paying a premium to maintain those longs, and were betting on the daily support holding. This identified a crowded trade.
Synthesis: The presence of a large downside liquidity target (the "magnet") combined with a vulnerable and crowded group of participants (the "fuel") created a high-probability scenario for a contrarian move. The path of least resistance was for the market to push through the "obvious" support to liquidate these longs.
4. Tactical Execution (The Entry Trigger)
With a firm directional bias, the final step was to find a low-risk entry.
4-Hour Structure: The price action at the daily support level was weak. The 4H chart showed a low-volume, sideways consolidation, not a strong bullish rejection. This lack of a decisive bounce was my first clue that the support was fragile.
1-Hour Entry Pattern: I identified the perfect entry trigger by observing the 1H chart.
Price staged a minor rally toward the $2,580 resistance level.
Crucially, this rally occurred on visibly declining volume, signaling a lack of genuine buying interest. It was a corrective, not an impulsive, move.
My entry at $2,580 was placed at a clear support-turned-resistance flip zone, allowing us to short into weakness at a favorable price.
5. Risk Management (The Trade's Foundation)
Stop Loss ($2,615): The SL was not an arbitrary price but a logical invalidation point. It was placed just above a recent 1H structural swing high. A move above this level would have proven the "weak rally" thesis incorrect and signaled that buyers had taken control.
Take Profit ($2,510): The TP was chosen for two reasons:
Rule Compliance: It mathematically secured my required 2:1 risk/reward ratio.
Strategic Placement: It sits just ahead of the psychological $2,500 level and the densest part of the liquidation pool, increasing the probability of a fill before any potential support-driven bounce.
This trade represents a textbook example of my strategy: using high-timeframe analysis to build a directional bias, confirming it with order flow and liquidity data, and executing with precision on a low-timeframe pattern, all while adhering to strict risk management rules.

FULL MARGIN TEST ETH✅ 2. ETHUSD (Strong bias rising)
Entry: 2565 Long on retracement
Stop Loss: 2540
Take Profit: 2600
Recommended lot size: 0.20 lot (1:100)

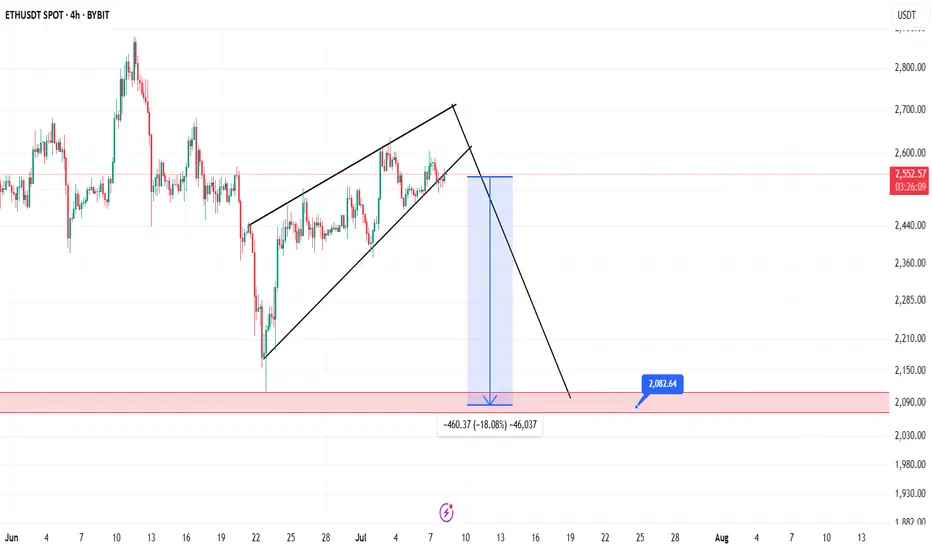
Classic Bear Flag formation on ETH day chartprice has been hovering in a a range for sometime before the last high made was on june 11th when ti touched 2879 and a low was made on june 22nd when it was 2115 since then price has moved up but has made a lower high of 2637 on 3rd july and now is trading around 2550 giving a classic bear flag appearance to the structure if the price breaks down below 2480 then we may see a max down move towards 1900-1800 consolidation in this range can happen and the price will start its upward trajectory as shown in the chart towards 3000-4000 range

ETHEREUM TRADE PLAN!!!Ethereum still remains bullish, especially on the daily timeframe there's a +OB/BISI supporting the price.
My focus is on the "4-Hour TF" I want to see price revisit (BISI) level as a more favorable entry point for continuation. This level aligns with a key bullish order block, which I anticipate will draw price down before resuming the uptrend.
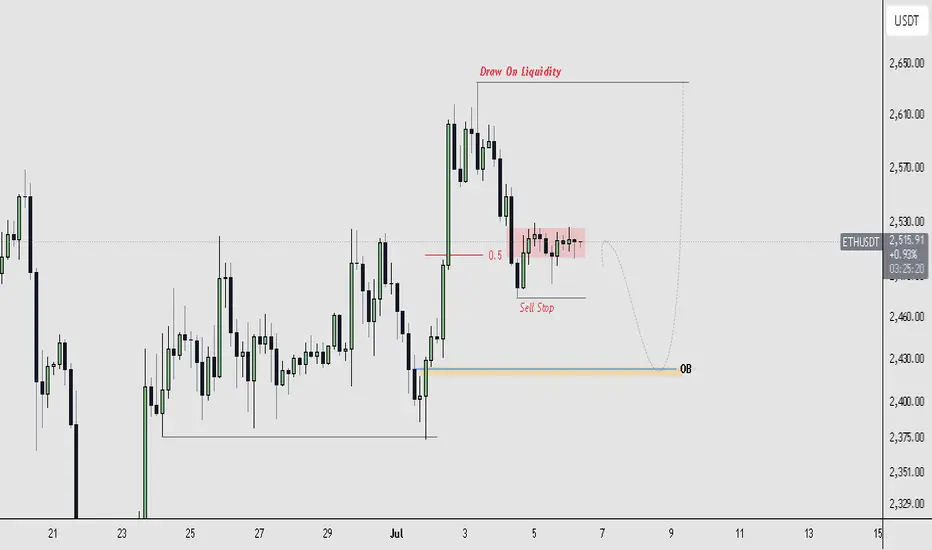
ETHUSDT - BEARISHETH/USDT Chart Overview (Short-Term Trading Idea)
- **Current Price**: ~$2,516.91
- **Volume**: 11.91K (moderate activity)
---
### 💡 **Trading Idea: Short-Term Bounce Play and then bloodbath.**
#### ✅ Setup
- Wait for ETH to retest the $2,100–$2,2000 support zone
- Look for bullish candlestick patterns (e.g. engulfing, hammer)
- Confirm with rising EMA or bullish divergence in RSI (if available)
#### 🚀 Entry
- Buy near $2,280 if price shows strength
#### 🛑 Stop Loss
- Around $2,220 (below recent support and wick levels)
### 🧠 Notes for Strategy
- Keep your position size conservative due to high intraday volatility.
- News around BTC can affect ETH—watch both charts.
- Great for scalping or a quick day trade, not ideal for long-term holds in this timeframe.
NFA
DYOR

Wait for ETH to rebound to $2528-2542 and place a short order.Short
$2528~$2542
Take Profit
$2480, $2460
Stop Loss
$2555
If the price falls below $2510, do not chase short, wait for a rebound.

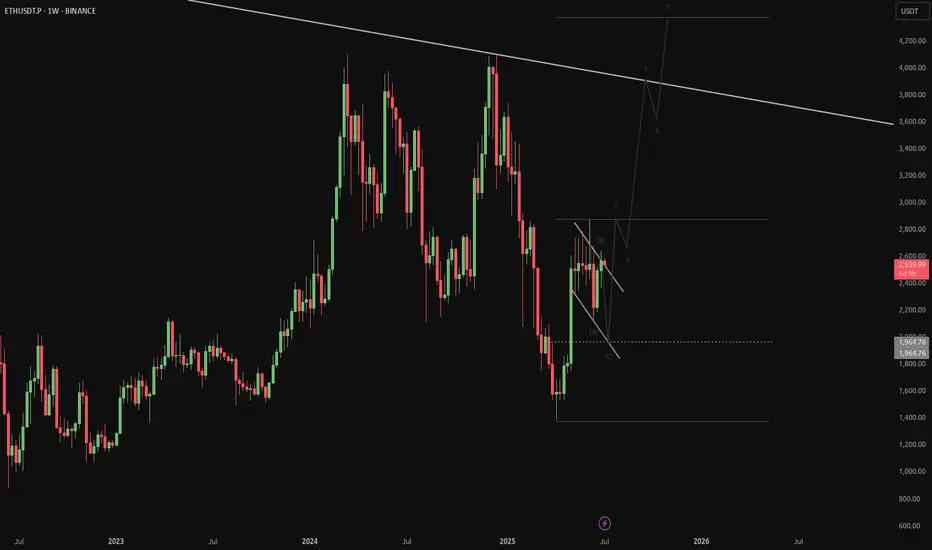
Eth revealed If you want to know the simplest way to trade in ETH for the next few years.
This is how Eth is moving.
We will discuss this further in January 2027.

Why You Still Lose Money Even With Perfect AnalysisYour setup was on point, your entry was clean, your stop-loss was tight.
Everything looked perfect.
And yet, you still lost.
Maybe the real issue isn’t in your chart, maybe it’s in your head.
Hello✌
Spend 3 minutes ⏰ reading this educational material.
🎯 Analytical Insight on Ethereum:
BINANCE:ETHUSDT is currently trading inside a well-defined parallel channel 📈. It is approaching a key daily support level that coincides with an important ascending trendline. A breakout above this channel could lead to a bullish move, targeting at least a 16% gain with a primary resistance zone near $2900 🚀. Monitoring how price reacts around this area will be critical for confirming the next leg up.
Now , let's dive into the educational section,
🧠 Analysis Is Half the Game
Having a clean technical analysis doesn’t guarantee anything if your behavior ruins it.
Most traders change their minds mid-trade because of fear, hope, or noise from other sources.
Market psychology doesn’t always respect your Fibonacci retracement. You might be right and still lose because you couldn’t hold on to the plan.
🕒 Don’t Enter Before the Market Does
Timing is underrated. Many traders get in too early. Your analysis may predict a breakout, but price isn’t ready yet.
Zoom out. A solid setup on the 1-hour chart might need confirmation from the 4-hour or daily.
A great trade is not just where you enter, but when.
😤 It’s Not the Chart — It’s Your Mind
Many times, the chart setup is perfect. But when price wobbles a bit, you lose confidence.
Imagine this: a clean uptrend, higher highs forming, but a small retracement hits and you close the trade. Why? Fear. Not logic.
You lost not because of analysis, but because you couldn’t handle being right under pressure.
📊 TradingView Tools: More Than Just Indicators
If all you're using in TradingView are the typical RSI or MACD indicators, you're barely scratching the surface.
Tools like Bar Replay can simulate real-time reactions to past price action, not just for backtesting, but for testing your discipline under real psychological pressure.
Try this: pick a point where you lost money despite solid analysis. Use Bar Replay and “re-live” the chart without knowing what happens next. Was your entry early? Did you panic exit? Or did your stop-loss placement ignore structure zones?
Also, use the Long/Short Position Tool to visually plan your risk/reward, and adjust your bias if the chart structure doesn’t validate it.
For those wanting a deeper layer, add Volume Profile Fixed Range to identify value zones, where whales are active, and overlay it with your own trade setup.
TradingView isn’t just a charting platform. It’s a behavioral mirror. You don’t just look at the chart, it shows how you act when money’s on the line.
🎯 Your Stop-Loss is for the Chart, Not Your Emotions
If your stop-loss is placed based on what feels safe rather than key market structure, you’re not trading the chart. You’re managing anxiety.
Let structure dictate where your risk lies, not your nerves.
😬 Not Executing = Not Trading
If you don’t follow through with your own trade plan, your analysis is meaningless.
Did you cut early just because a big red candle scared you? Or because someone tweeted a bearish take?
That’s not discipline, that’s reactive trading. It has nothing to do with your original logic.
📉 Losses Are Part of Trading… But Not These Ones
There’s a difference between calculated losses and emotional mistakes.
The first is expected, even professional. The second will drain your account and confidence.
Take losses when the plan fails, not when your emotions freak out.
🔍 Reverse-Engineer Your Entry Logic
Next time you trade, take a screenshot and write down your full reasoning.
Why this entry? What did you see? How will you exit?
Later, go back and compare it to what actually happened.
This habit alone can fix more issues than a dozen trading books.
💡 Perfect Analysis ≠ Profitable Trading
Analysis opens the door, but execution and consistency keep you in the room.
Most traders think the problem is their indicator, but it’s usually the part of themselves that doesn’t listen to the indicator at the critical moment.
🧠 The Power of “Logged Experience”
The real difference between amateurs and veterans isn’t screen time. It’s tracked behavior.
Use TradingView’s built-in Note feature, place icons or comments on every trade setup, and keep a record of your actual thought process.
That feedback loop is gold. It builds self-awareness, the rarest edge in trading.
📺 Make It Visual to Make It Stick
Don't rely solely on indicators.
Use Chart Pattern Drawing Tools, head and shoulders, flags, triangles, and reinforce visual memory.
Also, by managing Visibility Settings, you can keep your charts clean while viewing different structures across timeframes.
The result? You start to see the story behind price, not just numbers.
🔚 Final Thought
If you're still losing money with accurate analysis, maybe it’s time to analyze your reactions instead.
TradingView gives you the tools, but the real upgrade is learning to trust your system under stress.
✨ Need a little love!
We put so much love and time into bringing you useful content & your support truly keeps us going. don’t be shy—drop a comment below. We’d love to hear from you! 💛
Big thanks , Mad Whale 🐋
📜Please remember to do your own research before making any investment decisions. Also, don’t forget to check the disclaimer at the bottom of each post for more details.

ETH Short setupETH showing some weakness, manual SL if 4hrs candle closes above the mentioned point then must close the trade don't hold and wait for the new setup.
