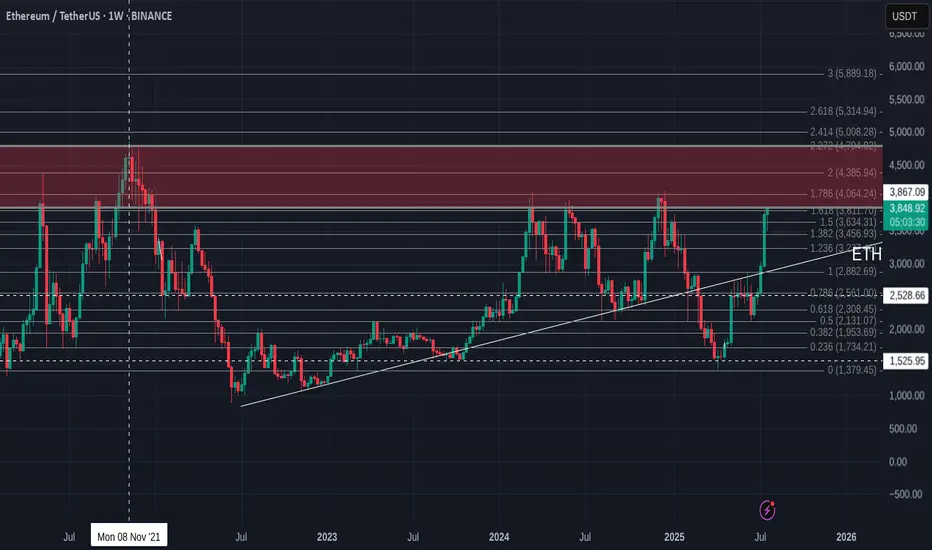
ETH (5 year of accumulation!)ETH / USDT
📌 Background: i shared an analysis about ETH/BTC chart and i predicted the ultimate bottom, from which ETH/BTC pumped 52% and ETH/USDT pumped 97% in few days !
you can check previous analysis: click here
📌 Today we have different chart against stable coin … Ethereum is being accumulated since 5 years in mega accumulation range with 2 major stop-loss hunt (long and short)
📌 What IF ?
What if ETH made a breakout throughout this accumulation ? i think we can see scenario like that in the green candles in my chart
DO YOU AGREE ?
ETHUST trade ideas

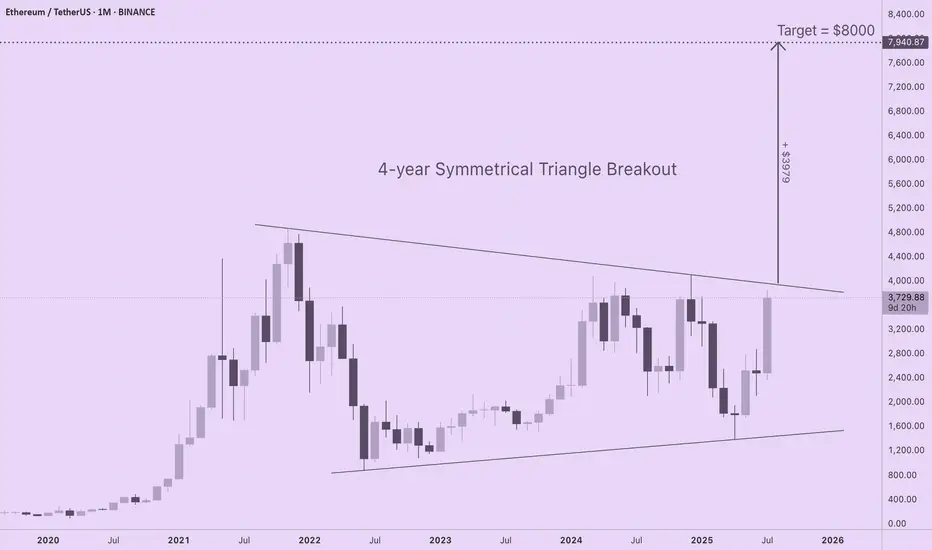
ETH Targets $8000 with 4-Year Symmetrical Triangle BreakoutIf you are seeking realistic ETH price targets based upon solid long-term market structure, check out this 4-year symmetrical triangle forming on the ETH/USD monthly chart. ETH is coiling for a major move to $8000, yet none of the CT "influencers" I follow are talking about this. I am new to technical analysis, so I am interested in learning your thoughts about this pattern and which tools or indicators you prefer for setting price discovery targets.
For those of you new to technical analysis, symmetrical triangle patterns can form on long timeframes (weeks, months, or years), indicating indecision between bulls and bears as price compresses within a continually narrowing range. A breakout from a symmetrical triangle typically follows the direction that preceded their formation, and the longer the consolidation period, the stronger the move.
The chart shows a strong euphoric phase in 2021 followed by a bear market low. Subsequent failure to reach previous ATHs is balanced by a pattern of higher lows. Since ETH was in an uptrend prior to triangle formation, odds are this is a continuation pattern, especially given profound shifts in capital flows and sentiment for the asset over the last several weeks.
With trendlines set at the price extremes, the height of the triangle is roughly $3980. If a breakout occurs at a price of $3960, ETH will target a price of $7940 (height of triangle + breakout price). A more conservative price target of $7000 is obtained by resetting the trendlines at the monthly opening and closing prices (omitting the wicks).
Regardless of the specific method for drawing the triangle, ETH is primed for a major move to the upside that has been four years in the making.
ETH to $6500?Have had this chart created for a while since before 2020, now loading it back up looks like everything is going as planned. ETH has to reach its ATH again around 4800 then it shoots to prices discovery, it will forsure run through 5000$ so $6500 becomes a target afterwards.
ETH USDTETH - needs a breakout from this Trendline and we are targeting 4k$.
Good support 3600-3650.
Always DYOR!

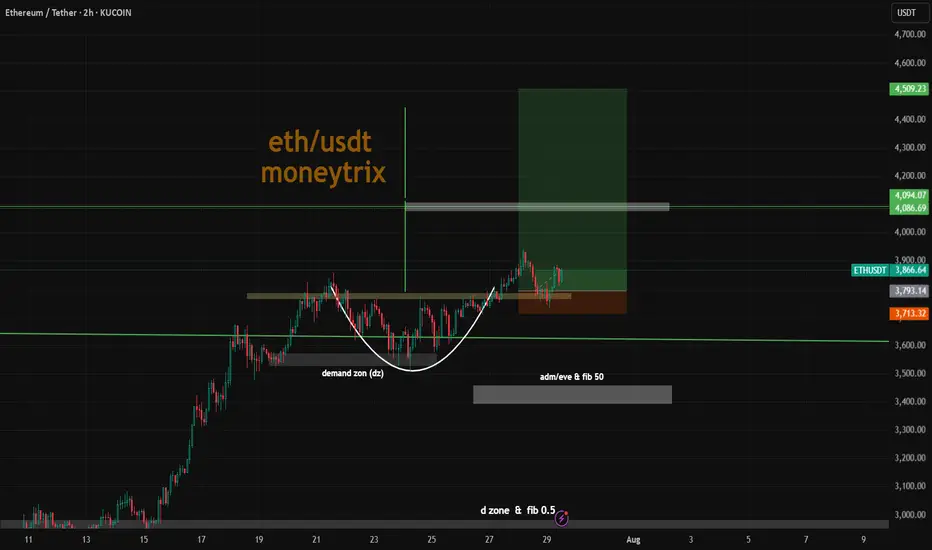
Combining a "cup and handle" pattern with a long position on ETHCombining a "cup and handle" pattern with a long position on ETH/USDT is a classic bullish technical analysis strategy. Let's break down what this pattern signifies and how to approach it for a long trade.
Understanding the Cup and Handle Pattern
The cup and handle is a bullish continuation pattern popularized by William J. O'Neil. It suggests a period of consolidation followed by a breakout to the upside, signaling a likely continuation of the prior uptrend.
Disclaimer: Technical analysis patterns like the cup and handle are tools, not guarantees. Always combine them with sound risk management and your overall trading strategy. Past performance is not indicative of future results.
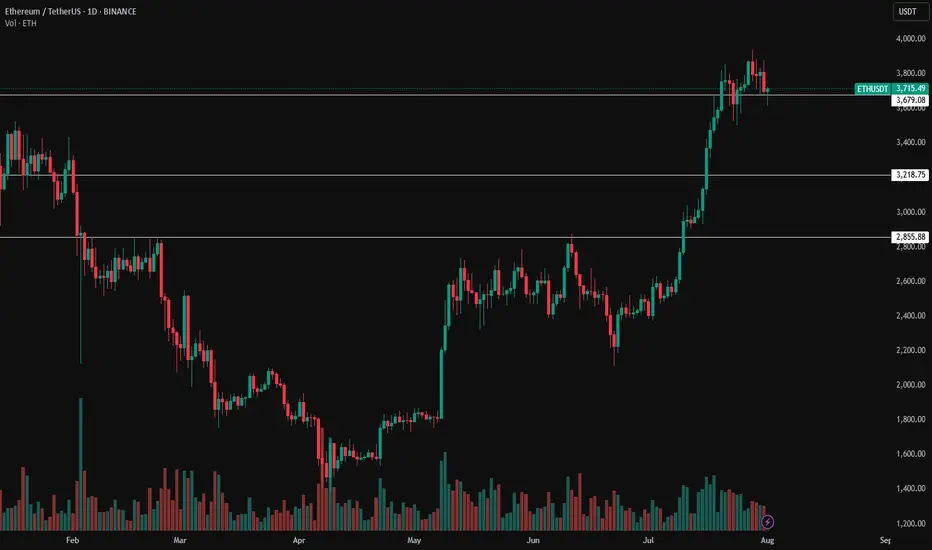
ETH Still Holding Key LevelDespite the recent pullback following the FOMC meeting, Ethereum is still trading above a key daily level that previously acted as resistance ($3,865). As long as we don't see a daily close below this zone, the market structure remains intact, and my bias stays bullish.
Support holding here could set the stage for another leg up and potentially reignite altseason, going below will cause me to shy away from the idea of an altseason in the short future.
For now, I’m watching daily close closely and staying patient
ETH 4H – Trendline Test or Trap? Golden Pocket BelowEthereum’s 4H chart shows price compressing against rising trendline support after a strong impulse move in July. While bulls have defended the key reclaim zone (white box) multiple times, momentum is fading and structure is at risk.
Price is now coiling just above the diagonal trendline — a decisive bounce here could spark continuation. However, a breakdown opens the door to deeper retracements.
Key Fib retracement levels below:
0.5 at $3,032 – Initial reaction zone
0.618 (Golden Pocket) at $2,817 – High confluence support
0.786 at $2,511 – Extreme retracement target
The Stoch RSI is deeply oversold, suggesting a bounce may be near — but confirmation is needed.
📊 Things to watch:
Reaction at trendline support
Sweep of reclaim zone followed by reclaim
Golden Pocket retest with bullish divergence
If support holds, this could be a textbook higher low. If not, expect liquidity hunts toward the fib zones. Stay nimble.
Perfect candidate for a strategy backtest or reactive plan using alerts and confirmation tools.

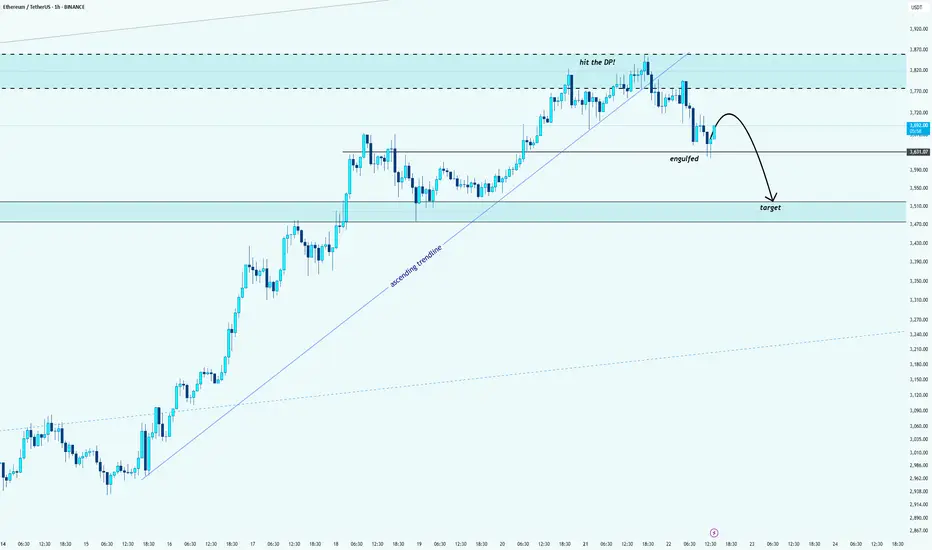
ETH/USDT: Bearish Reversal After Hitting the Decision PointHello guys!
After a strong rally, ETH finally hit the Decision Point (DP) zone marked above. Like what I said:
And we’ve already seen signs of rejection from that level.
🔹 The ascending trendline is broken
🔹 A key support got engulfed
🔹 Price is now forming a bearish structure
The target zone is mapped out around $3,500 – $3,470, where previous demand sits.
We might see a small pullback before continuation, but overall momentum is shifting downward.
Wait for confirmations and protect your capital
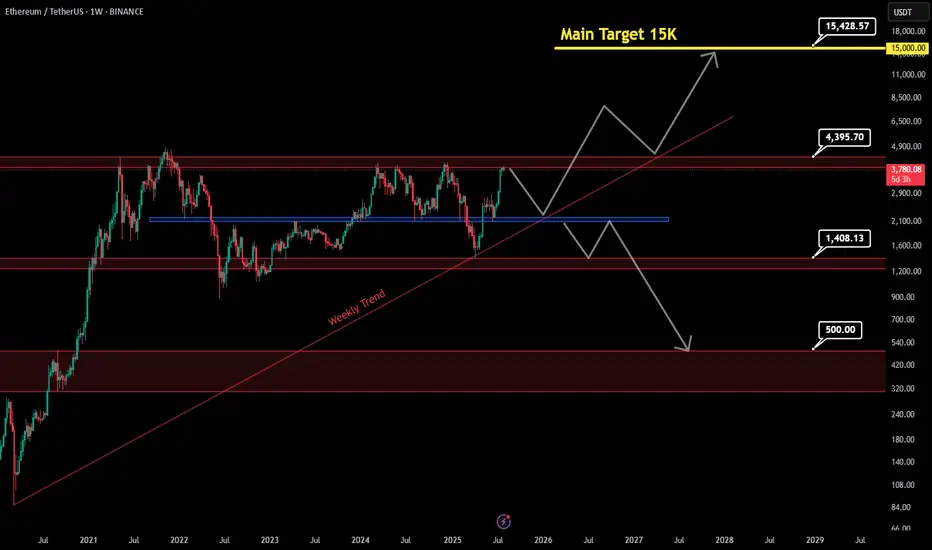
Ethereum to 15K ? or fall to 500$ !!📊 Ethereum – Long range outlook
If the price manages to break the red resistance zone above and hold above it, the path will be poised to reach the main target at $15,000, as shown by the rising arrows. If it fails, it has another opportunity to regroup buyers from the resistance at $2,228, with a very important trend that will support the upward move.
If the price fails to break the rebound from $2,227, closes this area ($2,227), and then breaks the weekly trend, we expect a sharp drop to $1,408 and even $500 in the long term.
Main Target : 15,000$
ETH-----Buy around 3850, target 3930 areaTechnical analysis of ETH contract on July 28:
Today, the large-cycle daily level closed with a small positive line yesterday, the K-line pattern continued to rise, the price was above the moving average, and the attached indicator was running in a golden cross. The general trend of rising is still very obvious. The current price has deviated from the moving average and returned to the moving average support position near the 3775 area, so you still need to pay attention to the risk trend of retracement in trading. The overall trend of the short-cycle hourly chart is in a volatile upward trend, but the price is relying on the support of the MA5 and MA10 daily moving averages to rise, and the general trend of rising is relatively obvious, so you still need to find obvious signals to enter the market during the day. The current four-hour moving average support position is near the 3850 area, and the hourly chart continues to fall.
Today's ETH short-term contract trading strategy:
Purchase at the 3850 area when retreating, stop loss at the 3820 area, and target the 3930 area;

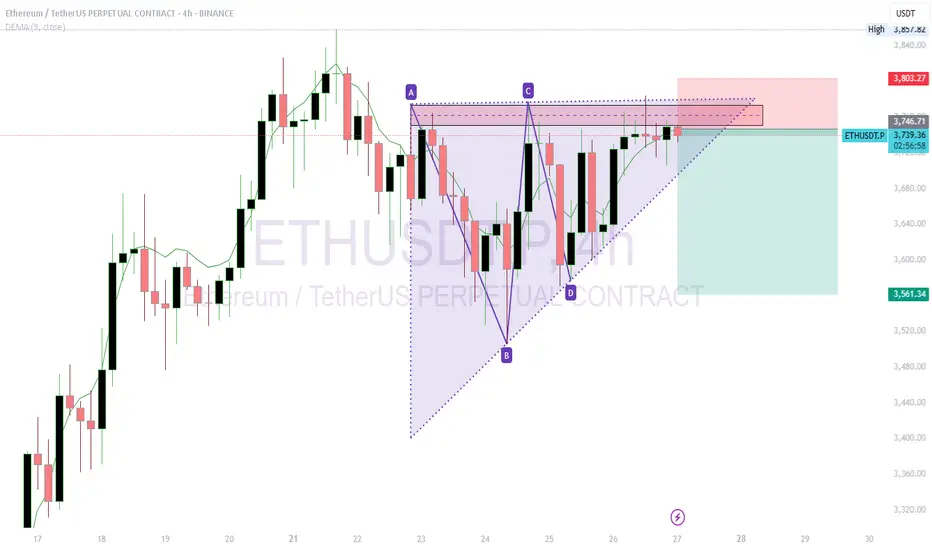
ETHUSDT Short Trade IdeaShort ETHUSDT at $3,745.22 with a target of $3,561.34.
Reason for Short: The 4-hour chart shows a symmetrical triangle pattern with resistance around $3,745-$3,800. The price is testing this upper trendline, and a recent bearish candle suggests potential rejection. The DEMA at $3,747.75 indicates overextension, supporting a pullback.
What I See: Heavy sell pressure is forming near $3,745, with the triangle nearing a breakout/breakdown point. Support lies around $3,561, aligning with prior lows.
Stop Loss: Set at $3,802, above the recent high and triangle resistance, to avoid a bullish breakout.
Trade Rationale: A breakdown from the triangle with volume confirmation could drive the price to $3,561. The tight stop above resistance minimizes risk while targeting a key support level.
Ether Update · Accumulate, Buy & Hold · 2025 StrategyGood morning my fellow Cryptocurrency trader, I hope you are having a wonderful day.
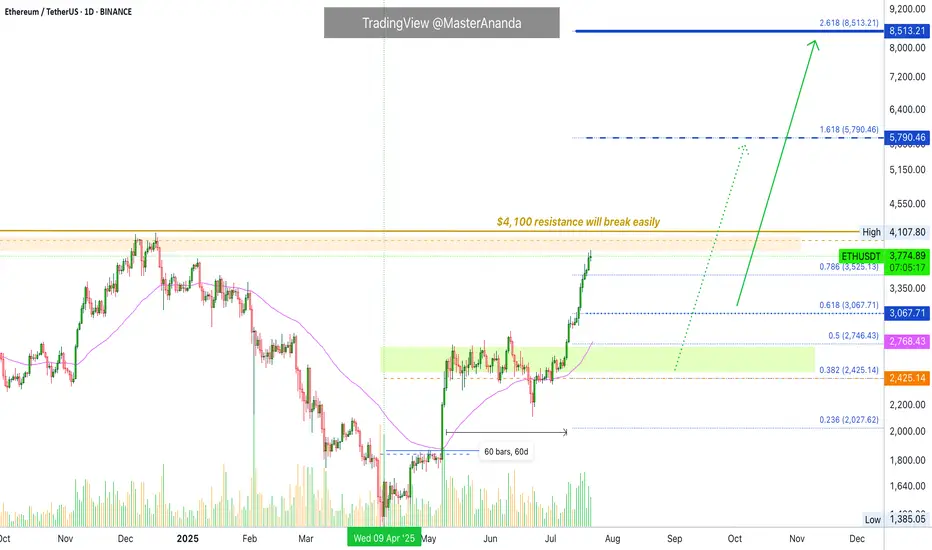
Ethereum continues really strong and today is trading at the highest price since December 2024. Right now getting close to a long-term resistance zone that was first established in March 2024. As soon as ETHUSDT manages to break $4,100 as resistance, we can expect a major advance toward a new all-time high. Remember, sustained long-term growth, just as it is happening already. Notice the slope on the rising wave since April. It will continue just like this, prices going higher and higher until a final jump produces very high prices based on a long wick.
Market conditions have not change since our last update. Everything is extremely bullish and the chart looks even better now, the rest of the market is also looking better so the focus should be on hold and preparing a profit taking strategy. How will you profit from this trade? How do you intend to sell? How will you reduce or close your position when the time is right? You can start preparing now.
There are many ways to approach the targets but it is always wise to wait at least until a new all-time high. Since we have enough data support a new all-time high as a high probability scenario, we want to benefit as much as possible from the uptrend and thus we ignore the initial easy targets. We go for the higher targets because we are now in the 2025 bull market.
When in doubt, you don't have to be 100% right but neither 100% wrong. If you don't know how the market will behave next, instead of thinking to sell the entire position, you can sell a small portion only, say 10%. And continue like this long-term.
There are many strategies, many ways to plan and win, but for now focus on holding patiently, patience is key. Those who can wait the longer without being tempted can produce the best results. Just let it roll... The market is set to grow. Accumulation and buying now the best choice.
Namaste.

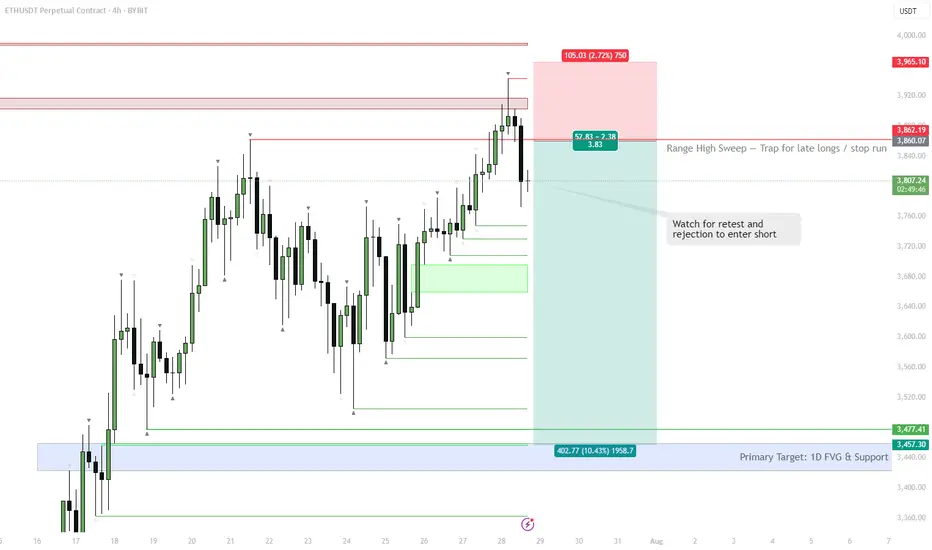
ETH | #4h #short — Range High Sweep & Short SetupScenario:
ETH swept the range high at $3,860, trapping late buyers and triggering stops. Watching for a retest of this level — if it holds as resistance and we see rejection, that’s a short trigger.
Target:
Main target is the 1D FVG at $3,457–$3,477. Possible extension: sweep of range low if selling accelerates.
Why:
Failed breakout setups are classic mean reversion triggers, especially when supported by a visible liquidity pool (FVG) below.
Plan:
Wait for a retest and rejection to confirm short. Partial TP at the FVG zone, manage risk above the sweep high.
You thinking of buying ETH ? read this first
There is a saying- "Charts NEVER lie"
And here it is
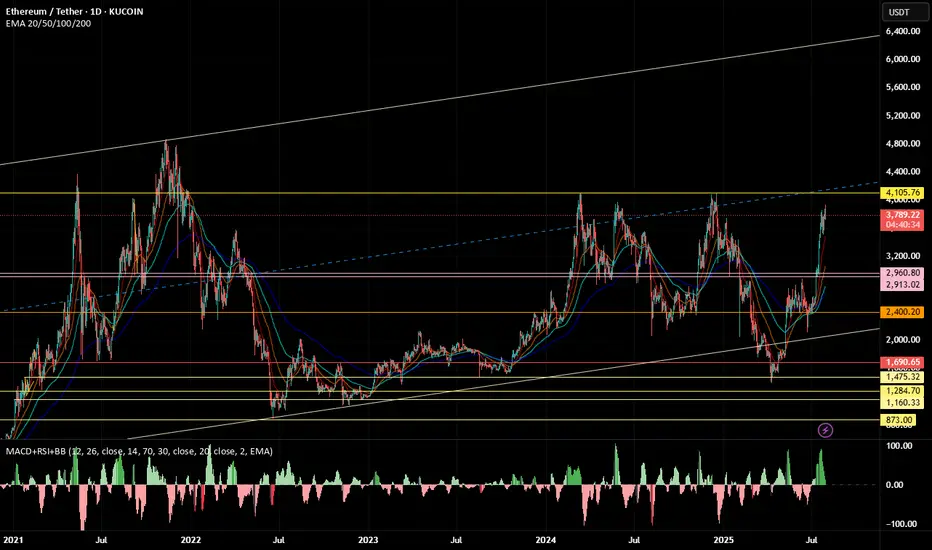
ETH USDT Weekly chart, suggesting that, right now, ETH is up against resistance that has rejected it more times than it has been support.
The RSI on this chart also suggests a pull back is coming
Again, RSI has been rejected in this range more times than it found support
Conclusion -WAIT before you buy and see if it crosses that line of resistance and tests it as support before you spend your money
Just saying
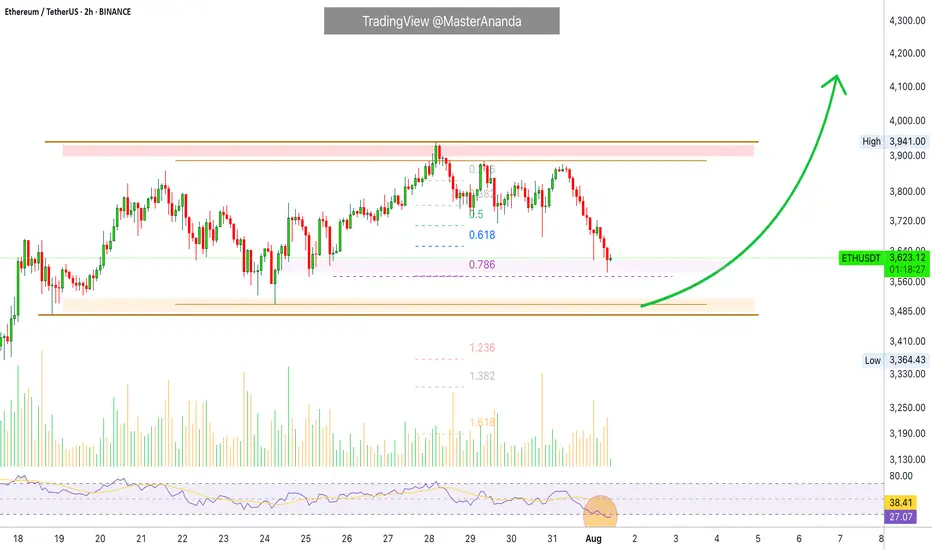
Ethereum Short-Term · Trading within Bullish RangeI am looking at Ethereum short-term using the same timeframe I used for Bitcoin, 2h. We have some interesting signals.
Here ETHUSDT is trading within higher lows. This is interesting because Bitcoin produced a lower low recently. The same volume signal is present here, ETHUSDT has been producing lower bearish volume since last month.
The RSI produced a lower low while ETHUSDT produced a higher low. This is called a hidden bullish divergence. Ethereum's bears did not only fail to take out the last low 24-July but also the previous one, and this clearly reveals bullish support.
The RSI being oversold is also a positive condition and can signal a reversal happening soon. Not truly a reversal because we are not in a downtrend, we are still witnessing a small pause after a strong rise; consolidation near resistance. A continuation reads better.
Ethereum's price continues really strong and the short-term signals are pointing to bullish action being favored in the coming days. We can wait easily and patiently because the best is yet to come. Never SHORT in a bull market, the market will surprise you with how fast things can turn. Better wait for support and go LONG.
Namaste.
ETH analysis (1H)A trendline has been broken, and a resistance zone has formed on the chart. As long as Ethereum fails to hold above the red zone, the price may experience a drop.
The green box can be considered the target.
If the price stabilizes above the red zone and a daily candle closes above the invalidation level, this analysis will be invalidated.
For risk management, please don't forget stop loss and capital management
Comment if you have any questions
Thank You

Take profit is more important than a stop lossAre you actually in profit, or just delaying your next loss?
How many times have you watched your gains vanish because you wanted more?
Maybe it's time to stop fearing losses and start planning exits.
Hello✌️
Spend 3 minutes ⏰ reading this educational material.
💸 Why Most Traders Lose Profits They Already Had
Most traders obsess over stop losses but never define where they'll take profits. Imagine entering a great trade, watching the price go up, then suddenly it pulls back and you're out with nothing. That happens because you didn’t define your win.
A well-placed take profit acts like a contract with your future self. It secures your gain before the market decides otherwise.
📉 No Take Profit? Say Hello to Unnecessary Losses
Failing to set a take profit is basically handing the market a free ticket to reverse your gains. Especially in the highly volatile crypto space, a missed exit often turns into a regretful stop out. So while everyone is talking about stop losses, you should focus on where the money is actually made.
🧮 A Clear Profit Target Creates a Clear Mind
Having a defined profit target gives your mind a place to rest. It brings structure and removes hesitation. This peace of mind is something new traders lack, which often leads them to close early or hold too long.
🧠 Greed Is the Real Enemy of Your Gains
Greed whispers "Wait, it might go higher"
But when you don't have a take profit plan, that whisper becomes your worst advisor. Pro traders map their exits before entering, while amateurs dream of riding forever.
🛡 True Capital Protection Begins with Profit Protection
If you're aiming for safe capital in crypto, it's not just about minimizing losses. It's about securing wins. Beginners often build their whole plan around stop loss. But advanced traders fear losing profits more than they fear taking a hit.
🎯 Take Profit Is Your Emergency Exit Plan
Setting a profit target is like having an escape route during a fire. Without it, you’ll panic when things turn. Crypto markets are full of pump traps. Your profit is only real when you actually take it.
🚪 Exit Strategy Matters More Than Entry
Everyone talks about entries, but it's your exit that defines whether your trade ends in green or red. Many traders nail the perfect entry but without a clear exit plan, they hand back their profits. Prioritizing your take profit is not optional. It’s essential.
🔁 Managing Gains Is Managing Emotions
Without a defined exit, every candle can shake your decision-making. But when your take profit is set in advance, emotions can’t hijack your strategy. You’re following a plan, not a feeling.
📊 TradingView Tools to Manage Take Profits Effectively
In the world of trading, the right tool means the right decision. TradingView offers powerful tools that help you manage not just your stop loss but more importantly, your take profit targets. With tools like Price Range and Long/Short Position, you can easily visualize where you entered and where you need to exit before greed pulls you deeper.
The Fibonacci Extension tool is especially valuable during bullish runs. It allows you to map out realistic and strategic profit levels like TP1, TP2, and TP3. These targets can then be paired with horizontal lines or alerts within TradingView’s chart system.
Even if you're using a free TradingView account, a simple custom Pine Script can help set alerts when your percentage targets are hit so you can scale out or lock in profits instead of emotionally reacting to price movement.
Using these tools practically empowers traders to build real-world strategies and take control of their exits, not just their entries. That’s the real edge.
📌 Final Takeaway
A clear, well-placed take profit protects both your money and your mind. Don’t let your wins dissolve into losses. With the right tools and the right mindset, you don’t just survive the market, you beat it. Start managing your profits today, not just your losses.
✨ Need a little love!
We pour love into every post your support keeps us inspired! 💛 Don’t be shy, we’d love to hear from you on comments. Big thanks , Mad Whale 🐋
📜Please make sure to do your own research before investing, and review the disclaimer provided at the end of each post.
Ethereum 6.5K Realistic taget for this cycle... HoldingFresh Ethereum Target — ETH going to break ATH and it can pump hard. However I dont think we go to 15K. It would be 1.8 Trillion Market cap. I stick to my plan which is 3.5 St. deviations. Measured by manipulaiton
🎯My system is 100% mechanical. No emotions. No trend lines. No subjective guessing. Working all timeframes. Just precision, structure, and sniper entries.
🧠 What’s CLS?
It’s the real smart money. The invisible hand behind $7T/day — banks, algos, central players.
📍Model 1:
HTF bias based on the daily and weekly candles closes,
Wait for CLS candle to be created and manipulated. Switch to correct LTF and spot CIOD. Enter and target 50% of the CLS candle.
For high probability include Dealing Ranges, Weekly Profiles and CLS Timing.
Analysis done on the Tradenation Charts
Disclosure: I am part of Trade Nation's Influencer program and receive a monthly fee for using their TradingView charts in my analysis.
Trading is like a sport. If you consistently practice you can learn it.
“Adapt what is useful. Reject whats useless and add whats is specifically yours.”
David Perk aka Dave FX Hunter
💬 Comment any Coin I ll give you my quick view

The best Buy call doesn't exists?(+160% profit on ETH)After i open long at weekly low and it almost play well until now:
\https://www.tradingview.com/chart/ETHUSDT/BrdJLvgY-ETHUSDT-near-two-major-weekly-support-and-soon-2200/
Now i am looking for range here or without that range ASAP red trendline will break to the upside and more pump and gain also is expected and this is just the beginning.
DISCLAIMER: ((trade based on your own decision))
<<press like👍 if you enjoy💚
Ethereum Update · Minor Break Below $4,000, Nothing ChangesOk. Straight up has been confirmed but as you already know, the market never moves straight down neither straight up. It seems Ethereum is about to take a small break. This shouldn't alarm you nor be a concern, we are set for sustained long-term growth. When bullish momentum dies down, the market tends to take a break, a pause, before additional growth.
Please remember that these breaks are very tricky, they can last just a few days, say 3-6 days, just as they can go for weeks. It is very hard to predict. In fact, we don't try to predict the duration of those, we simply focus on the bigger picture and know that a new all-time high will be hit in the coming months. This new all-time high will be followed by additional growth.
The short-term can be tricky though. Ethereum will continue rising, but watch out, it can make a pause and this time can be used wisely to profit beautifully from smaller altcoins. Don't let your capital just sit around when it can grow.
Ethereum is awesome but it is also a giant. The smaller altcoins is where the true opportunities lie. The opportunity to quadruple in a matter of months. And this process can be repeated several times for the duration of the bullish cycle.
Namaste.
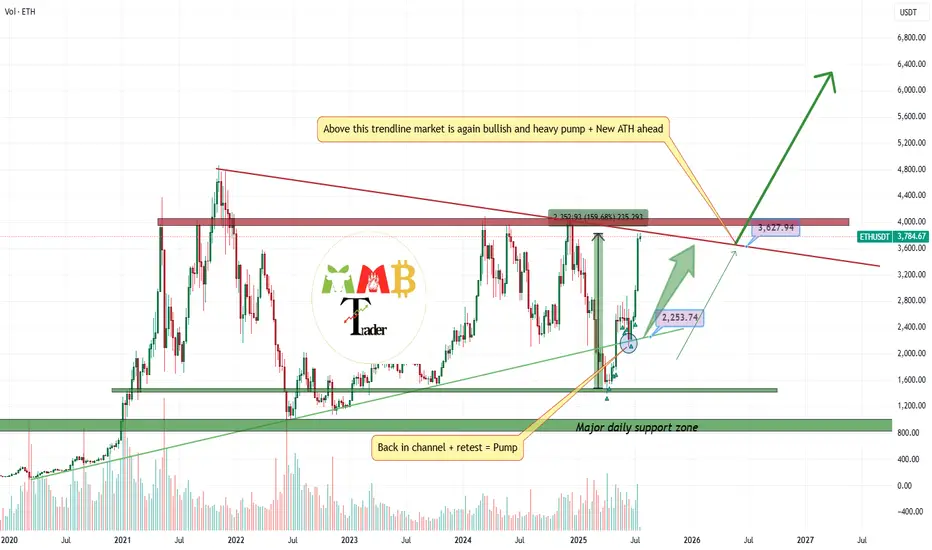
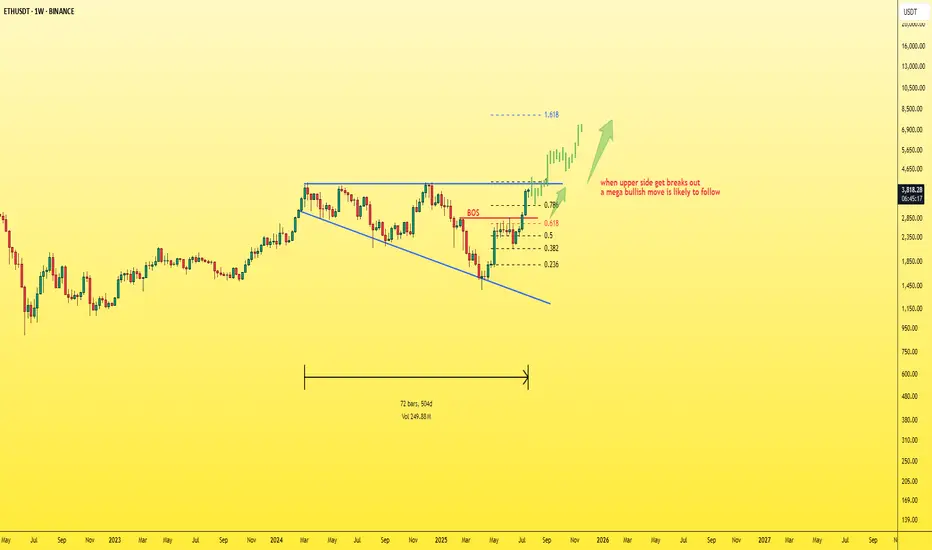
ETH - simple chart and mega moveEthereum is currently the strongest and most stable asset in the market, especially after many had lost hope in it.
Now, Ethereum is back with strength, and it’s just a few steps away from breaking out of the current pattern.
📈A breakout above the upper boundary will likely lead to a new all-time high (ATH) for ETH.
My projection: Ethereum could surpass $7,000 before the end of 2025.
Best regards:
Ceciliones🎯
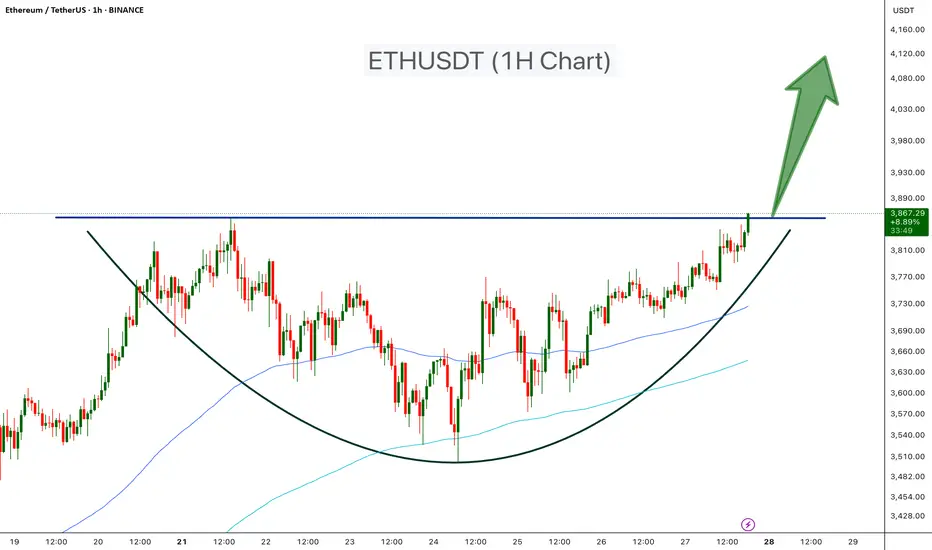
ETHUSDT Classic Cup PatternEthereum is forming a textbook Cup pattern on the 1H chart, signaling a strong bullish setup. After a rounded bottom forming the “cup,” ETH is now pushing toward the neckline resistance around $3,870. A confirmed breakout above this level could lead to a powerful upward move.
Cheers
Hexa
Smart Money Knows: ETH Is Gearing for a Supercycle...Hello Traders 🐺
In this idea, I wanna break down why $15K ETH isn't just a fantasy — it's a real, reachable target. So stay with me 'til the end, because this is just the beginning for Ethereum and the altcoin market.
If you’ve been following my ideas over the past year, you know I’ve been loudly calling for an incoming altseason — especially since ETH hit $1700. I kept saying: “Load up on ETH while you can,” because smart money was clearly rotating into it.
And now? We’re seeing the result.
Since then, Ethereum has nearly 2x’d, and ETH ETFs are pulling in massive inflows — but the price hasn’t exploded yet. Why? Let’s look closer.
Over the past 90 days, ETH has rallied around +180%, but in a quiet, steady climb — which is actually bullish. A strong move with low hype = accumulation. That’s how smart money moves.
📊 Monthly Chart Breakdown:
ETH is moving inside a perfect ascending channel, with clean touches on both support and resistance. Right now, price is forming a bullish flag pattern at the upper range — a classic continuation structure.
Volume has dropped during this flag, which is a textbook sign of accumulation. Add to that: RSI is sloping downward, signaling that large players are shaking out weak hands while loading up quietly.
So yes — ETH has already done +180% during this consolidation phase, which tells us something big is brewing.
🔁 The current pullback on the daily? In my opinion, it’s just a technical reaction to the flag resistance. RSI is also trying to break above its own trendline. If both confirm, the next wave begins.
🎯 Targets?
First target: All-Time High around $4870.
After that? There's nothing but air until we hit the top of the monthly channel near $15,000.
That breakout above ATH is where the real FOMO begins — not just for ETH, but for the entire altcoin market.
Let’s not miss what’s coming.
And as always, remember our golden rule:
🐺 Discipline is rarely enjoyable, but almost always profitable. 🐺
🐺 KIU_COIN 🐺
