ETH Retracement 50% FibHi there, I think there will be a retrace at ETH to 50% fib. My new buy zone will be 2300 and I am short at the moment to 2300. Hope this helps you out. Do your research and this is no financial advice, just an idea. Oh and by the way, I got my SL just above the current high (~2490).
Let me know what your thoughts are in the comment below!
ETHUST trade ideas

ETH/USDT | ICT Price Delivery Model: AMD📍 ETH/USDT – Daily Timeframe | ICT Smart Money Framework
This analysis outlines a clean execution of the ICT Price Delivery Model:
🔹 Accumulation Phase:
Price consolidates in a defined range, building liquidity above and below the zone.
🔹 Manipulation Phase:
Liquidity sweep to the downside taps into the Balanced Price Range (BPR) — engineered to trap late sellers.
🔹 Repricing Phase:
Price reacts sharply from the Daily Fair Value Gap (D FVG), confirming bullish intent.
🔹 Distribution Objective:
Smart Money likely targeting external liquidity resting above the $3,400 level.
Key ICT Concepts Applied:
✔ Break of Structure (BOS)
✔ Market Structure Shift (MSS)
✔ Fair Value Gap (FVG)
✔ Balanced Price Range (BPR)
✔ External Liquidity ($$$)
📈 Directional Bias: Bullish
🎯 Primary Target: $3,400 (Distribution Zone)
🕒 Chart Type: Daily (1D)
📉 Invalidation: Break and close below BPR without mitigation
📊 Shared by SeenForex – Precision Analysis through ICT Methodology

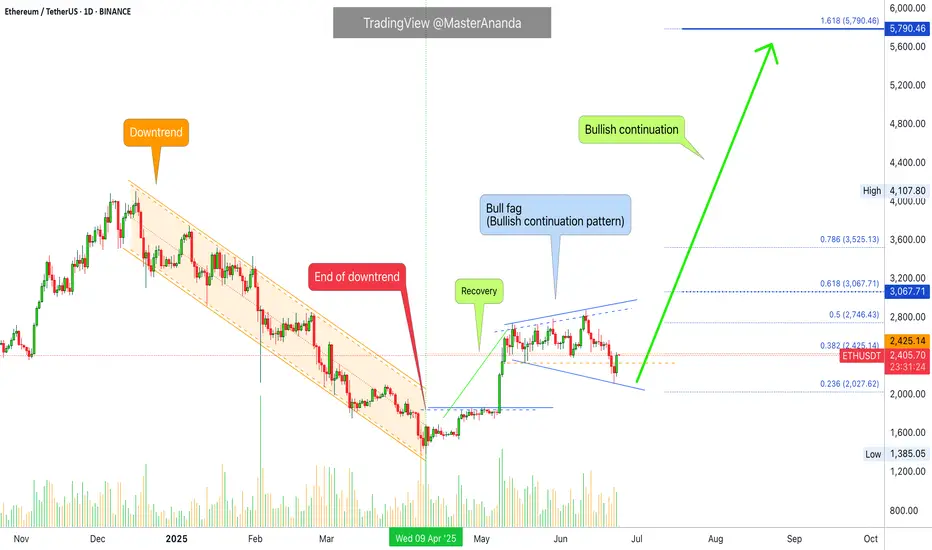
ETH/USDT Bullish Reversal Analysis Chart Overview:
Ethereum (ETH) has shown a strong bullish reversal from the support zone near $2,200, forming a V-shaped recovery pattern. The price is currently trading around $2,450, with upward momentum targeting the next key resistance level.
📌 Key Technical Highlights:
✅ Support Zone:
Clearly respected at $2,200 – $2,300 range
Multiple candle wicks suggest strong buyer interest
✅ Resistance Zone:
Major resistance expected around $2,900
Historical rejection indicates potential selling pressure
✅ Target Level:
Short-term target marked at $2,610 🟣
If momentum sustains, price could push towards this zone before facing resistance
📈 Bullish Momentum:
Strong breakout from downtrend channel
Formation of higher highs and higher lows
Price action respecting upward trend structure
🛠 Pattern Structure:
Reversal pattern after corrective phase
Bullish engulfing candles suggest continuation
📊 Forecast Path:
Two potential scenarios are outlined:
📈 A clean push to the $2,610 target, followed by consolidation
🔄 A short pullback to $2,374 before continuation to the target
⚠️ Conclusion:
ETH/USDT is showing bullish signs with potential to reach $2,610. Watch for consolidation or pullbacks as buying opportunities, but be cautious of heavy resistance above $2,900. Ideal for short- to mid-term bullish setups

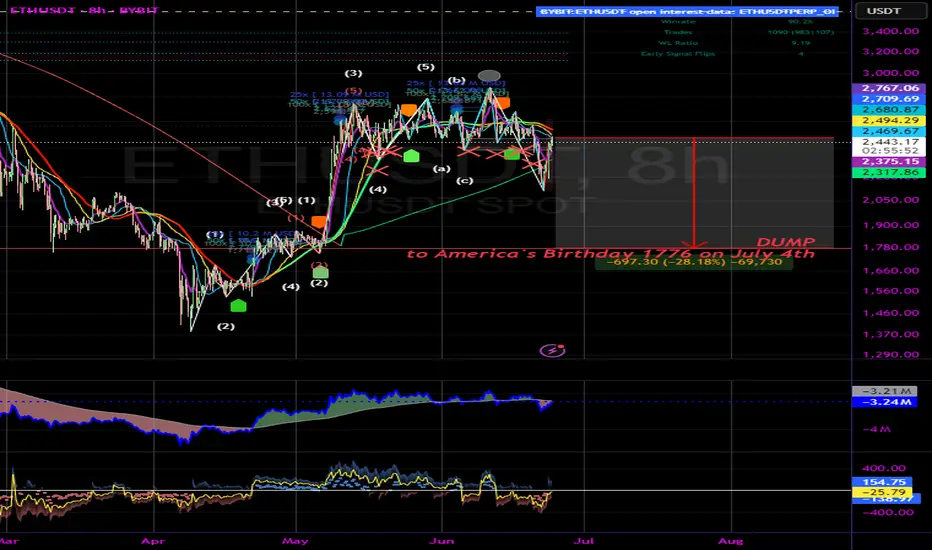
ETH Dumping to 1776 in honor of America's birthdayBART express incoming. Nice liquidity grab down there as well.
Not financial advice.
Happy July 4th!
ETH - SHORT SET-UPBINANCE:ETHUSDT
Short Setup Summary (ETH/USDT Weekly):
Resistance Zone: $2,590–$2,720
View: Expect rejection from this zone
Target: $2,150
Stop-loss: Above $2,914
Setup Type: Supply zone rejection (bearish setup)
Confirmation: Watch for reversal candles in the zone

Will ETH be able to return to the key level of $2,500?⚡️ Hello, everyone!
Over the weekend, Bitcoin and the entire market fell sharply due to geopolitical instability. ETH reached $2,120! And now it is trading at $2,440. However, as long as the price remains below the psychological level of $2,500, this is definitely a bearish signal.
❓ And the main question arises: will ETH be able to return to the $2,500 level and above, continuing its growth? Let's figure it out:
As I said in my previous review, ETH began to close the GAP from below at the levels of $2,470 - $1,855. However, there is also a GAP from above at the levels of $2,807 - $3,260. And after closing the current one, the next target will be this one. After all, as we know, 99% of GAPs close sooner or later.
📊 The price is in a flag pattern, and the first squeeze of the sloping support of the figure led to a price increase from $1,390 to $2,880 at its peak. However, the next test is unlikely to go so low, and therefore will not have the same effect. Therefore, the ETH price will likely continue to squeeze until it breaks one of the slopes, setting the direction.
⚙️ Metrics and indicators:
Money Flow - fresh liquidity has been flowing into ETH for almost a year now! Even despite the correction, the inflow has only been increasing since August 2024.
Liquidity Depth - as we know, the price moves from one liquidity zone to another. And now, there is significantly more liquidity concentrated at the top than at the bottom. This means that it is much easier to move the price up.
📌 Conclusion:
I'm not trying to say that ETH will skyrocket right now. But it's definitely not where it should be. And when it goes up, it will go up a lot, and we need to be ready for that.
I don't think we'll see levels of $1,500 and below again. But $1,800 at the end of summer or beginning of fall is quite realistic.
So be patient, we'll definitely get our chance!

Weekly trading plan for Ethereum BINANCE:ETHUSDT After the weekend, the price showed a solid recovery and is now attempting to break above the recent low at $2,436. If the breakout succeeds, we could see a move toward the marked resistance levels. Alternatively, we might get a local pullback before further upside. However, if the Pivot Point is broken to the downside, there’s a chance we’ll see a continuation of the bearish move
Write a comment with your coins & hit the like button and I will make an analysis for you
The author's opinion may differ from yours,
Consider your risks.
Wish you successful trades ! mura

ETH: Short 23/06/25Trade Direction:
ETH Short
Risk Management:
- 0.5% risk allocation
Reason for Entry:
- Tagged and rejected from Daily FVG
- Market sentiment remains bearish across macro and crypto
- News flow is strongly risk-off. Qatar has closed flights, UK and US citizens issued shelter in place warnings aswell
- Heightened geopolitical risk from possible Iranian escalation, with largest US base in the region
- 0.718 rejection

ETH/USDTI think it's time for Ethereum to grow and we should wait for higher targets from Ethereum. Tell me what you think.

ETH update 9.06.2025Hello everyone, many of you asked me to publish my vision for ETH.
Here you go!
I believe that the previous impulse movement was only the first upward movement, and now we are in a sideways correction movement — call it what you will, but the fact is that the exit from this flat will be upward.
1. End of the year
2. ETH is accumulating on the Onchain
3. Liquidity overflow from BTC can be seen on the ETHBTC chart, and the overflow began at the very bottom
4. What else can large conservative players accumulate?
5. We are going after liquidity from above and should break 4100 by September
Best Regards EXCAVO

Ethereum (ETH): Attentions at 200EMA | Targeting Local HighEthereum is back near EMAs after a nasty drop we had recently due to news we had. Now it is basically the waiting game, where we just wait for confirmations of either a breakout from here or a rejection and movement back to lower zones.
We are looking more for the breakout scenario just based on the buyside volume we had recently, which showed the dominance of buyers!
Swallow Academy

Long trade
🟢 Trade Journal Entry – Buyside Trade
📍 Pair: ETHUSDT
📅 Date: Monday, June 23, 2025
🕒 Time: 8:00 AM (NY Session AM)
⏱ Time Frame: (Assumed 4Hr TF)
📈 Direction: Buyside
📊 Trade Breakdown:
Metric Value
Entry Price 2422.81
Profit Level 2474.60 (+2.14%)
Stop Loss 2415.04 (−4.08%)
Risk-Reward
Ratio 2.91 : 1
🧠 Context / Trade Notes:
NY Session AM Execution:
Trade entered at the start of the New York session, aiming to capture directional momentum amid strong ETH volatility.
Liquidity Sweep Confirmation:
Clear stop-hunt below prior swing low sets up the reversal conditions

False Breakdown on ETH – Bulls Back in Control?CRYPTOCAP:ETH just pulled a classic fakeout move — breaking below a key support and rising trendline, only to snap right back above it.
This false breakdown caught the bears off guard, and now price has reclaimed the support zone with strength.
As long as ETH holds above this reclaimed level, we could see a short-term push higher. Watch for follow-through, bulls need to keep the momentum alive.

ETH - When $3,000??The one who frontrun ETH at the bottom are the real boss, looks good from 2460 for longs, and slit for buys at the range if something outlasts

ETHEREUM → Rally and liquidity capture. Up or down?BINANCE:ETHUSDT.P is strengthening following Bitcoin. This is a reaction to developments in the Middle East, namely Trump's comments on peace. But there are doubts...
The crypto market is reacting to the situation in the Middle East, namely Trump's statements about peace. But apart from him, no one else is talking about peace. No agreements have been reached, so the level of risk is quite high.
Another nuance hinting at the general mood in the market: 66% of the largest traders on Hyperliquid are currently shorting crypto — Cointelegraph
ETH, technically, has stopped in the trend resistance zone as part of a local rally in the Pacific session.
If there is not enough potential to break through the trend resistance and the price forms a false breakout of 2390, the local trend may continue
Resistance levels: 2433, 2475
Support levels: 2390, 2313
The inability to continue growth will confirm the fact of bearish pressure (market distrust of the bullish momentum). The past momentum, in hindsight, can be considered manipulation (liquidity capture). Consolidation below 2390 may trigger a decline.
Best regards, R. Linda!

ETHUSDT Weekly: $2550 - The Bullish Pivot Point• Current Price Consolidation and Immediate Range : The ETHUSDT price is currently consolidating within a critical immediate range, bounded by the 2000−2200 weekly support below and the 2900−3000 overhead resistance area. This 2000−3000 zone defines the current primary trading boundaries on the weekly timeframe.
• Key Bullish Catalyst at $2550 : For the bullish sentiment to gain significant momentum and indicate a potential continuation of the recent upward movement, a decisive weekly close above the $2550 level is paramount. This price point acts as an immediate pivot; successfully clearing and holding above it would suggest a re-energized buying interest targeting the upper bound of the current range.
• Significance of the "Deciding Area" : The 2900−3000 region, labeled as a "Deciding Area," represents a crucial resistance confluence. This zone previously served as significant support and the long-term green ascending trendline, which was subsequently broken. A successful retest and breakout above this area would indicate a potential shift in market structure from bearish to bullish, opening the path towards the higher Key Resistance at 3900−4000.
• Critical Support and Downside Risk : Maintaining the 2000−2200 weekly support is essential for bulls. A sustained weekly closure below this level would invalidate the current bullish outlook and likely lead to a retest of the strong demand zone around 1400−1500, signaling a deeper retracement or a renewed bearish trend.
Disclaimer:
The information provided in this chart is for educational and informational purposes only and should not be considered as investment advice. Trading and investing involve substantial risk and are not suitable for every investor. You should carefully consider your financial situation and consult with a financial advisor before making any investment decisions. The creator of this chart does not guarantee any specific outcome or profit and is not responsible for any losses incurred as a result of using this information. Past performance is not indicative of future results. Use this information at your own risk. This chart has been created for my own improvement in Trading and Investment Analysis. Please do your own analysis before any investments.

Ethereum vs Small Cap. & The 2025-26 Cryptocurrency Bull MarketThe last three days ended up being a very nice flush, a strong one but the action quickly recovered above the 18-May low.
Ethereum was trading above $2,300 since mid-May and always stayed above this level. It broke suddenly below, out of nowhere, but the action is bullish again. We can say that this was a stop-loss hunt event, a bear-trap and nothing more or else we would see a continuation of the bearish action rather than a strong inverse reaction, a bullish jump.
It is not only Ethereum of course that is experiencing this type of bullish action, some altcoins are going nuts. Really crazy right now producing so much momentum that people are still wondering if the market is going down... Or is it going up?
It is obviously up, just look at the 7-April low.
Ethereum hit a low of $1,385 on 7-April. The higher low yesterday ended at $2,111.
You see what I mean?
The market is ultra-bullish because the last low is so far away. It is impossible that it will be tested even less possible for it to break. Ok, so a market shakeout we agree but now that the shakeout is complete what is supposed to happen next?
Watch the smaller altcoins.
Thank you for reading.
Namaste.
ETH Long TradeLooks bullish here for continuation
Futures are higher on holiday
Order flow neutral to bullish

ETHEREUM accumulated and ready to goOn a very negative news price is drop to POI of the dealer and well accumulated. We believe that next bullish move about to happen

ETHEREUM $1800 IMMINENT – Accumulation nearing completionTraders,
Ethereum is currently forming a textbook example of multi-timeframe accumulation. We’re observing two overlapping accumulation ranges — one on the macro and one on the intraday structure.
In both cases, price has formed two significant lows. A third sweep toward the $1800 zone would complete the pattern and align with the principle of engineered liquidity traps before expansion.
This $1800 level isn't random — it’s where:
- Prior stop runs occurred
- Buyer interest is likely to step in again
- The lower boundary of the range aligns with previous demand
If this level holds, the next logical target sits at $2258, where external liquidity rests above recent highs. The path of least resistance is up once that low is set.
This setup offers high R/R for positional longs, especially if confirmed with absorption or bullish delta response at the $1800 level.
Don’t rush in — but be prepared.
The reaction around $1800 will tell the story.

ETHAs seen on the ETH chart, after breaking the upward trend, it performs a retest on the downward trend and creates the second peak of the downtrend by taking liquidity. All the moving averages (7, 25, 50, 100, 200) have converged, reinforcing and supporting the trend.
We have 3 scenarios here:
Wait for a break of the downtrend and enter a trade with a reversal candle.
Wait for the moving averages to act as support.
Wait for support from the block order zone around the 500 level — this is the worst-case scenario.
If the first two scenarios happen together, it could push us significantly higher.
At this point, only short positions are advisable — but they must be adjusted according to risk.
Everything written here is based on the weekly chart. It is possible to trade on lower timeframes, but don’t forget — the overall trend is still down.

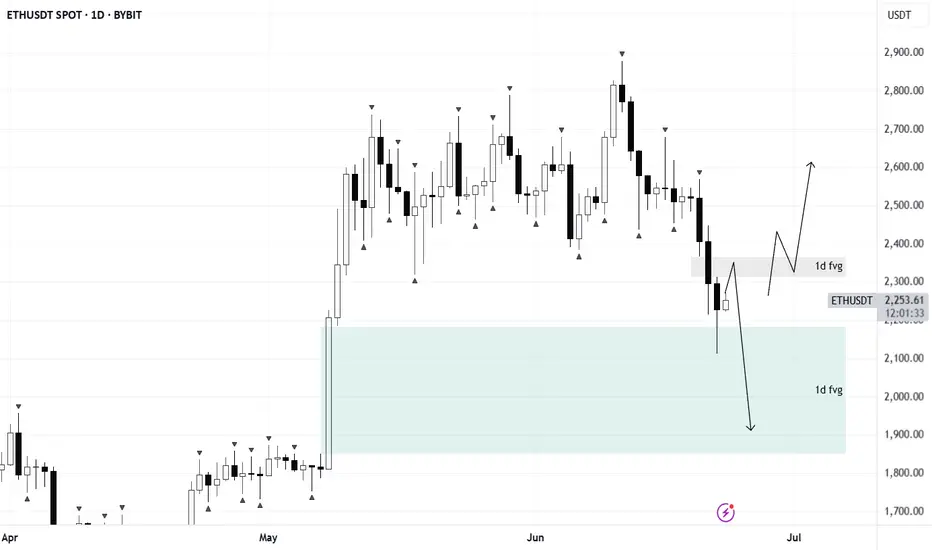
ETH/USDTPrice has entered a daily long FVG zone. For long setups to be valid, we’d like to see a short FVG inversion play out.
If no bullish reaction follows, the bias shifts to shorts — with potential downside targets in the $2000–$1800 range. Wait for confirmation before taking action.
ETH Forming Bullish AB=CD Pattern | Eyes on Breakout #Ethereum (ETH) is showing strong bullish momentum on the 4H timeframe and is currently developing a classic AB=CD harmonic pattern, which often precedes a continuation of trend.
✅ Key Observations:
#ETH is holding within a solid uptrend structure
No signs of bearish divergence or reversal patterns yet
Momentum remains healthy, with buyers in control
🔍 What to Watch For:
We are closely watching the previous Higher High (HH) — currently acting as a key resistance level. A 4H candle close above this level will serve as confirmation for the continuation of the bullish trend.
📈 Trading Plan:
Once #ETH breaks above the resistance and confirms with a close, we’ll look to enter a long position with proper risk management and stop-loss placement below recent structure.
💬 What’s your bias on #ETH in the short term? Are you already long, or waiting for the breakout too?
📌 Don’t forget to Like, Comment, and Follow for more clean setups and strategy-based analysis!
#ETH #Ethereum #CryptoTrading #ABCDPattern #TechnicalAnalysis #Harmonics #TradingSetup #Breakout #PriceAction
