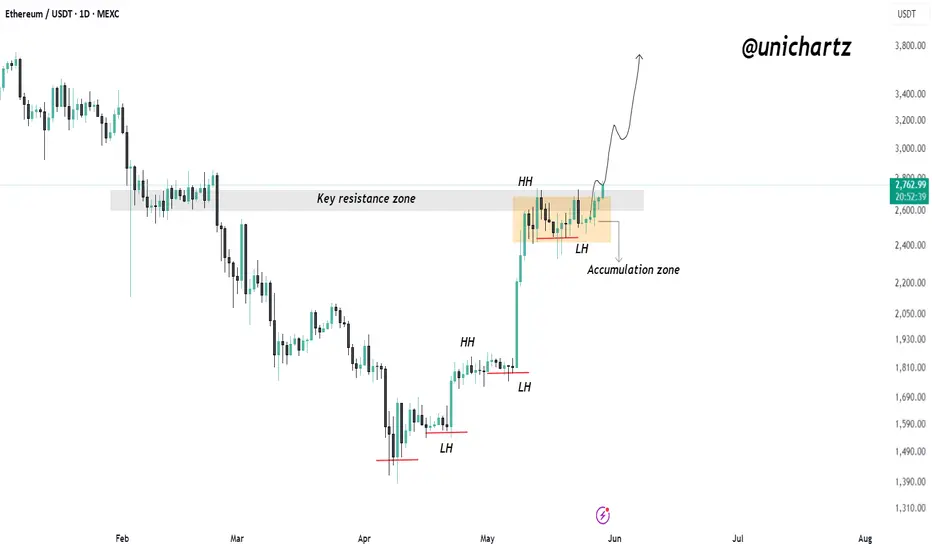
ETHUSDT Bullish Structure Intact: Higher Highs Continue#ETHUSDT – 1D Chart
Ethereum is in a strong uptrend, consistently forming higher highs (HH) and higher lows (LH).
Price recently broke above a key resistance zone after consolidating in an accumulation range. This breakout confirms bullish strength.
If ETH holds above this zone, we could see a continuation move to the upside in the coming days.
Structure remains bullish — trend is intact.
ETHUST trade ideas
Ethereum Ethereum has rebounded significantly and needs a short respite. We are currently trading at a strong resistance level and experiencing strong selling pressure at the 2700 area. The correction will end at 2435/2335.

Ethereum 8X Leveraged Trade OpportunityIf you want to make it big really fast, there is still one last chance to get ETHUSDT with a great entry price and high lev.
The chart setup is good. The market is good and everything is great.
Market conditions are only improving and the Altcoins are starting to heat up.
Right now, you see $1,600 but tomorrow the price can be $1,800 or more, that's how the Altcoins work. One day everything is quiet, the next day everything blows up. By the time the action is in, it is too late to buy, but not now, there is still one final chance to get bottom prices before the 2025 bull market shows up in full force.
Here is Ethereum, ETHUSDT, a great chart setup. Once the breakout happens, it will never trade at this price ever again. This is the last chance. It is yours to take.
Thanks a lot for your continued support.
I am wishing you profits, health, wealth and success.
You are appreciated, always, and you deserve the best.
Namaste.

Ethereum 6X Lev. Full PREMIUM Trade-Numbers —2nd Entry—PP: 1806%This is a second entry for a long-term leveraged chart setup for ETHUSDT (Ether).
This is truly the last chance to get Ethereum at low prices before a major bullish impulse, the biggest one in a long time.
The chart structure is perfect. The low conditions look very similar to June 2022, very similar.
We have long-term higher lows blah blah blah... By now, you already know all these things as I read this chart a million times.
I don't have much to say other than remain calm, whatever happens. Sleep easy because Crypto is going up. It is as simple as that. It will grow, soon.
Full trade-numbers below:
_____
LONG ETHUSDT
Leverage: 6X
Entry levels:
1) $1,900
2) $1,825
3) $1,630
Targets:
1) $2,125
2) $2,405
3) $3,347
4) $4,017
5) $4,871
6) $6,000
7) $7,337
Stop-loss:
Close weekly below $1,600
Potential profits: 1806%
Capital allocation: 3%
_____
I would like to thank you again for reading. Your support is appreciated.
I know it is a lot of content but this is meant for many different people all across the world.
If you like what you see make sure to follow.
If you want to see more, leave a comment and boost to show your support.
This is the big one.
Namaste.

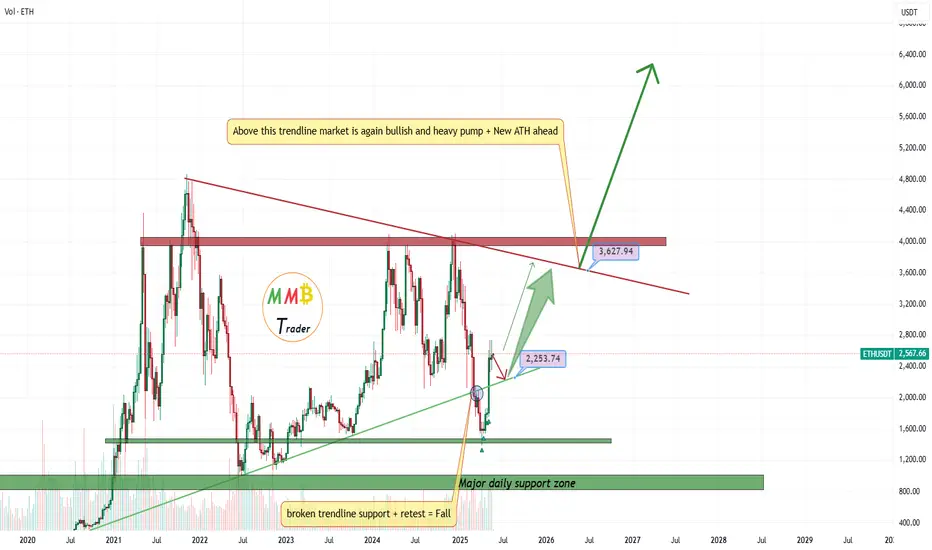
Ethereum 6X Lev. Full PREMIUM Trade-Numbers (PP: 3,198%)Ether (Ethereum's token) just set a long-term higher low. The main low happened in June 2022 and the higher low now, April 2025.
Ok, let's make a pause. Before going into the chart details and technicals, let me say that this is a high probability trade setup. If you've been following for a year or more, you know what this means. This is a win.
Ethereum is set to grow and this growth will happen based on the long-term.
The numbers below can produce a huge reward with relatively low risk.
This is for advanced traders only. You need to be able to adapt to market conditions and have some experience before your decide to trade. If you are certain and you are a responsible adult; Welcome, I am wishing you tons of success.
The market gives and the market takes.
The market is set up now to give and it will give us big, big wins. These wins are here for you, if you have what it takes.
Full trade-numbers below:
____
LONG ETHUSDT
Leverage: 6X
Entry levels:
1) $1,650
2) $1,500
3) $1,450
Targets:
1) $2,125
2) $2,405
3) $3,347
4) $4,017
5) $4,871
6) $6,000
7) $7,337
8) $8,861
9) $9,947
Stop-loss:
Close monthly below $1,380
Potential profits: 3198%
Capital allocation: 5%
____
Thanks for reading and for your continued support.
I am wishing you health, wealth, success and love.
Thanks for the follow.
Thanks for the comments.
Thanks for all these years of sharing, discussions and personal growth.
Let's continue together long-term.
We are only getting started.
Namaste.

eth/usdtHello, this is my daily analysis for Ethereum and I think we are in the best place on the chart and we can have an upward trend. What do you think, friend?

ETHUSDT still sleep but soon will break the NewsETHUSDT this time will touch new ATH with Bitcoin pump not like previous time sleep price is still weak but first resistance is broken and soon will pump above 3000$ and the journey will start there and huge pump will lead ASAP.
DISCLAIMER: ((trade based on your own decision))
<<press like👍 if you enjoy💚
ETHEREUM - ETH - Crypto - Buy IdeaETH forms an ascending triangle near a key resistance zone, indicating potential bullish continuation. A breakout above this range could trigger a rally towards the next major resistance at $3380. The RSI is holding above 65, showing strong bullish momentum. A breakout from the triangle with strong volume may confirm the bullish setup.

short ETHETH bounced off the resistance level. Bearish movement to support level at $2356 is expetced to happen

ETHUSDTEth on weekly chart.
i saw more selling coming than buying, though we are expecting alt coin to go bulish, but if eth failed to go bulish we shldnt exxpect any other coin to be bulish as well. the altcoin season is likely to happen may coming year

ETHusdtas we are expecting alt season, i always make use of eth as number one alt as case study, in which i dont see any clear sign that we are going to enter alt season any moment from now. this is weekly chart, i want to see price reaction around that zone . but i have sell bias instead of buy bias for now

Ethereum (ETH): Buyers Going For Second AttemptBuyers failed to form a proper breakout the first time on Ethereum, while currently we are seeing another buyside volume accumulation happening.
While we have a smaller long position open on ETH, we would suggest waiting for a proper breakout before going long here, as once we see a breakout, we might be seeing very good upward movement toward $3000.
Swallow Academy

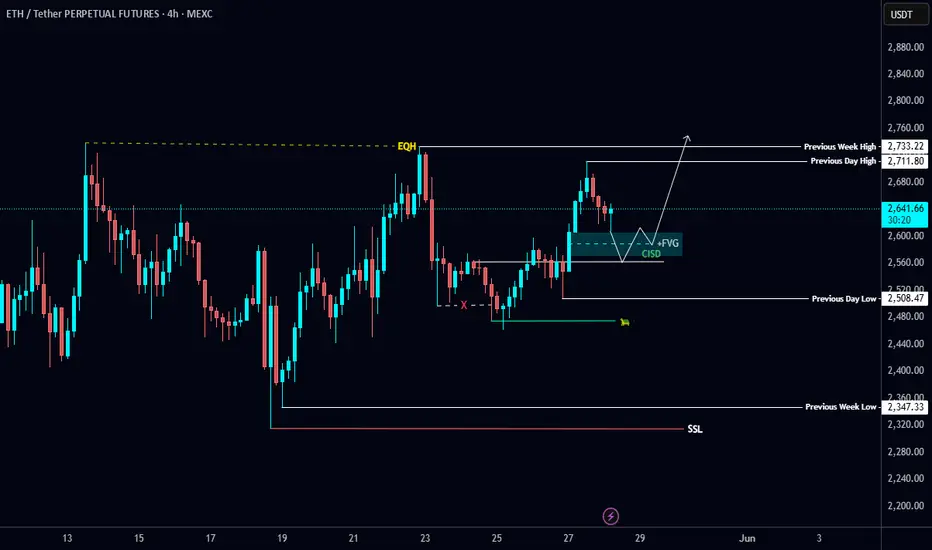
$ETH Long Setup Loading📈 CRYPTOCAP:ETH Long Setup Loading 📈
#ETH swept liquidity and printed a CISD just below the 4H FVG 🎯
That level lines up with a POC + demand zone — prime spot to hunt a new long 🔍
Let it come to you, plan the entry 💼
$ETH Pressing Resistance – A Break Above Could Fly!CRYPTOCAP:ETH Update
Ethereum is looking strong right now.
The price is pushing against a key resistance zone near $2,725 and forming higher lows showing pressure is building for a breakout.
If it breaks above this zone clearly, ETH could rally toward $4,000 (that’s a 55% upside).
Support to watch on the downside is around $2,465 if price pulls back.
Keep an eye on ETH, this breakout could be big.
DYOR, NFA
#ETH #Ethereum

Next days eth?I think we are still in the compresion, Eth is nog waiting on btc but is making is own path
ETH/USDT – Structural Pattern Near Completion (4H)The current 4H chart of Ethereum is unfolding a 7-legged sideways corrective structure, with signs suggesting we are now in or entering the final leg of the pattern.
🔸 Wave Progression (Post-X Correction):
A → Initial push upward
B → Sharp pullback
C → Extended leg with strong momentum
D → Symmetrical pullback, 80% of B
E → Sharp upside move
F → Pulled back to D-level support
G → Potential final leg now developing
📌 Pattern Characteristics:
7-wave alternation forming within contracting boundaries
Price symmetry observed in B = F and A ≈ C ≈ E
Visual structure remains neutral and balanced
Each leg alternating in direction and behavior
📈 Expectations:
G is likely to be an upward wave, completing the structure
Target range for G: 2,660–2,700, possibly testing or briefly exceeding E
After G completes, a reversal or acceleration move is likely
🧭 What to Watch:
Reaction near upper boundary around 2,700
Any sharp rejection from that zone confirms the pattern is complete
Break of the D–F trendline post-G confirms structure termination
📊 Timeframe: 4H
Asset: ETH/USDT
Structure: Complex 7-leg correction
Outlook: Bullish short-term → Cautious after G
💬 Drop your thoughts below. Are we completing the final leg or mid-structure?
📍 Like and follow for more professional pattern analysis.
BINANCE:ETHUSDT BITSTAMP:ETHUSD BINANCE:ETHUSDT.P

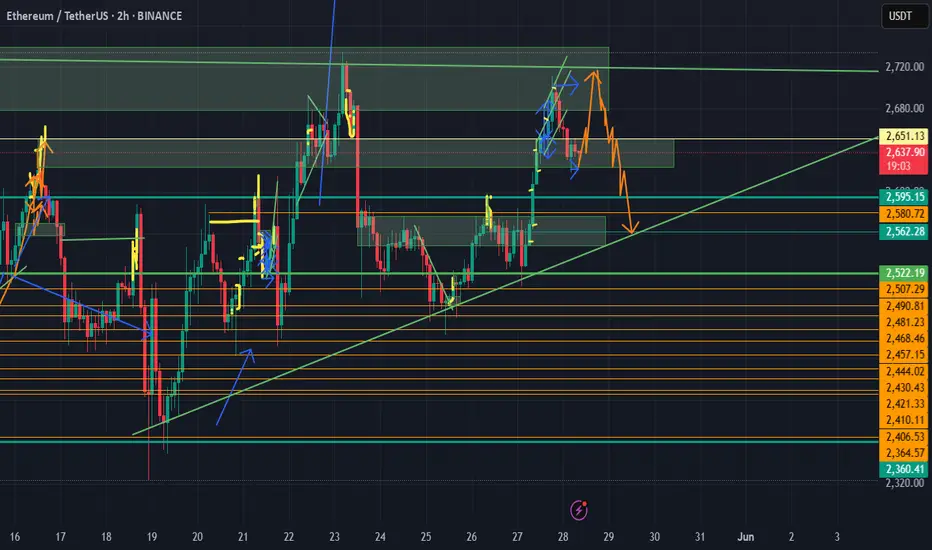
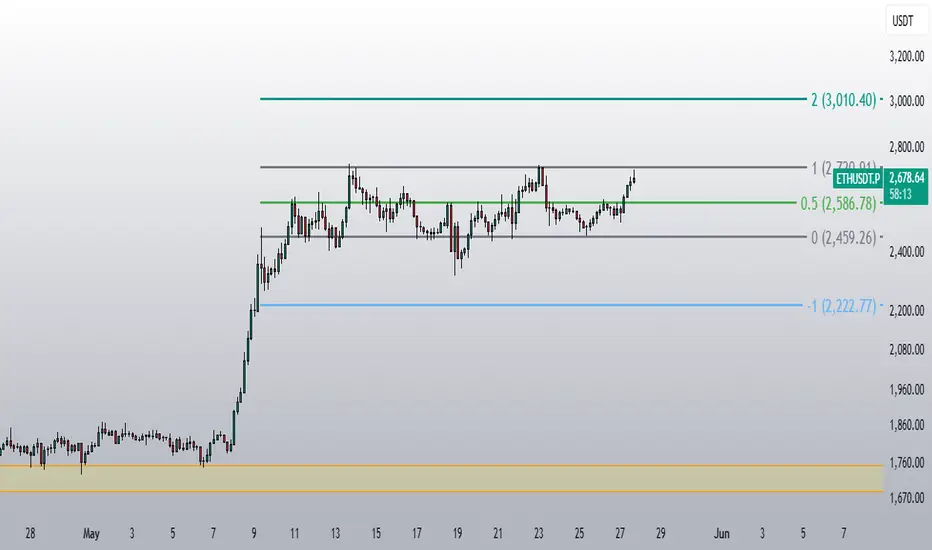
Lingrid | ETHUSDT potential Bullish Breakout ExtensionThe price perfectly fulfilled my last idea . BINANCE:ETHUSDT is pulling back from its recent high after tagging the blue trendline near 2735. Price is now approaching the 2588–2590 support confluence where the range low and the ascending channel intersect. A bounce from this zone would maintain the bullish structure and may trigger a new leg toward 2735 and higher. Trend continuation remains favored above the support trendline.
📈 Key Levels
Buy zone: 2588 – 2590
Buy trigger: bullish bounce with strong volume
Target: 2735
Sell trigger: break and close below 2580
💡 Risks
Break below 2588 could shift bias short
Resistance around 2735 may cause another rejection
Short-term volatility may increase before a clear breakout
Traders, if you liked this idea or if you have your own opinion about it, write in the comments. I will be glad 👩💻

ETH/USDT At A Premium — What’s Next? Smart Entry Strategy!I'm currently analyzing ETH/USDT 🧠💹 — Ethereum has been in a strong bullish trend, recently pushing into all-time highs 🚀🔝. While the momentum remains intact, price is now trading at a premium 🏷️, and I’m cautious about entering long at these elevated levels ⚠️.
In the video, we break down the trend, market structure, and price action with precision 📊🧱. I also explore potential entry scenarios that align with low-risk, high-probability setups 🎯🔍 — ideal for those waiting for the right moment to engage without chasing the move.
You'll also get a deep dive into my Trend Continuation Strategy 🔄📈 — a powerful framework for identifying smart entries in trending markets.
🛑 This is not financial advice

ETH local early double top formation - 25th of May, 2025.(c) First things first.
First Top: Around $2,860 on May 6.
Second Top: Around $2,830–2,850, recently.
Neckline is near marked by horizontal 0.5 Fibonacci level — current setup is very clean. I would say even too clean to be truth.
Price has pulled back after the second peak and is hovering near the neckline. No breakdown yet, but we are close to that.
_________________________________________
📉 Trade Setup (If Double Top Confirms)
1. Entry:
→ Short below the neckline , approx. @ $2 430 with confirmation (candle should close below this level).
2. Stop Loss (SL):**
→ Should be above second top, around $2 860.
→ High risk SL: Above recent candle high ~$2 620.
3. Take Profit (TP):**
→ We get it from height measure:
Top was at $2 850, neckline at $2 430 = ~$400 range
→ TP1: $2 430 − $420 = $2 010
→ TP2: Optional — 0.618 Fib zone near $1 860
_________________________________________
🔁 Retest Setup (If Break + Retest Happens)
If price breaks below the neckline and then comes back up to retest ~$2 430 as resistance, we are looking to:
1) Weak bullish candle or bearish engulfing on retest
2) Lower volume on retest
3) Enter short there with a tighter SL above retest wick.
⚠️ !! WARNING !!
DOUBLE TOP IS Not yet confirmed – price needs to break neckline and re-test it.
We are already in BULL's market, therefore FOLLOW THE GLOBAL TREND.
We are expecting volatility today because of Powells speech, thereofre this setup can be a TRAP, especially, If price closes back above ~$2 600 with strength — pattern is invalidated.
If you trade against the trend you should be ready for consequences. Good luck!

ETH- Etherium - Are we getting ready to Short?1. Resistance Level - Triple top (1st one not visible)
2. Abnormal SI at the top 17.8
3. Waiting for a Plutus Short Signal to Enter
Enjoy!

Ethereum Is Nearing an Important SupportHey Traders, in today's trading session we are monitoring ETH/USDT for a buying opportunity around 2,435 zone, Ethereum is trading in an uptrend and currently is in a correction phase in which it is approaching the trend at 2,435 support and resistance area.
Trade safe, Joe.

Is ETH showing signs of bullish continuation?Ethereum (ETH) may be facing a range breakout, which could trigger the next leg up.
ETH(based on NEowave)I changed my analysis and I think Its better to consider eth in the middle of the running diamond diametrical.
stop loss of this analysis is 2400$.
