ETH at final leg of 5th WaveAre you Ready to Touch 4000$ and start BIG Drop?
ETH is in final reound of 5th wave of 5th, 5 of 5. After that I expect a BIG drop
ETHUST trade ideas

Buy LimitI think it's a great zone to buy — but only if the selling volume decreases as the price approaches that area. Otherwise, we wait for the volume to drop. But I will never buy above that price, even if I miss the move.

Ethereum Analysis + Market Overview 🚀 Ethereum Analysis + Market Overview 🚀
Before diving into Ethereum, let’s quickly review the overall market conditions 👇👇👇
(For a more detailed market analysis, you can check my previous post, I’ll link it below.)
---
🔹 Analysis style:
Reviewing previous highs/lows breakouts in the mid-term (MWC - 4H).
Entries based on momentum & volume.
---
♦️ USDT.D
Support: 4.22
Max expected correction: 4.51
If 4.51 breaks upward, this could push us toward short positions.
---
♦️ BTC.D
Yesterday’s levels & analysis still remain valid.
Remember, on HWC (1D), after the recent downtrend, there’s only been one bullish candle.
For altcoins to rally: BTC.D must drop below 61.6 → 60.83 → 60.42.
Otherwise, if BTC.D grows (bearish for alts), 62.17 is the key resistance to watch.
---
♦️ TOTAL (Crypto Market Cap)
Must break 3.91 to confirm a bullish trend.
Early signal: 3.85 (1H timeframe).
---
♦️ TOTAL2 (Altcoin Market Cap)
Early bullish signal: 1.48
Confirmation level: 1.55
---
♦️ ETH (Ethereum)
Ethereum has shown strong support around 3500, despite the 48-hour drop, which reflects solid buying activity.
Additionally, positive whale news is increasing.
Early & risky trigger: 3653 (1H) – already broken.
Next potential entries:
3750 (1H)
3833 (4H)
Preferred entry: 3750, as it allows a tighter & safer stop-loss.
Beware: Fake breakout probability around 3833 is high.
Stop-loss for all 3 levels: 3455.
---
🔸 Entry Strategy:
If volume & momentum increase → place a stop-buy order on the exchange.
If volume is weak → wait for confirmed breakout above 3750.
---
♦️ ETH.D
The chart is fully bullish.
If ETH hits 3750, an early long position could be taken.
---
💎 Follow me & hit 🚀 for more real-time updates and setups!
---

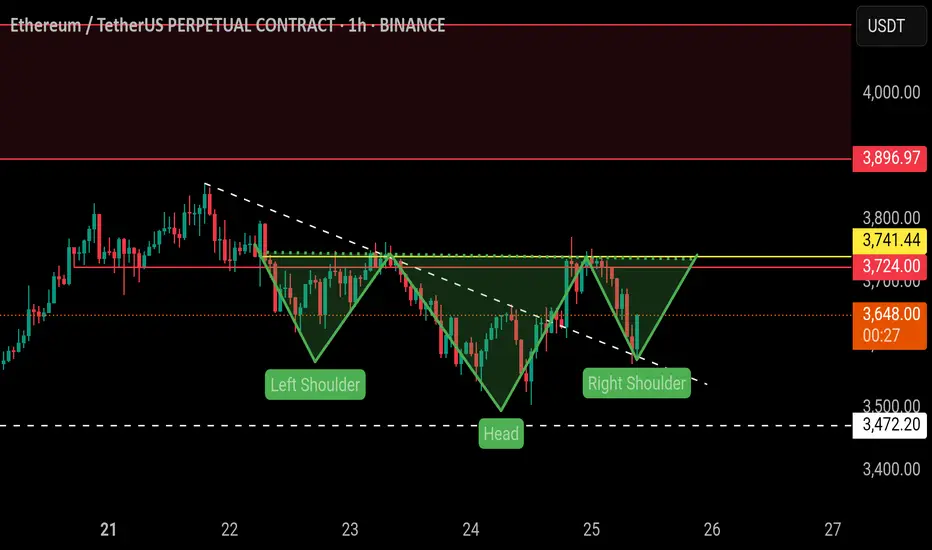
$ETH | Ready to fly (Inverted head and shoulders)BINANCE:ETHUSDT.P
On 1H TF, the price is forming inverted head and shoulders pattern, which is a strong bullish pattern.
The price has retested the trendline support and bounced back.
Expecting it to breakout above yellow line soon.
A breakout above the yellow line will be a bullish and pattern confirmation.
We can initiate a long entry from here.
Please do proper risk management and must use stop loss.
NFA, DYOR
Ether is About to Break the FlagETH is making an attept to break flag formation. 3860 top could be the short term target for upward moves. Over the medium term, 4100 could be the main target. Our bull cycle top target is 6830 for the moment. This was a quick update,please check our earlier post for details.

Ethereum (ETH): 2 Successful Trades | Targeting Now $4800Ethereum was so close to $4K that we considered it basically reading the target; now we set a new target and a new entry for us as well.
We are looking for a complete breakout to happen from the region of $4000, which then would open for us an opportunity for a bullish move towards the $4800.
Swallow Academy

EthusdNot discounting the potential for a dip into the August montly open...
Retesting the trend line break for a second time..
Then we enter etf bid war phase.. multiple companies attempting to emerge as the strategy b of ethereum.
Bitmine and sharplink are leading but there's about 10-30 companies starting to accumulate heavily..

Ethereum (ETH): Getting Closer To Our Third Target | $4000Ethereum has done really well since our entry, and we are almost at the third target. After that, we are going to expect to see the movement towards the ATH area.
As we said, money flow has to go somewhere, and as Bitcoin has had its time, now people need new projects where to get their profits from, which was of course the ETH. Still good for long, still has time to make that new ATH.
Swallow Academy

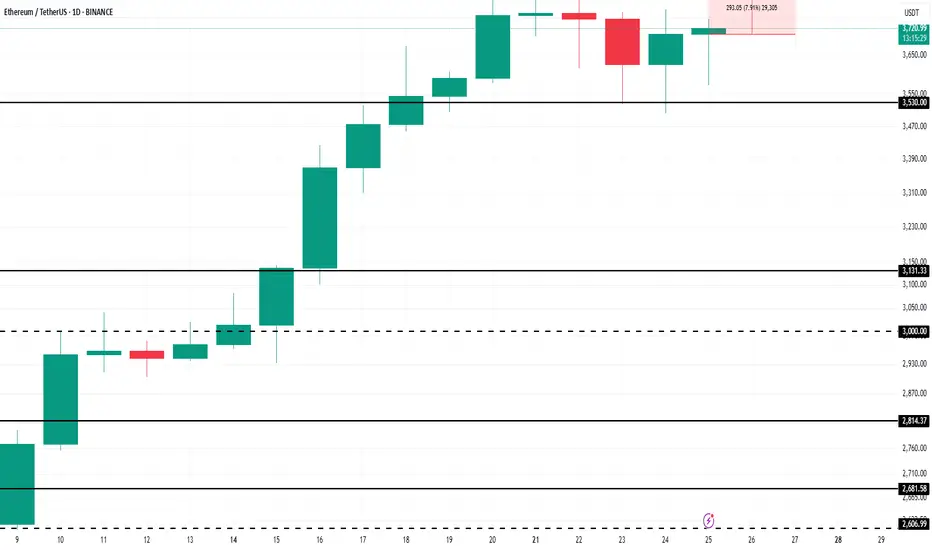
Ethereum’s $4,000 Target Alive as Historic Rally Signs EmergeBINANCE:ETHUSDT is currently trading at $3,680, just 9% away from the critical $4,000 resistance that many investors have been waiting for over the past seven months. The altcoin is expected to continue its upward momentum despite the recent consolidation, with the potential to breach the $4,000 mark soon.
Looking at broader technical indicators, the NUPL (Net Unrealized Profit/Loss) suggests that BINANCE:ETHUSDT is poised for a significant rally . The NUPL indicator, when reaching a threshold of 0.5, traditionally signals a pause in the uptrend, followed by a sharp rally.
$ BINANCE:ETHUSDT is currently nearing this threshold , which, in the past, has marked the beginning of powerful upward price action.
As long as BINANCE:ETHUSDT remains above its key support levels, the price is likely to surge toward $4,000 . If Ethereum can maintain its momentum, a breach of $4,000 could act as a catalyst for further gains.
However, should unforeseen selling pressure arise, $BINANCE:ETHUSDTprice could slip below the $3,530 support level. In such a scenario, Ethereum may fall to $3,131, invalidating the current bullish outlook. The key will be maintaining support and capitalizing on the retail-driven surge.
eth buyI think Ethereum is ready for a historic bull run, it has collected almost all the lower stops and has done everything right in terms of the right trend pattern. But from a fundamental perspective, with the arrival of President Trump and the launch of Ethereum ETFs, we can see a historic growth for Ethereum from a fundamental perspective, but we have to wait for the right pattern for the entry point. I will specify a few ranges for you, and my expectation is that Ethereum will be at $20,000.

ETH: Will Price Continue Upwards Movement! ETH has been steadily bullish in recent times, as the crypto market experienced a significant increased a safer option to invest around the global investment community. DXY and other major currencies currently experiencing a major drawdown in prices which indirectly helping the crypto market to remain bullish. While looking at how eth has performed in recent past, we can see it creating a record high in coming weeks.
Ethereum (ETH): Bollinger Bands Middle Line Has Been Broken!Well, buyers have to take back the control over the middle line of BB in order to see further movement to upper zones from the current market price.
This is one crucial zone, as upon sellers taking dominance here, we will most likely fall back closer to our entry point here.
But even after that, we still will be expecting the $400 area as our major target (psychological target) will be reached with time so we wait patiently!
Swallow Academy

Ethereum (ETH): RSI Restarted, Going For $4000 Now?We were very close to our target of $4000,, where we had an early overtake by sellers, correcting the coin properly and stabilizing most of the the indicators like Bollinger Bands and RSI that we both use.
Monday was full of manipulations and now today we started with some strong downside movement, but we are bullish as long as we are above $3400
Swallow Academy

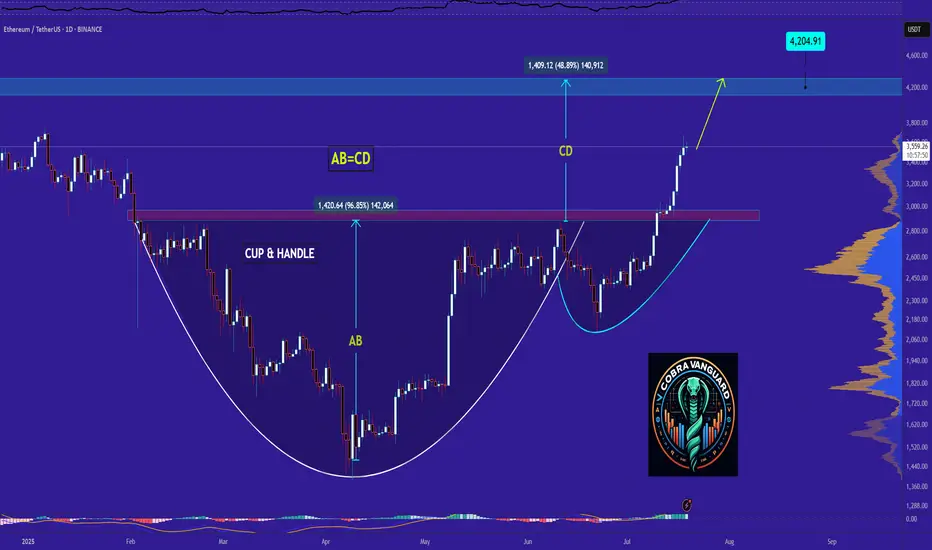
Ethereum - Time to buy again!Exactly, based on previous analyses, the price is rapidly approaching $4,000. But we need to be cautious because whenever it hits round numbers, something big usually happens!!!
previous analysis
Best regards CobraVanguard.💚
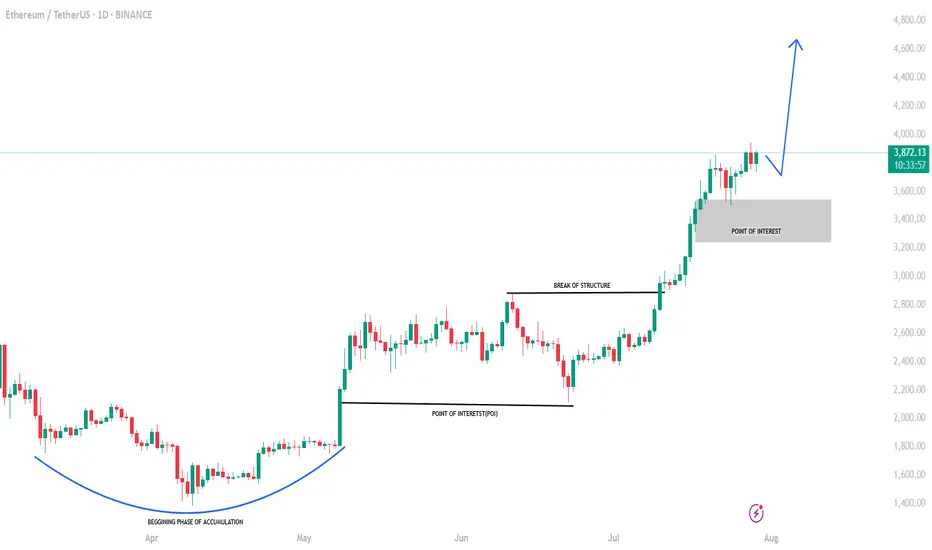
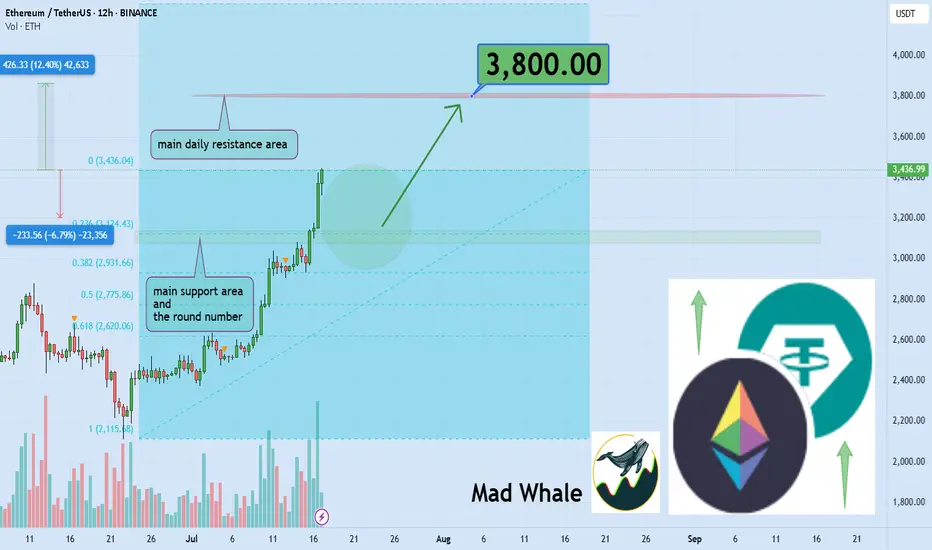
Crypto Exploded, I Missed it, What should I Buy Now?!The market suddenly exploded… green candles after green candles. Yesterday, you were hesitating to look at the chart, today everyone on social media is posting their profits. So what now? Did you miss out? It’s not too late. The main question now is: What should I buy to catch up?
If you read this analysis till the end, not only will you learn some practical TradingView tools, but you’ll also gain insight into how to act like a professional trader after big pumps not like a reactive follower.
Hello✌
Spend 3 minutes ⏰ reading this educational material.
🎯 Analytical Insight on Ethereum:
BINANCE:ETHUSDT is currently holding near the daily support and the key psychological level at $3,000, which also matches the 0.23 Fibonacci retracement. A potential upside of at least 12% is expected, targeting $3,800 close to a major daily resistance zone. Keep an eye on these levels for possible trade setups 📊⚡.
Now , let's dive into the educational section,
🧠 FOMO: The Enemy That Devours Your Profits
If you feel like you missed the boat now, don’t panic. Everyone has felt that, even top traders. It’s called "FOMO." Jumping into the market without analysis and just on emotions can burn you badly. Instead of regretting, sit calmly, analyze, and wait for the right setup. The market always offers new chances you just need to know how to hunt them.
🔍 What to Buy Now? Logic Over Emotion
There are three types of coins still offering opportunity:
Coins that haven’t broken their previous highs yet
Like a compressed spring, they can jump higher with a small push.
Altcoins lagging behind Bitcoin
When BTC pumps, alts usually follow afterward.
Coins with strong upcoming fundamental news
Networks with upcoming updates or special events that generate excitement.
Don’t forget on-chain analysis. See where money is flowing.
🌟 Look for New Stars and Strong, Established Coins
After a pump, there are two ways to hunt:
🔹 New Stars
Altcoins that are just coming out of their correction phase and haven’t had their main pump yet.
🔸 Strong and Established Coins
Assets that have shown resilience, have strong fundamentals, and tend to pump again after corrections.
Balance your portfolio with both to lower risk and maximize profit potential.
🧰 TradingView Tools to Hunt Opportunities After a Pump
To avoid missing out in the second phase of the market explosion, you must use TradingView’s analytical tools correctly. Here are three key tools you should know right now:
Volume Profile
Helps you understand where most trading volume occurred. Smart money usually buys and sells heavily at these points.
RSI (Relative Strength Index)
Tells you when the market is overbought. When it drops back to the 40 to 50 range after a peak, that could be a good re-entry point.
Fibonacci Retracement
A tool to find attractive correction zones after a pump. Especially useful if you combine multiple timeframes.
⚖️ Stop Loss Is Necessary, But Take Profit Is More Important
Always place a stop loss in the market. But many forget to set a take profit in bullish markets.
Having a take profit level ensures you lock in gains when the market hits your target and avoid greed.
Key point: Even if you expect huge pumps, take some profit on time to avoid losing it all during corrections.
🪙 The Next Pump Is Just Around the Corner
Instead of jumping into a pump mid-way, focus on spotting setups just forming. Watch for consolidation candles, rising volume, and reactions to classic zones. That’s where you can enter professionally, even before everyone knows what’s coming.
🛠 Game Plan for the Trader Who Fell Behind
Pick three coins that haven’t pumped yet
Test the tools mentioned on them
Set alerts for logical entry signals
Enter with risk management, not emotion
Most importantly analyze, don’t just follow
📌 Summary and Final Advice
If you missed the market pump, don’t worry; crypto markets always offer opportunities you just need to be prepared. A combination of analysis, professional tools, and smart choices between new and established assets can help you not only catch the next pump but ride it ahead of everyone else.
✨ Need a little love!
We pour love into every post your support keeps us inspired! 💛 Don’t be shy, we’d love to hear from you on comments. Big thanks , Mad Whale 🐋
📜Please make sure to do your own research before investing, and review the disclaimer provided at the end of each post.
Ethereum to $12,000The chart, spanning from mid-2021 to projected levels into 2027, showcases Ethereum's price in a classic ascending channel, characterized by higher highs and higher lows. This is indicative of sustained buyer control and a maturing bull cycle.
Price Action and Key Levels: Ethereum bottomed out near $880 in June 2022 (close to the S2 support level around $900), forming a strong base. Since then, it has rallied through multiple resistance zones, with the most recent breakout above the R1 level at approximately $3,471. This breakout, confirmed by a close above the line on higher volume, flips R1 into new support and opens the door for further gains. The pivot point (P) sits around $2,800, providing a safety net, while lower supports at S1 (~$2,400) and S2 (~$1,200) have held firm during previous pullbacks. On the upside, the next targets include R2 (~$4,700), R3 (~$6,000), R4 (~$8,500), and R5 (~$11,000). Extending this using Fibonacci projections from the 2022 low to the 2024 high (a common tool for measuring bull runs in crypto), we arrive at a target of $12,000, which aligns with the upper channel boundary and historical cycle multiples.
Volume Confirmation: The bottom panel shows volume bars spiking during uptrends, particularly in the recent push above R1. This indicates accumulation by institutional investors and retail buyers alike, with declining volume on pullbacks suggesting limited selling pressure. Increasing volume on breakouts is a hallmark of sustainable rallies, reducing the risk of a false move.
Momentum Indicators: The blue line in the sub-chart appears to be the Relative Strength Index (RSI), currently hovering above 50 and trending upward without entering overbought territory (above 70). This signals building bullish momentum with room to run. Additionally, the lack of divergence between price and RSI further supports the strength of the current uptrend. If we see the RSI push toward 60-70, it could coincide with acceleration toward higher resistance levels.
Overall, the chart reflects a multi-year consolidation phase transitioning into expansion, similar to the 2020-2021 bull run. A measured move from the recent range (from ~$2,200 low to ~$4,000 high) projects an upside of roughly 3x, landing near our $12,000 target.
Fundamental Catalysts
Ethereum's technical strength is bolstered by robust fundamentals, making the bullish case even more compelling:
Network Upgrades and Adoption: Recent upgrades like Dencun (2024) have drastically reduced layer-2 fees and improved scalability, driving real-world usage in DeFi, NFTs, and gaming. Ethereum's dominance in smart contracts remains unchallenged, with total value locked (TVL) surpassing $60 billion and continuing to grow.
Institutional Inflows: The approval of spot Ethereum ETFs in 2024 has opened the floodgates for traditional finance, with billions in inflows expected to continue. Major players like BlackRock and Fidelity are ramping up exposure, providing a steady bid under the price.
Macro Environment and Crypto Cycle: With Bitcoin's post-halving rally typically leading altcoins like Ethereum, we're in the midst of a favorable cycle. Easing global interest rates and a weakening USD (as seen in recent Fed signals) further support risk assets like crypto. Ethereum's deflationary mechanics via EIP-1559 (burning fees) create scarcity, enhancing its store-of-value narrative.
Risk Considerations and Entry Strategy
While the outlook is bullish, no analysis is complete without risks. A broader market downturn (e.g., due to regulatory hurdles or economic recession) could push ETH back toward S1 at $2,400, invalidating the short-term breakout. However, the chart's structure suggests strong support there, making dips buyable opportunities.
For entry, consider positions on a pullback to the new support at $3,471 (former R1), with a stop-loss below $3,000 to manage risk. Position sizing should account for volatility—aim for 1-2% risk per trade.
In summary, Ethereum's chart screams bullish continuation, with technical breakouts, rising volume, and positive momentum aligning for a push to new all-time highs. Targeting $12,000 represents a realistic extension of the current trend, potentially delivering 3x returns from current levels around $3,500. This isn't just speculation; it's a confluence of data-driven signals in one of the most innovative assets in the market. Stay long, stay vigilant.

ATH FOR Ethereum!!!Hello friends🙌
As you know, Ethereum has been on an upward trend these days and we can say that buyers have entered, but not completely...👀
🔊Now, considering the resistance that Ethereum is facing, namely the number 3900 to 4100, we need to see what reaction the price will see this time when the price reaches this resistance for the 4th time?
✔We will most likely make a small correction and this time this major resistance will be broken again and we will witness a higher ceiling.
✔Otherwise, I have an important and key support that we have identified for you and if the price drops, this support is a good area to buy again.
And finally, observe risk and capital management⚠
🔥Follow us for more signals🔥
*Trade safely with us*

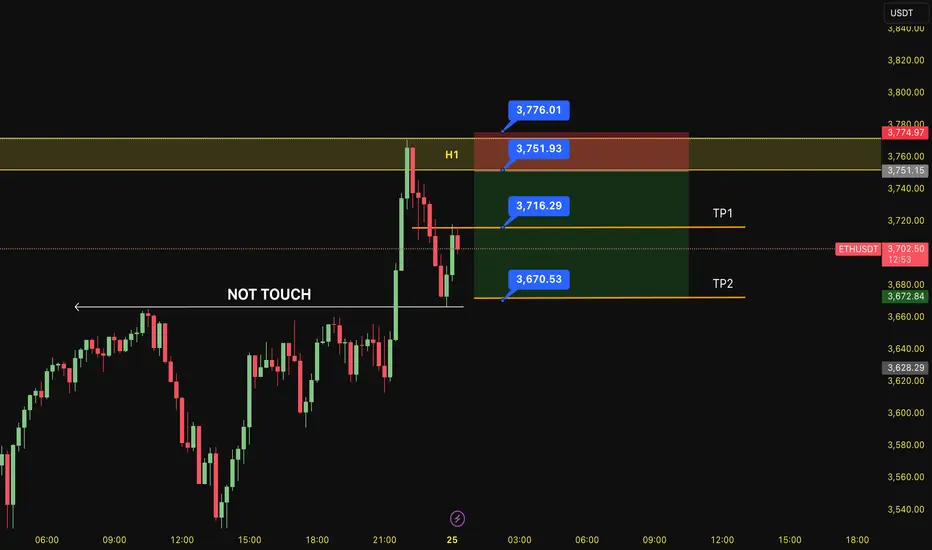
SELL ETH 25.7.2025Reversal trade order: SELL at H1~M15
Type of entry: Limit order
Reason:
- Candle creates reverse number 1 model
- The bottom hasn't touched any peak yet (meaning it hasn't reached a strong reversal zone)
Note:
- Management of money carefully at the price of bottom of M5 (3,716)
Set up entry:
- Entry sell at 3,751
- SL at 3,776
- TP1: 3,716
- TP2: 3,670
Trading Method: Price action (No indicator, only trend and candles)
ETH/USDT – Weekly Chart Analysis !! ETH/USDT – Weekly Chart Analysis
ETH is testing a major historical resistance between $3,700 – $4,000 (highlighted green zone).
A clean breakout above this level could push price toward the next key resistance at ~$4,660.
Previous accumulation zone around $2,400 – $2,800 (yellow box) now acts as strong support.
Long-term floor at $1,420 and $1,025, though currently far below.
Bullish Breakout Potential: If ETH sustains above the green resistance, it may retest $4,660+.
A failure to break above $4K could lead to a healthy pullback toward the yellow zone (~$2,800).
Stay updated and manage your risk accordingly.
DYOR | NFA

ETHUSDT.PIf you look at the chart, you will notice an uptrend that has somewhat lost its strength and we may not be able to hit higher highs like the next strength in the next move.
Support: 3.660 - 3.590 - 3.160
Resistance: 3.900 - 4.260
Entry: 3.700
SL: 3.500
TP: 4.240
Please control risk management.⚠️

#ETH Update #5 – July 27, 2025#ETH Update #5 – July 27, 2025
Ethereum is attempting to revisit the levels of its previous impulsive move without having completed a proper correction. The fact that Ethereum has not made a retracement around 3280 and is instead pushing toward a new ATH does not seem very healthy to me. If it had completed the correction, it would have also balanced an existing imbalance in the structure.
When we look at the recent candles, we observe a lack of volume. This volume weakness is not sufficient to break the resistance at the previous high. If Ethereum breaks the 3900 dollar resistance level with a strong candle, it could move toward the 4335 dollar zone.
However, it should not be forgotten that there is still an imbalance and a correction zone around 3280 dollars. If the price decides to return to that level, it would mean an approximately 15% pullback from here. This could pose significant risk for altcoins, and we might see corrections of up to 40% in some.
Ethereum is currently one of the riskier assets for either taking a long or short position. Therefore, I do not recommend opening any position at this stage.

Ethereum (ETH): Nothing Has Changed, We Still Target $4000Ethereum buyers have to reclaim back the middle line of Bollinger Bands, which recently switched the trends and is now under the control of sellers.
This sideways movement we have had is like a perfect setup, which will most likely lead the ETH to $4000K, which is one of the major resistance areas and a round number, which gives it a status of "psychological resistance."
Swallow Academy

