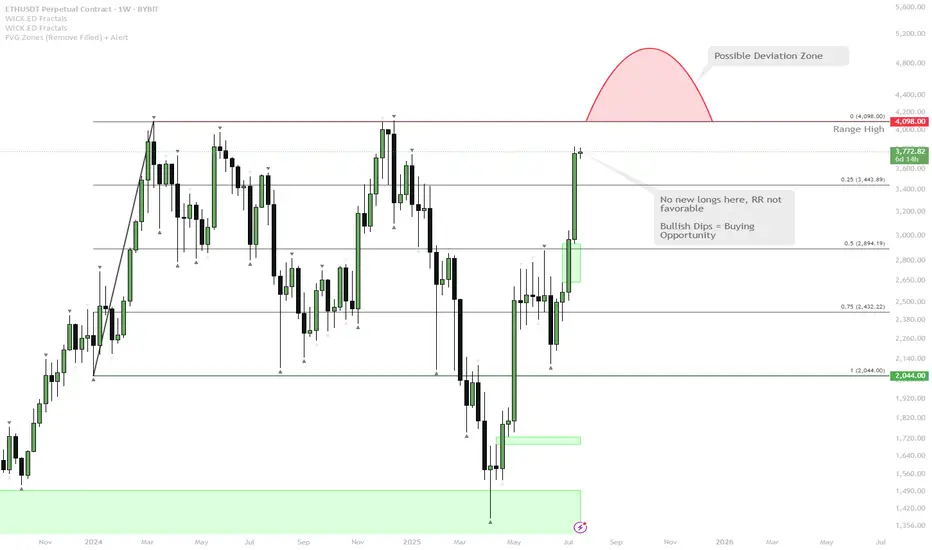
ETH Approaching Major Resistance — Watch for Range High Deviatio
ETH has rallied strongly and is now testing the range highs around $4,100.
The most likely scenario is a direct tap or wick above the range highs — this is a classic spot where the majority expects continuation, but also where deviations (fakeouts) frequently occur.
If price closes above and holds, it could trigger further upside. However, the risk/reward (RR) for fresh longs here is not attractive after such an extended move.
A deviation above range high (quick push above, then close back inside) is possible and would be a bearish signal in the short term.
After this wave, any deep dips in ETH will likely be a high-conviction buy, given the strong bullish momentum.
ETH is showing extremely bullish momentum as it approaches a major weekly resistance at the range high. The obvious play here is a sweep or break of this level, but with the move being so extended, a deviation or fakeout becomes increasingly likely. While momentum is still up, waiting for a dip or failed breakout (deviation) is a better risk/reward play than chasing longs here. Any meaningful pullback will likely present an excellent buying opportunity given the macro strength.
ETHUST trade ideas
Ethereum (ETH) Analysis – July 22, 2025🚨 Ethereum (ETH) Analysis – July 22, 2025
👉 Please read the previous post first. That one explains the fundamental background and market behavior that led to today’s setup.
Now let’s zoom in on ETH with some fresh analysis 👇
---
✅ ETH/BTC – Trend Structure
📈 The overall trend is still bullish, even though today's candles are red and corrective.
🔹 Resistance: 0.03242
→ A breakout here = confirmation to enter or continue long.
🔹 Support: 0.03072
→ Price reacted here, showing it’s a valid level.
🔹 Key Support: 0.02975
→ If broken, the bullish structure breaks, and a deeper correction may begin.
---
📊 ETH Dominance (ETH.D)
🔹 Resistance: 11.90%
→ Staying above this = support for keeping or adding to longs.
🔸 Support Zones:
11.45%
11.22%
→ Strong zones if market pulls back.
---
🌐 TOTAL2 (Altcoin Market Cap Without BTC)
🔹 Key Resistance: $1.55 Trillion
→ Breaking above this = more upside for altcoins, including ETH.
---
🔎 ETH/USDT – 4H Timeframe
✅ Mid-term trend is still up, but we are entering a correction phase.
📉 Price is testing the key 3,480 level.
📊 Volume is high, and momentum is fading, which shows buyers are getting weaker.
📈 20 EMA and 50 EMA are still rising, but flattening.
---
📌 Key Confluences
🧩 USDT.D at 4.14%
🧩 BTC Dominance at 61.31% and 60.42%
These levels + ETH chart = critical for making accurate decisions.
---
📈 Main Scenarios
🟡 Scenario 1 – Sideways Range
→ Price moves between 3,480–3,850
→ If confirmed, smart entries from edges with tight SLs make sense.
🔻 Scenario 2 – Breakdown of 3,480
→ Bullish 4H structure breaks
→ Possible drop to 3,200 or even 3,060
⚫ Scenario 3 – Breakout of 3,850
→ Likely moves to range between 3,850–4,000
→ Market enters a “macro decision zone”
🟢 Scenario 4 – Sharp Break Above 4,000
→ Strong bullish signal
→ Daily uptrend may continue toward 4,400 or even a new ATH
---
🚀 If this analysis helped:
🔁 Tap the rocket to boost
🔔 Follow for more clear updates
💬 Comment your thoughts or chart ideas!

Ethereum (ETH): RSI Restarted, Going For $4000 Now?We were very close to our target of $4000,, where we had an early overtake by sellers, correcting the coin properly and stabilizing most of the the indicators like Bollinger Bands and RSI that we both use.
Monday was full of manipulations and now today we started with some strong downside movement, but we are bullish as long as we are above $3400
Swallow Academy

Huge Bear Trap next in line??Ethereum Exit Queue: 518,180 ETH
Half a million ETH is currently queued for unstaking on Ethereum...
Keep in mind, August 1st, Trump's Reciprocal Tariffs get in effect
Everyone's talking about BTC's new ATH, ETH's rally, XRP new ATH, but no one is talking about August 1st...
Manipulation is taking place. Stay safe, because a huge bear trap might be next in line (BTC back to 90K)
*NOT INVESTMENT ADVICE*
#crypto #ethereum #eth #btc #bitcoin #trading #xrp #trump #tariff #finance #economy

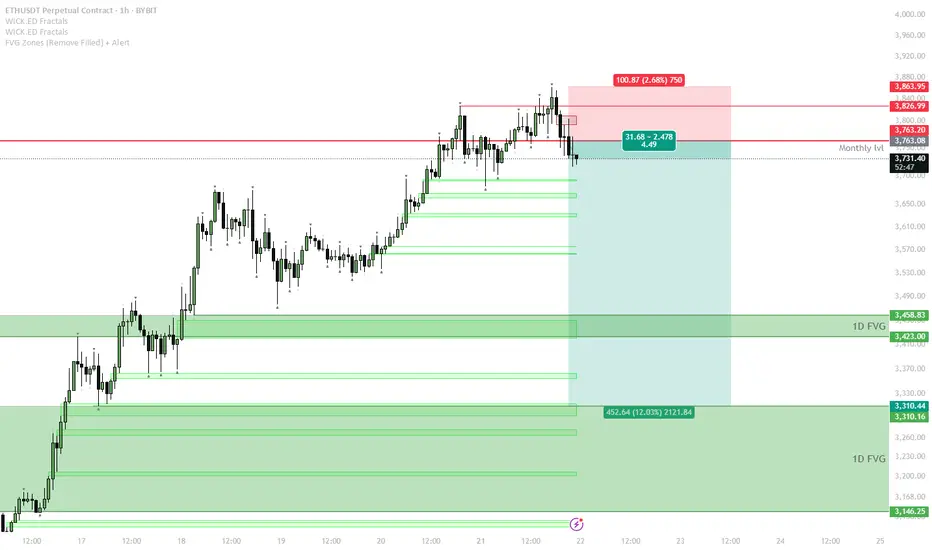
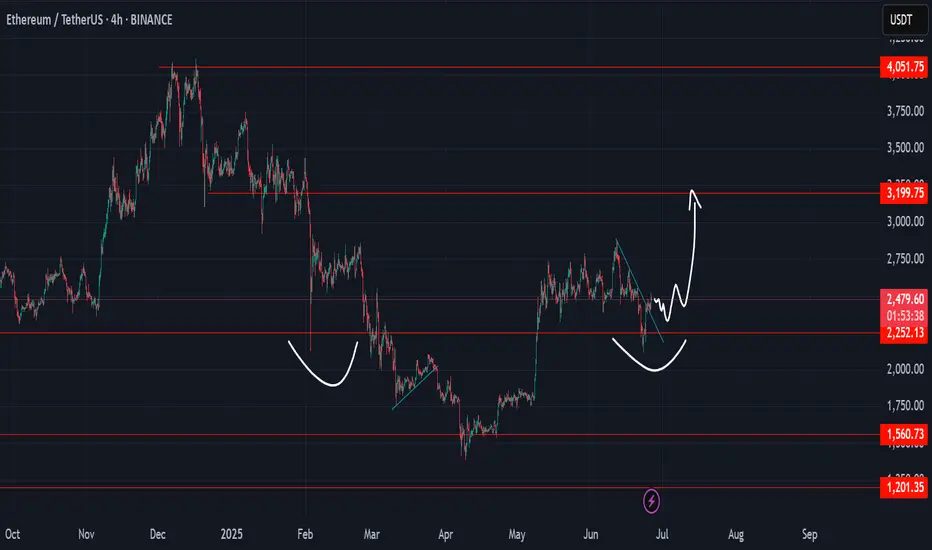
ETH Short Setup — Waiting for Range Formation After Parabolic Mo
The parabolic uptrend has broken, and ETH is testing the previous monthly resistance at $3,763.
If price fails to reclaim the monthly level and continues to range below it, expect a sideways range to form between $3,760–$3,850 (red box) and local support zones.
The short trigger is a sweep of the range high (top of the red box) followed by rejection or failure to hold above $3,850.
If price confirms a failed sweep, a short position can target the 1D FVG zone around $3,460, with the next possible target at $3,310.
Invalidation: A strong reclaim and acceptance above $3,850 invalidates the short idea — switch to neutral or bullish bias in that case.
The setup follows a classic pattern after a parabolic run: momentum stalls, a range forms, and liquidity is swept at the range top before a correction. Sellers are likely to step in if price fails to establish new highs above the red zone. Downside targets align with major FVGs and previous breakout areas, providing logical levels for profit-taking.
Ethereum (ETH): Nothing Has Changed, We Still Target $4000Ethereum buyers have to reclaim back the middle line of Bollinger Bands, which recently switched the trends and is now under the control of sellers.
This sideways movement we have had is like a perfect setup, which will most likely lead the ETH to $4000K, which is one of the major resistance areas and a round number, which gives it a status of "psychological resistance."
Swallow Academy

How far will the drop go?Ethereum is currently in a downtrend, and so far we don't see any signs of a reversal yet.
But let’s not forget that in the higher cycle, the trend remains strongly bullish.
Now you may ask — when is the best time to buy Ethereum?
3500? Or 3400?
We need to wait a bit to get more confirmations before answering that.
I’ll share the best buy zone with you soon in the near future.
Good luck!
ETH in correction mode. But only for a while!As a result of breaking the previous biggest resistance of CRYPTOCAP:ETH , this was predicted to require a correction and range. However, Ethereum is expected to start breaking 4200 as soon as we anticipated.
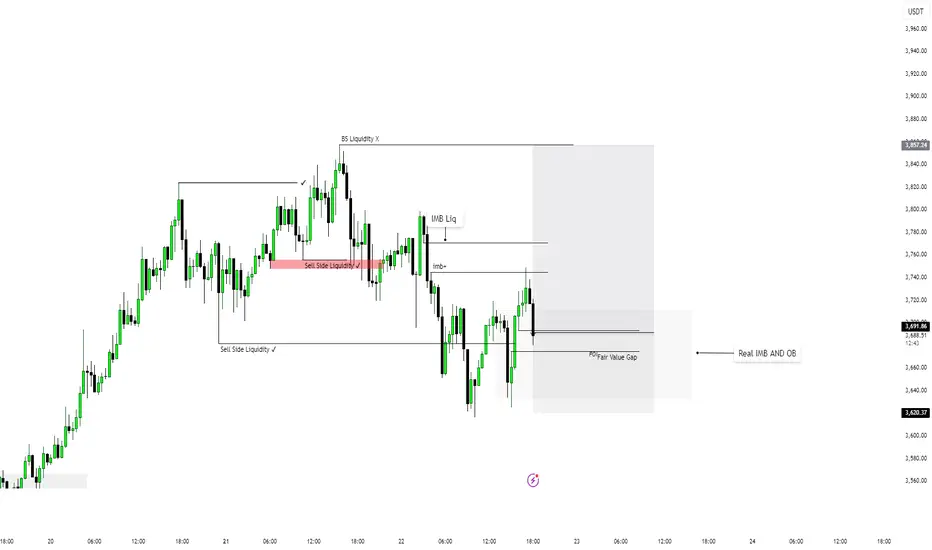
ETHUSDT SCALP SESSION SMC Analysis | Liquidity Sweep → IMB/OB Reclaim | Long Setup
Price action shows a clear sweep of Buy-Side Liquidity (BSL) above previous highs, followed by a sharp rejection and move downward. Liquidity was collected both at the top (BS Liquidity X) and below (Sell Side Liquidity ✓), confirming a classic liquidity grab setup.
Price is currently retracing into a Fair Value Gap (FVG) and approaching the zone marked as Real IMB and OB, indicating a potential high-probability reversal area.
Key confluences:
✅ BSL taken
✅ SSL taken
🕳 IMB Liquidity filled
📉 Pullback into FVG
🎯 Anticipating reaction from the OB zone (~3620) for a long continuation.
This setup targets a return toward previous inefficiencies and liquidity pools around 3694–3867. Entry confirmation required inside the OB zone or on lower-timeframe structure shift.
Ethereum (ETH): Bollinger Bands Middle Line Has Been Broken!Well, buyers have to take back the control over the middle line of BB in order to see further movement to upper zones from the current market price.
This is one crucial zone, as upon sellers taking dominance here, we will most likely fall back closer to our entry point here.
But even after that, we still will be expecting the $400 area as our major target (psychological target) will be reached with time so we wait patiently!
Swallow Academy


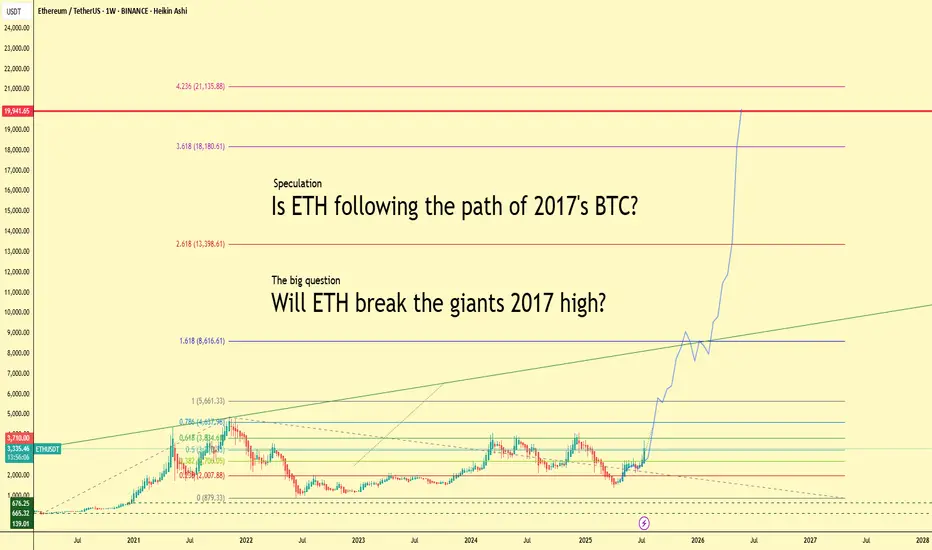
Will ETH Follow BTC’s 2017 Path? $20K in Sight?Ethereum is heating up — up more than 20% this week and currently trading above $3,300. But what if we told you this might just be the beginning?
This chart explores a bold yet exciting speculation:
👉 Is ETH repeating Bitcoin’s legendary 2017 run?
Back then, BTC went from obscurity to global headlines, smashing through $1k, then $5k, then $10k… and eventually peaking just below $20,000. Ethereum might just be lining up for a similar parabolic path.
🚀 Fibonacci Levels Say: Sky’s the Limit
The chart projects Fibonacci extensions up to:
1.618 = $8,600
2.618 = $13,400
3.618 = $18,180
4.236 = $21,135
Notice the key level: $19,941. That’s the legendary BTC high of 2017. Will ETH match or even surpass that milestone?
🧠 The Big Question:
Can ETH become the new “giant”?
While Bitcoin still leads the narrative, Ethereum’s ecosystem, real-world adoption, and institutional attention have never been stronger.
💬 Let’s Talk
Do you believe Ethereum is set to break $20K this cycle? Or is this just hopium and lines? Share your thoughts and let's compare notes.
#Ethereum #ETHUSDT #Crypto #Altseason #BTC2017 #Fibonacci #Bullrun #ETHBreakout #Parabola #CryptoSpeculation
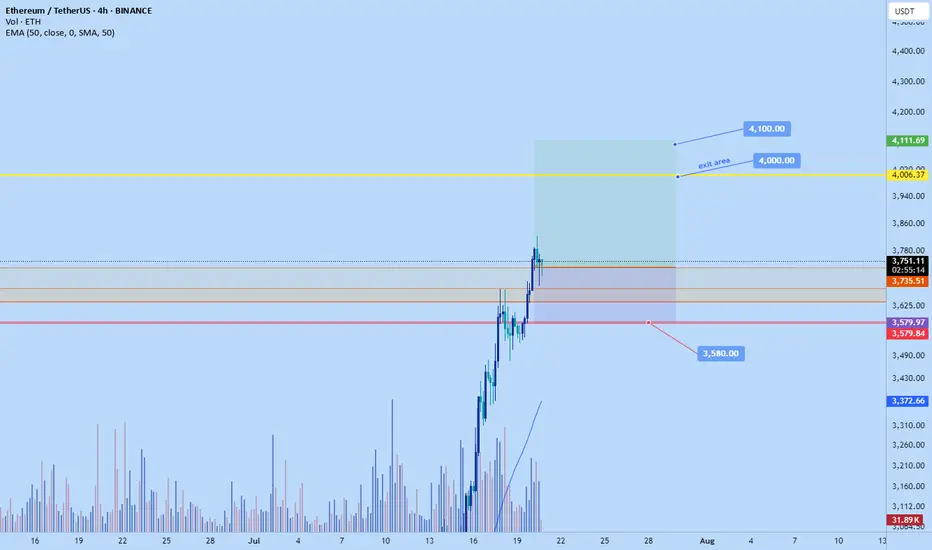
ETHS Swing long to $4100Just now opened a swing long position on eth...though looking at it from the 4hr kinda looks like it might get hit today or tomorrow....that be awesome
Playing it conservative.
Stop is below prior week low at $3580
The prior week closed with little top wick rejection with big strong body. Daily also close similar . 4hr and 1hr tend is also aligned so basically all trends align from weekly to 1hr which stacks the odds significantly in our favor.
And fundamentally there has been a lot of talks about Etereum.. Lets see how it goes.
Roughly 2.42 RR. I did size up to like 4 times my usual risk.
ETH-----Sell around 3680, target 3650-3630 areaTechnical analysis of ETH contract on July 22:
Today, the large-cycle daily level closed with a small positive line yesterday, the K-line pattern continued to rise, the price was above the moving average, and the attached indicator was running in a golden cross. The overall upward trend was still very obvious, and yesterday's decline can be regarded as a correction based on the current trend. The price just returned to the support of the moving average, and the strong support position was near the 3630 area; the short-cycle hourly chart currently has a continuous negative K-line pattern, the price is below the moving average, and the attached indicator is running in a dead cross, so let's look at the retracement trend during the day, and pay attention to the 3630 area below the support.
Today's ETH short-term contract trading strategy:
The current price is 3680, short, stop loss in the 3745 area, and the target is the 3650-3630 area;

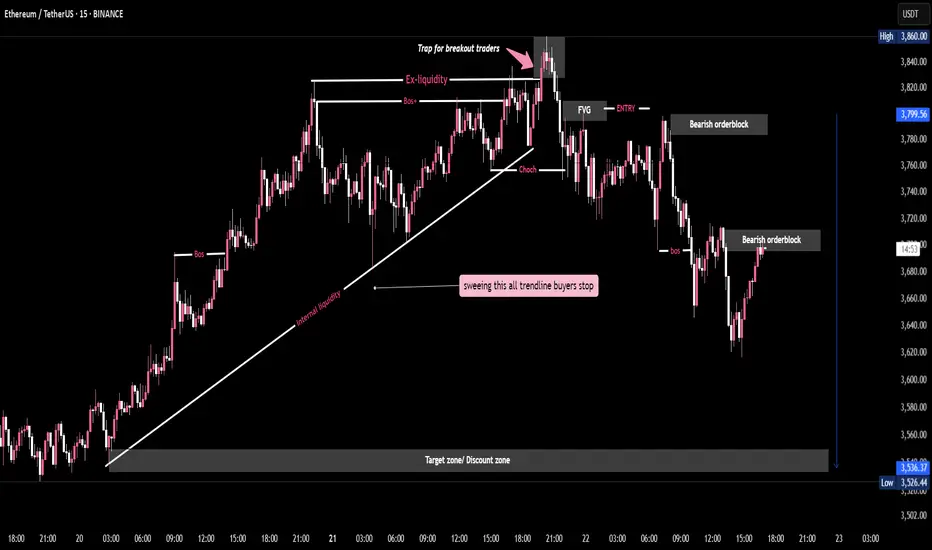
Liquidity Hunt Complete - ETH/USDT 15M BreakdownThis 15-minute ETH/USDT chart outlines a classic Smart Money Concept (SMC) short setup. Price action formed a bullish trendline, building internal liquidity and inducing breakout traders above previous highs (Ex-liquidity).
A clear CHoCH (Change of Character) and subsequent BOS (Break of Structure) confirmed bearish intent. Entry was taken at the Fair Value Gap (FVG), aligned with a bearish order block. Price is projected to sweep trendline buyers’ stops and target the discount zone below.
This analysis showcases liquidity engineering, stop hunts, and institutional footprints, providing a high-probability short scenario with well-defined entries, stops, and targets based on SMC principles.
ETH and iHnS SpeculationETH in candle stick mode create iHnS pattern
if we can hold above 2k its still positive if we can retest to 3.2k
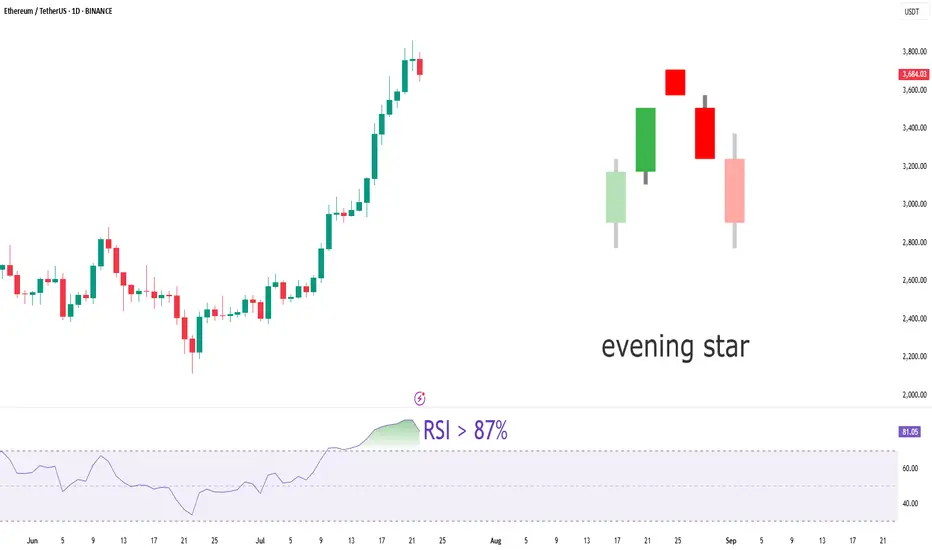
Ether: Signs of an Impending Decline?On July 21, 2025, Peter Schiff, a well-known Bitcoin critic and gold advocate, posted on X. His tweet, garnering over 1.5 million views, immediately captured the crypto community's attention:
"Ether is back near the upper end of its trading range again. If you own any, this is a great time to sell. As much as it pains me to say, selling Ether and buying Bitcoin with the proceeds is a better trade than holding Ether."
While coming from a skeptic, this statement resonates with concerns from many analysts who point to potential bearish signals for the second-largest cryptocurrency. Several factors could contribute to a further decline in Ether's price in the near future.
Technical Analysis
From a technical analysis perspective, the outlook for Ether also appears concerning. Yesterday, July 21, on the daily timeframe, the RSI (Relative Strength Index) surged past 87%. Such a high RSI value frequently signals an overbought asset, indicating a strong likelihood of an imminent price correction or decline. Investors who rely on technical analysis might interpret this as a clear signal to take profits.
Concurrently, on the same daily timeframe, a "Bearish Evening Star" candlestick pattern formed. This three-candle pattern is considered a powerful bearish reversal signal. An "Evening Star" typically emerges after an uptrend, pointing to a potential start of a downward movement. The combination of an extremely high RSI and a bearish candlestick pattern significantly reinforces the probability of a decline in Ether's price in the immediate future.
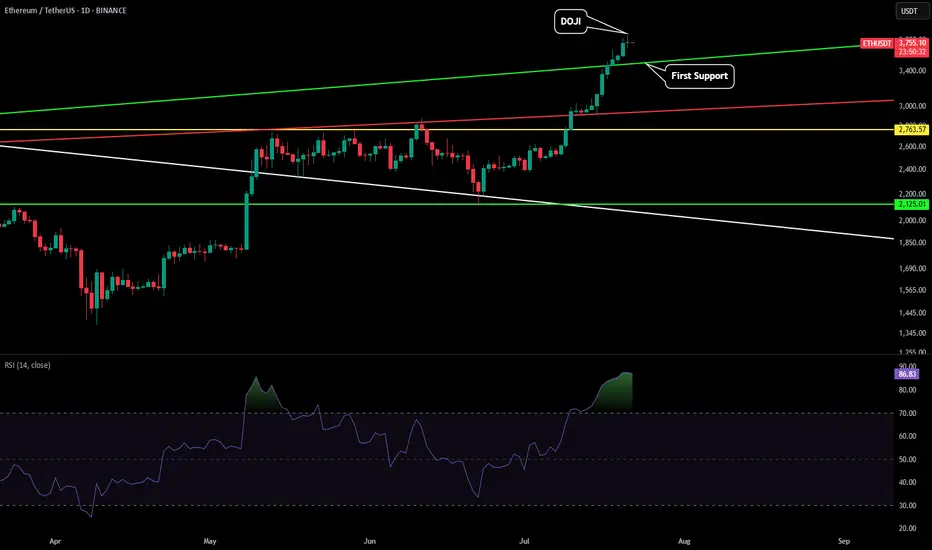
ETH - Pullback IncomingETH just printed a 1D doji reversal that could indicate a pullback should be expected. There is a lot of resistance between $3,800-$4,100 so a cooldown here would be nothing to worry about.
If we start seeing the price drop the first level of support we would want to watch is the green trendline. This could put price somewhere between $3,450-$3,530.
However if we see a wick down, or just start pumping back up creating a green daily candle following this reversal candle, that would signal this uptrend wants to climb to the $4k levels.
Be prepared for a pullback, but if we start seeing the momentum negate the reversal candle we will update this post.
Powell also speaks tomorrow so depending on what he has to say will most likely affect markets in a big way. Expect volatility.
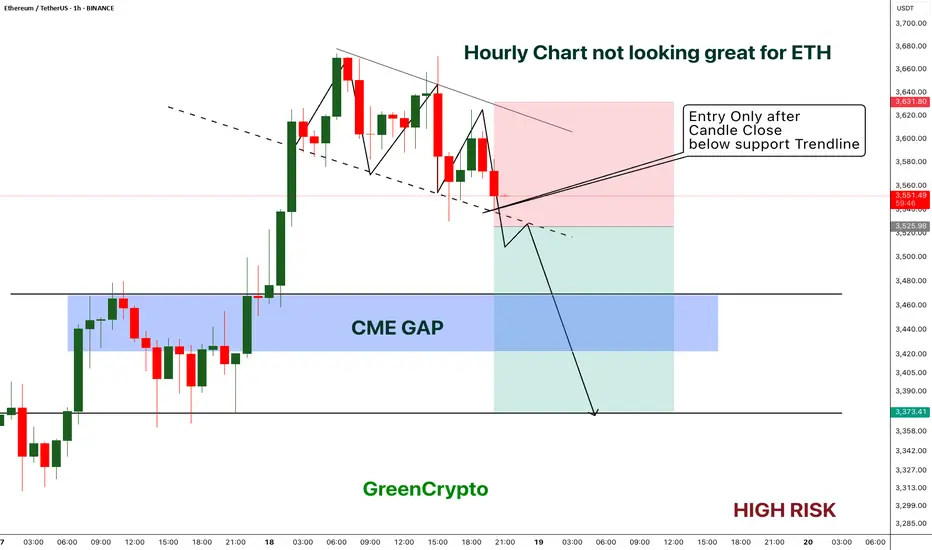
ETH - Short Trade with HIGH RISK- ETH got reject from resistance multiple times on 1H timeframe and now the price is playing near the support.
- I'm expecting overall market to cooldown this weekend, this could push the ETH to break the support
- ETH has CME gap around 3422 - 3467 range, im expecting this CME gap to be filled soon.
Entry Price: Below 3525
Stop Loss: 3631
TP1: 3471.15
TP2: 3381.76
Move SL to breakeven on TP1 hit.
Don't forget to keep stoploss.
Cheers
GreenCrypto
Ethereum (ETH): Too Good To Be True | We Are Close To $4000Ethereum is very close to the $4000 zone, which is both a psychological zone (thanks to it being a round number) and a major resistance zone for us currently.
What we see is simple: movement to that upper resistance zone where we expect to see some smaller rejection, eventually a breakout, and further movement to upper zones towards the new ATH.
Swallow Academy

Ethereum to 4k$CRYPTOCAP:ETH Bulls Target for 4,000$.
#Ethereum price surge 26.40% last week and closed above the daily resistance at $3,730 on Sunday. At the time of writing on Monday, it hovers at around $3,780$.
If ETH continues its upward trend and the daily level at $3,730 holds as support, it could extend the rally toward its next key psychological level at $4,000.

ETH - Realistic target $13799.6Taking this trade as its normally the first one to run in Alt Season, and although there is higher beta trades, this being a large cap should have smaller pullbacks.
Entry - 2879
Stop - 2111.6
Interval 1 - 3190
Interval 2 - 7405
Target - 13799.6

ETH Weekly Recap & Game Plan 20/07/2025📈 ETH Weekly Recap & Game Plan
🧠 Fundamentals & Sentiment
Market Context:
ETH continues its bullish momentum, driven by institutional demand and a supportive U.S. policy environment.
We captured strong profits by sticking to the plan (see chart below).
🔍 Technical Analysis
✅ Price has run into HTF liquidity at $3,750
📊 Daily RSI has entered the overbought zone, signaling potential short-term exhaustion.
We may see a brief retracement or LTF liquidity grabs, which could be enough to fuel a further push higher — potentially to $4,087.
🧭 Game Plan
I’m watching two key downside liquidity levels:
$3,534 (black line)
$3,464
A sweep of either could provide the liquidity needed for continuation toward $4,087.
⚠️ I’ll wait for LTF confirmation before entering a position.
📌 Follow for Weekly Recaps & Game Plans
If you find this analysis helpful, follow me for weekly ETH updates, smart money insights, and trade setups based on structure + liquidity.
