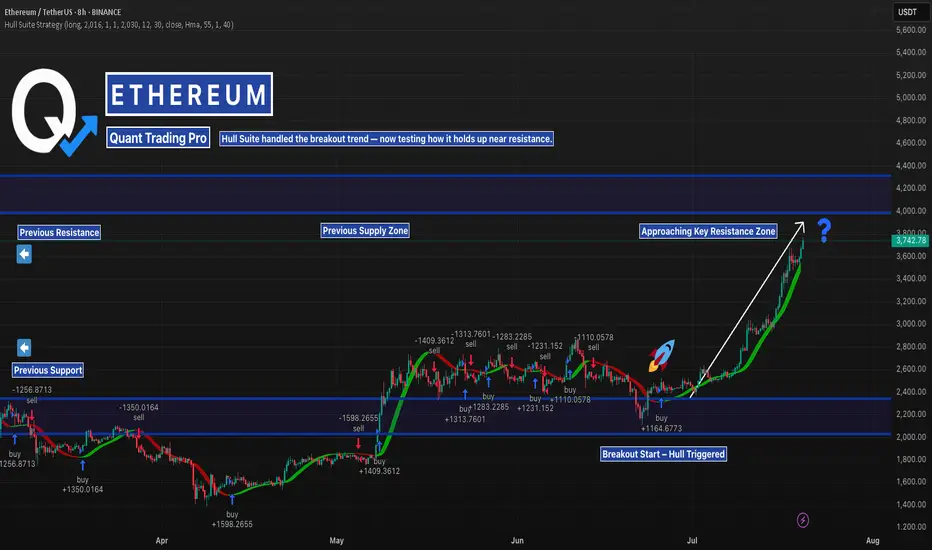
ETH in Liftoff Mode — But Resistance AheadEthereum has been trending hard — with the Hull Suite catching the breakout perfectly from the $2,200 base.
But now it’s flying straight into a key resistance zone that capped price earlier this year.
This is where many trend strategies get tested. Will Hull keep riding the wave — or will we start seeing signs of exhaustion?
📊 Watching closely how it reacts near the previous supply zone. These are the conditions where robust backtests matter most.
—
#ETHUSD #Ethereum #TrendAnalysis #HullSuite #BreakoutTrading #ResistanceZone #QuantTradingPro #TradingView #CryptoAnalysis
ETHUST trade ideas
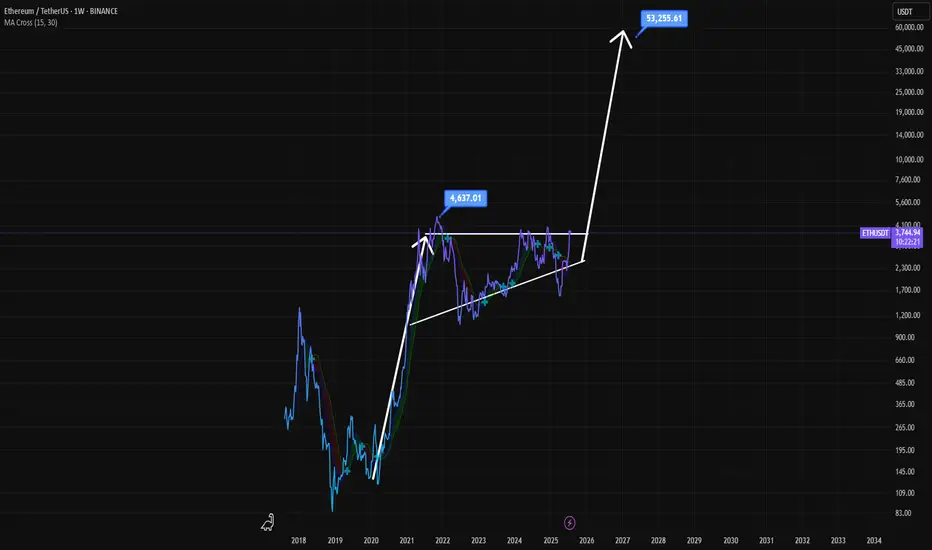
Ethereum's Path to $53,000: Multi-Year Breakout Pattern?This is a long-term technical analysis chart for the Ethereum/TetherUS (ETH/USDT) pair, presented on a weekly (1W) timeframe and using a logarithmic scale. The logarithmic scale is important as it visualizes percentage-based movements equally, which is crucial for analyzing an asset that has experienced exponential growth over many years.
Crucially, the date on the chart is "Jul 20, 2025," which is in the future. This indicates the chart is not just an analysis of past events but a speculative forecast of future price action.
Key Elements and Pattern Analysis
The chartist has identified and drawn a classic bullish continuation pattern known as an Ascending Triangle. Let's break down its components:
The Prior Uptrend (The "Flagpole"): Before the triangle formation, there was a massive upward price move starting in 2020 and peaking in late 2021. This powerful uptrend is the prerequisite for a bullish continuation pattern.
The Ascending Triangle Pattern: This is the multi-year consolidation phase that has been forming since the peak in late 2021.
Horizontal Resistance: The top of the triangle is a flat resistance line drawn at the previous all-time high, marked with a label at $4,637.01. The price has tested this level and failed to break through it, establishing it as a significant supply zone.
Ascending Support: The bottom of the triangle is a rising trendline. The price has made a series of "higher lows" since the market bottom in 2022. This indicates that despite pullbacks, buying pressure is consistently stepping in at higher price levels, showing underlying strength.
The Projected Breakout and Target: The core of this analysis is the prediction of what happens next.
Breakout: The chartist predicts that the price will continue to consolidate within this triangle until approximately late 2025 or early 2026. At that point, it is projected to break out decisively above the horizontal resistance.
Measured Move Target: The extremely bullish price target of $53,255.61 is calculated using a common technical analysis technique called a "measured move." The height of the triangle at its widest part (from the low around mid-2022 to the resistance line) is measured and then projected upward from the breakout point. This results in the highly ambitious target.
Interpretation and Narrative
The story this chart tells is as follows:
After its parabolic run in 2020-2021, Ethereum entered a necessary, long-term consolidation period.
During this multi-year phase, it has been building a massive base of support, with buyers absorbing selling pressure at progressively higher prices (the higher lows).
The chartist believes this long period of accumulation will eventually resolve to the upside, with a powerful breakout above the previous all-time high.
Such a breakout would signal the end of the consolidation and the beginning of a new major bull market cycle for Ethereum, with a projected target far exceeding the previous peak.
Important Caveats
Highly Speculative: This is a long-term forecast. Technical patterns are about probabilities, not certainties, and they can fail. The future date and extreme target price highlight the speculative nature of this analysis.
Pattern Invalidation: The entire bullish thesis is invalidated if the price breaks down below the ascending support trendline. Such a breakdown would be a significant bearish signal, suggesting a major trend reversal instead of a continuation.
External Factors: This technical analysis does not account for fundamental factors, macroeconomic shifts, regulatory changes, or other black swan events that could dramatically impact the price of Ethereum.
In summary, the chart presents a very bullish long-term outlook for Ethereum, based on the formation of a classic ascending triangle pattern. It forecasts a multi-year consolidation followed by a powerful breakout and a new, explosive bull run to over $50,000. However, this should be viewed as one possible scenario among many, with its own specific conditions for validation and invalidation.
Disclaimer: This is not a financial advise. This analysis is purely for informational purposes and should not be considered as investment advice. Trading involves risk, and you should consult with a financial professional before making any decisions.

Weekly ETH candle sitting on 3 lines of resistance.This weekly ETH God candle is fighting with 3 lines of resistance. The white is the 25% discount zone calculated from Ethereums lowest to the highest point. Ethereum is right now roughly 25% below it's ATH. Plus two FIB retracement lines. There are 12 more hours till the end of this week, and unless we see a candle close above the 25% resistance line and a new one open, we may see some retracement. It would also be warranted to see some profit taking on the recent hype over the weekend, particularly with talks of Wall Street making announcements of plans to palce massive ETHEREUM buy orders. I expect some downtime towards the start of the week followed by the continuation of the pump possibly Tuesday or Wednesday.

ETH Healthy Retest Before Next Rally!Ethereum continues to trade within a strong uptrend on the 1-hour chart, respecting the 100 EMA consistently throughout the rally. After a strong impulse move, the price is now consolidating near the recent highs.
ETH price could retest the 0.382 Fibonacci level and the 100 EMA before continuing upward. A successful retest would signal strength and could lead to a bullish continuation toward the $3900 - $4000 range.
Similar historical retests of the 100 EMA led to strong rallies, and we could see a repeat of that pattern if support holds.
Cheers
Hexa
BITSTAMP:ETHUSD CRYPTOCAP:ETH

ETHUSDT - Limited Return PriceEthereum is a reliable network for financial transfers and transactions and can be considered the second most popular digital currency after Bitcoin. Currently, this currency has reached the price range of $2,500 with temporary decreases, but this price is at its lowest level and the probability of liquidity entering this price area is very high. This price level can be used for long-term investment. I specify two targets for this price area: $4,000-5,000.
Sasha Charkhchian

Ethereum Price Hits 6-Month High, Up Next $4,000BINANCE:ETHUSDT has managed to navigate recent market volatility with significant support from investors. As companies increasingly mirror Bitcoin’s corporate treasury use case, Ethereum is gaining traction.
BINANCE:ETHUSDT price surged 26% over the past week , reaching $3,715 and marking a 6-month high. The rally strengthened after ETH formed a Golden Cross last week. With this bullish momentum, Ethereum is now targeting $4,000 in the coming days, benefiting from investor confidence and growing institutional interest.
However, if BINANCE:ETHUSDT bullish momentum weakens and investors opt to sell, the price could decline to $3,131 . This would erase recent gains and invalidate the current bullish outlook.
ETHUSDTThis movement downtrend. If breake 2.790 movr to 3.500$ but breke 2.200 move trend to 1.500$.

ETH - Ranges overview (update) We've had some nice movements on ETH lately so let's have a look at where we are.
As previously discussed IF we reclaimed 2.5K we should expect the market to aggressively trade towards the HTF buyside (3.4K and 4K).
The buyside at 3.4K has been traded through already so no let's be PATIENT and see IF we get through 4K and higher.
As always WAIT FOR THE MARKET TO SHOW YOU ITS HAND.
Stay safe and never risk more than 1-5% of your capital per trade. The following analysis is merely a price action based analysis and does not constitute financial advice in any form.
ETH | USDWe should monitor the megaphone formation. There's a strong possibility of a move to the targets identified by the breakout. Below, the green line and the megaphone's lower band I identified are excellent entry levels.

Ethereum · No Reason To Stop · Will Continue RisingEthereum will continue rising. Remember Ether is number two and it is awesome, to start, and it follows Bitcoin like darkness follows the light. There is no reason for Ether to move down. There is no necessity for ETH to stop its major advance, in fact, it has been lagging behind and it needs to catch up. Bitcoin is waiting and will continue waiting but it won't wait forever so Ethereum must wake up and is waking up. We are going up.
Ethereum has grown 165% since its 7-April low. This is more than XRP and its capital is twice as much. Boom! The best part? Ethereum will continue growing straight up for weeks and months. It needs to be trading at a new all-time high as soon as possible just so that the market can feel at ease and know, once again, that Crypto is here to stay.
What has been suppressed can't stay suppressed forever. Crypto went through a fight but challenges only made us that much stronger. We are now happy and grateful for everything that we went through because we know that we can take anything the world throws at us.
The chart. Green, green, green straight up. Two months of consolidation. That's the key. ETHUSDT went sideways for almost two months and this reveals what comes next. The advance outside the consolidation range has been happening for 8 days. 60 days of sideways can support at least an entire month of growth. When the entire month is consumed, we can expect a retrace, nothing more, followed by additional growth.
In short, Ethereum will continue rising. If you see a shakeout, know that growth will always resume in a matter of days. If you see a drop, know that this is a bear-trap, the bulls now own the game. If you are in doubt, come read my articles and I will publish something that you will understand and agree is right, so you can continue holding until you can reach the big prize.
The time to sell will come, but it isn't now. Right now is the time to hold strong. Not only Ethereum, but Cardano, XRP, BTC, Dogecoin, Solana and the rest of the altcoins. This is only the start.
I expect Ether will continue rising. $8,000 now looks like such an easy target...
Very good indeed. If you enjoy the content, follow me.
Namaste.

ETH/USDT 30m Signal📉 ETH/USDT 30m Signal
Pair: ETH/USDT
Timeframe: 30-minute
Trade: SELL
📍
📊 Level
Pips
R:R
💵 Entry
3,610 USDT
🚫 Stop-Loss
3,650 USDT
🎯 Target 1
3,570 USDT
1:1
🎯 Target 2
3,530 USDT
2:1
🎯 Target 3
3,490 USDT
3:1

Is Ethereum Ready to Break Out? Watch This Key Trendline!Is Ethereum Ready to Break Out? Watch This Key Trendline!
In the 15-minute timeframe, Ethereum (ETHUSDT) is testing a major descending trendline. If a strong bullish candle closes above this level and price action holds, we could see a move toward the $3,637 resistance zone.
This area has acted as a significant technical level in the past, and a confirmed breakout may trigger further upside momentum.
🚀 A successful breakout could provide a solid long entry setup, with $3,637 as the first target. Keep a close eye on this move—momentum is building.
💡 Don’t miss more high-probability setups like this! Follow for real-time crypto analysis and trade ideas.

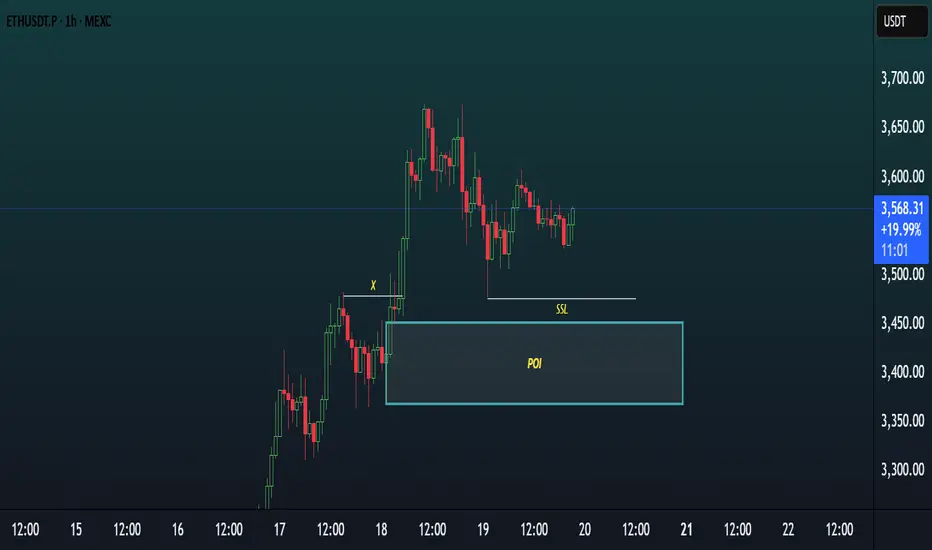
Chart Analysis (ETHUSDT, 1H)This chart showcases a Smart Money Concepts (SMC) style analysis on the 1-hour timeframe of ETHUSDT.P, focusing on a potential bullish setup.
Key Elements:
POI (Point of Interest)
A demand zone is clearly marked around the $3,400–$3,460 area, highlighted as a potential reversal zone where price may react bullishly.
SSL (Sell-Side Liquidity)
Sell-side liquidity has been swept below a recent low, indicating a possible liquidity grab before a reversal.
X (Previous Break of Structure)
Point “X” marks a significant BOS (Break of Structure) indicating bullish intent in prior price action.
Current Price Action
Price recently tapped into the POI, swept SSL, and is now consolidating slightly above the zone — suggesting accumulation or preparation for a bullish move.
Bias:
Bullish — Expecting a possible reversal or continuation to the upside after liquidity sweep and POI mitigation.
Ethereum Hits Golden Pocket Resistance — Rejection or Breakout?Ethereum (ETH) is facing a pivotal moment as it trades directly into the Golden Pocket — a Fibonacci zone widely recognized for its strong influence on price behavior. As ETH reaches this resistance, traders are watching closely to determine whether a rejection will lead to a bullish retest at lower levels, or if a breakout will confirm continuation toward much higher targets. The next few days will be key in defining the near-term trend.
- Golden Pocket Resistance: Ethereum is trading at the 0.618–0.65 Fibonacci retracement zone, a historically reactive level.
- Bullish Retest Zone at $2,800: A rejection could lead to a healthy high-low formation at this support.
- Upside Target at $3,600: A breakout above the Golden Pocket would likely accelerate the move toward this high-time frame resistance.
Ethereum’s current price action has entered a region of significant resistance: the Golden Pocket, which lies between the 0.618 and 0.65 Fibonacci retracement levels. This zone often acts as a strong inflection point, either halting price momentum temporarily or confirming a breakout with strong follow-through.
Should Ethereum face rejection from this zone, price could rotate back down to the $2,800 region, which now aligns with a key support structure and potential bullish retest zone. This would allow for a higher low formation, reinforcing the uptrend and setting the stage for a long opportunity targeting previous highs.
So far, no rejection has occurred, but if it does, it will likely be seen as a buy-the-dip opportunity for traders aiming to re-enter the trend. This would also mark a textbook retracement within a bullish market structure.
Alternatively, if Ethereum breaks above the Golden Pocket without rejection and consolidates above it, this would be a strong bullish confirmation. In that scenario, the next likely destination is the $3,600 high-time frame resistance, a key level that has previously acted as a major barrier.
Volume and candle structure over the next few sessions will offer key signals — a strong impulse with follow-through would favor the breakout scenario, while weak closes and rejection wicks would support the retracement idea.
Ethereum is at a make-or-break level. A rejection from the Golden Pocket could lead to a healthy correction toward $2,800, offering a long setup. However, if ETH breaks through this resistance with strength, a rally toward $3,600 becomes the high-probability scenario. The next move will likely define Ethereum’s short-term trend.
ETH SCALP SHORT RR 3:1 Ethereum just hit weekly level with two 15min lower high and lower low. Rules are telling us to not short against trend, but there can be hedge for long positions.
I don't ask to trade more then 0.5 % capital per trade.

Altseason Starts Here? ETH Hits Critical Resistance!Ethereum has finally reached the upper resistance zone — and this could be the decisive moment for Altseason.
This level has historically acted as a major turning point for ETH. If it breaks and holds above this zone, we could see capital start flowing aggressively into altcoins.
🧠 Why it matters:
ETH reaching resistance usually signals a rotation phase from BTC to ETH.
If ETH breaks above, altcoins tend to follow with explosive momentum.
If it gets rejected, we may see a short-term cool-off.
This is the zone where narratives shift. Eyes on the breakout — or the rejection.

ETHUSDTPossible short on ETH, as we know this might be a news dump that caused this blood in the market and might recover very soon, but we broke a key support level, this is the 4HR chart and we will have a better idea what's on the table when weekly close.

Ethereum will fix above the $2450 ┆ HolderStatBINANCE:ETHUSDT is stabilizing above $3,450 after a strong parabolic move. A minor dip beneath local lows is possible, but the structure remains bullish. If the level holds, expect continuation toward $4,200 as momentum builds.
Range again $ETHDue to typical ETH behavior we can form a range
Can be identified without any lines where I suppose will stay for a month or so consolidating

A look at a CPR strategy using monthly CPRA look at a CPR strategy using monthly CPR - Using conditions to enter and move SL

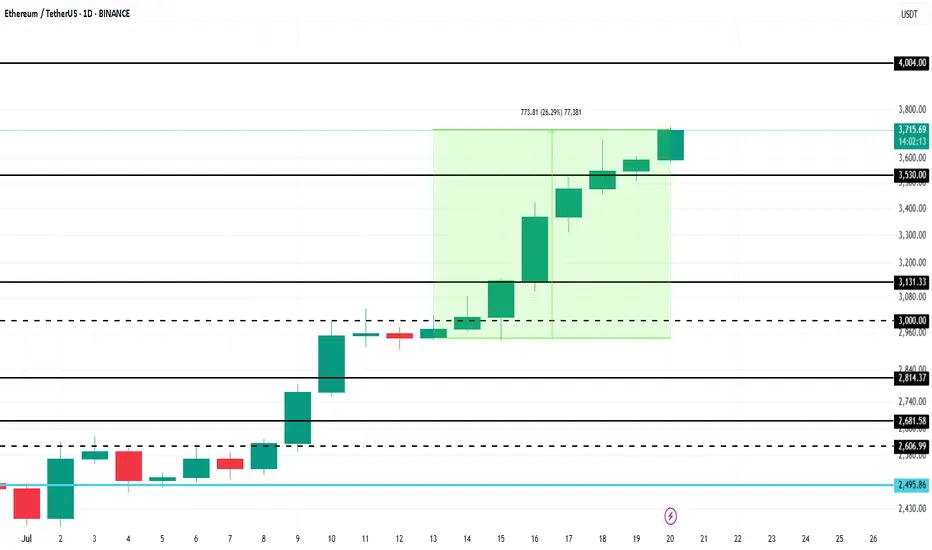
Ethereum Price to Reach $4,000, but Market Top Suggests DelayBINANCE:ETHUSDT current price stands at $3,872, holding above its local support level of $3,742. While ETH is approaching the $4,000 mark , it has not yet managed to breach it. This resistance could continue to hold, limiting Ethereum's immediate potential for further gains.
Currently, 96% of BINANCE:ETHUSDT total supply is in profit. Historically, when the profitable supply surpasses 95%, it signals a market top . This has been followed by price corrections as investors begin to secure profits.
If the market top triggers a reversal, BINANCE:ETHUSDT price could drop to $3,530 or lower . A sharp decline to $3,131 is also a possibility, erasing much of the recent gains made in the past month.
On the other hand, if the influx of new addresses continues and strengthens, BINANCE:ETHUSDT may finally break through the $4,000 resistance. Should this happen, ETH could rise towards $4,425, with a renewed surge in price. This would invalidate the bearish thesis and push Ethereum into a new bullish phase.
