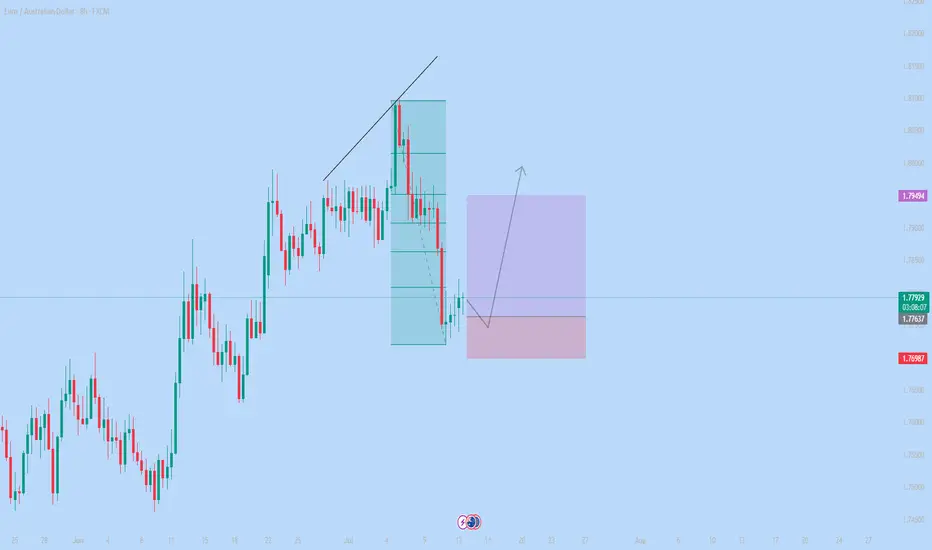
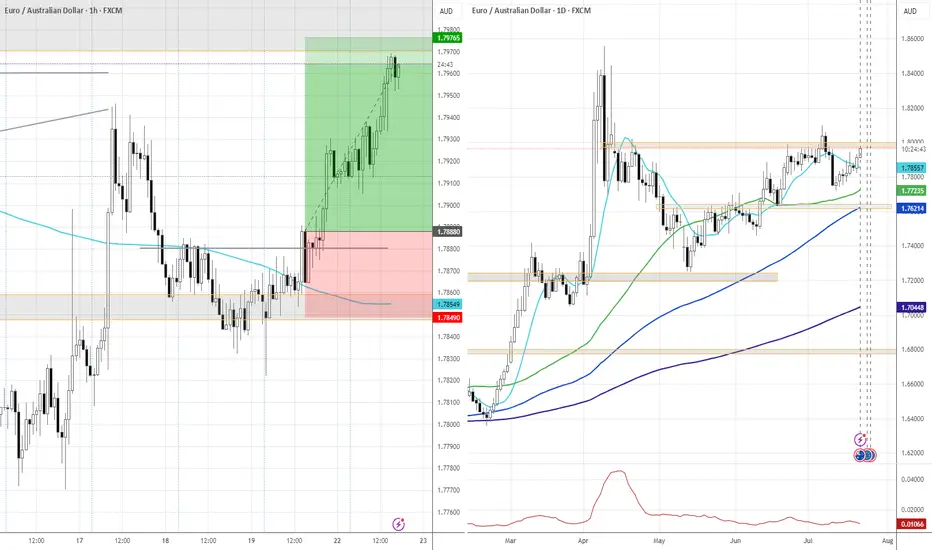
EURAUD Rebound From 1.77200 is High ProbabilityEURAUD has reached a key support zone near 1.77200, aligning with the ongoing bullish global trend. The current price action appears to be a correction phase, particularly influenced by short-term weakness in the Euro.
According to technical chart conditions, this correction is likely nearing completion. If the 1.77200 support holds, it could serve as a strong buy entry point, then upside target will be 1.79000 and 1.80020
You can see more details in the chart.
if you like this idea if you have on Opinion about this analysis share in comments
EURAUD trade ideas

#009: EUR/AUD Long Investment Opportunity
We placed a buy limit order at 1,776, waiting for a bearish spike that would allow us to enter alongside the institutions, not against them.
Why this entry?
🔻 We're waiting for a false breakout at 1,776, a key level where big players are accumulating liquidity with technical stop hunts.
🔐 The SL is below the levels where banking systems have protective orders for the future.
📊 Retailers are still heavily short and aren't exiting, confirming that the upside movement hasn't started yet.
📈 Open interest shows anticipation of an imminent breakout, with progressive loading by large players.
⏳ We're staying out now to avoid being victims of the retracement, but ready to enter on the institutional bearish spike.
A violent expansion toward 1.79, with a directional candlestick that will start as soon as the retail cleanup below 1.776 is completed.
The trade has all the hallmarks of a perfect institutional entry: early positioning, patience, and a defensive stop.
EURUAD Buy!!EURAUD buy opportunity ... bounce from a strong support area and now it is time to buy the pair . risk 1:2.5 rewards and do not risk more than 1% per the trade.

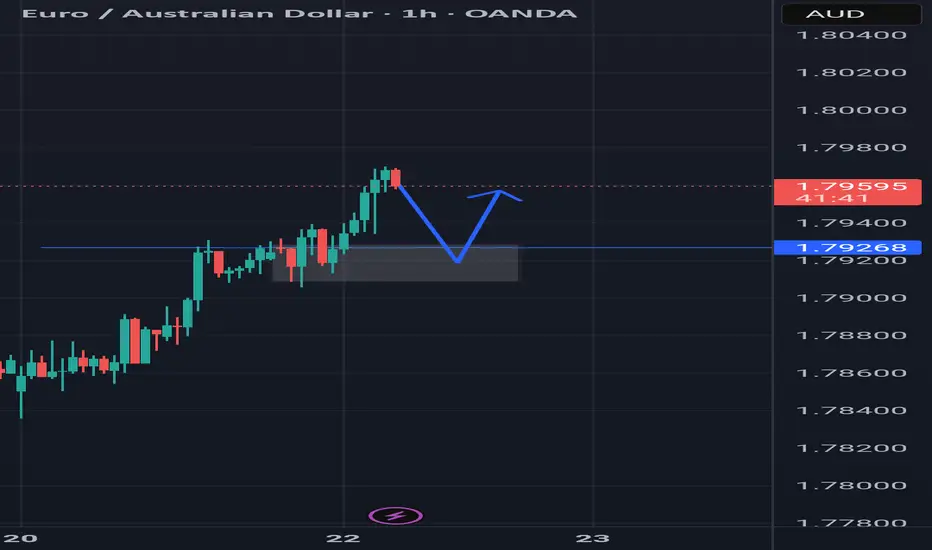
Sell EURAUDEURAUD presenting an opportunity to load up shorts before Asia Session. A bearish flag is on display, indicating a possible downward move in the next hours. 1,77555 will be the final target.

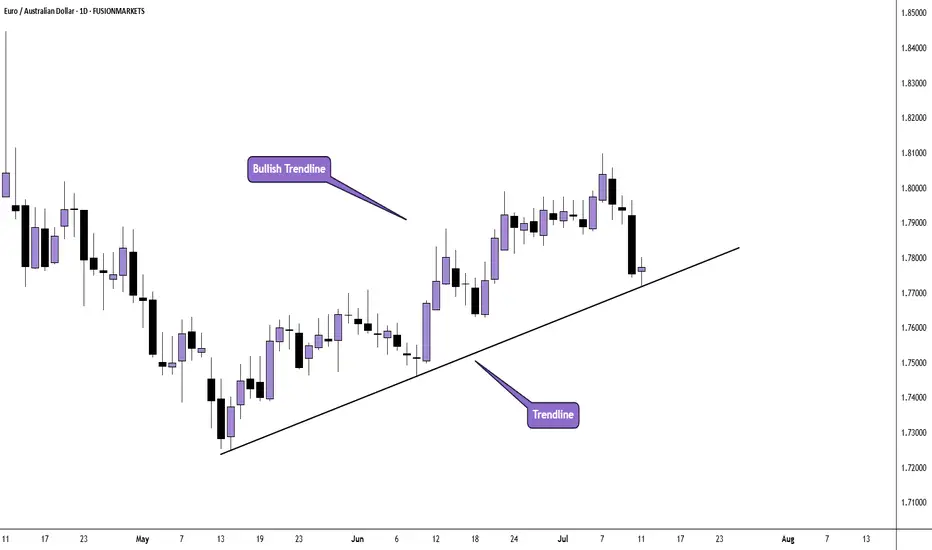
EURAUD at Trendline support EURAUD is Trading in Channel pattern and looks like the price has rebound form the recent trendline support and is likely to go up.
EURAUD LONG 16-7-2025trend : bearish
divergence : buliish
continuation : start hh & hl
reversal : na
harmonics : n/a
indices : long

EURUSD Trade SetupEURUSD Trade Setup – Bearish Bias 📉
After a clear CHoCH, price retraced into a Fair Value Gap (FVG), showing signs of rejection. Market structure is shifting, and we anticipate a continuation lower toward the next demand zones.
This is a great example of SMC concepts aligning:
- CHoCH confirms the trend reversal
- FVG provides an entry opportunity
- Bearish momentum is building
Bias: Bearish
Plan: Monitor price action around FVG for confirmation of continuation.
"Let the structure guide your bias. Follow the flow." 🔥📊

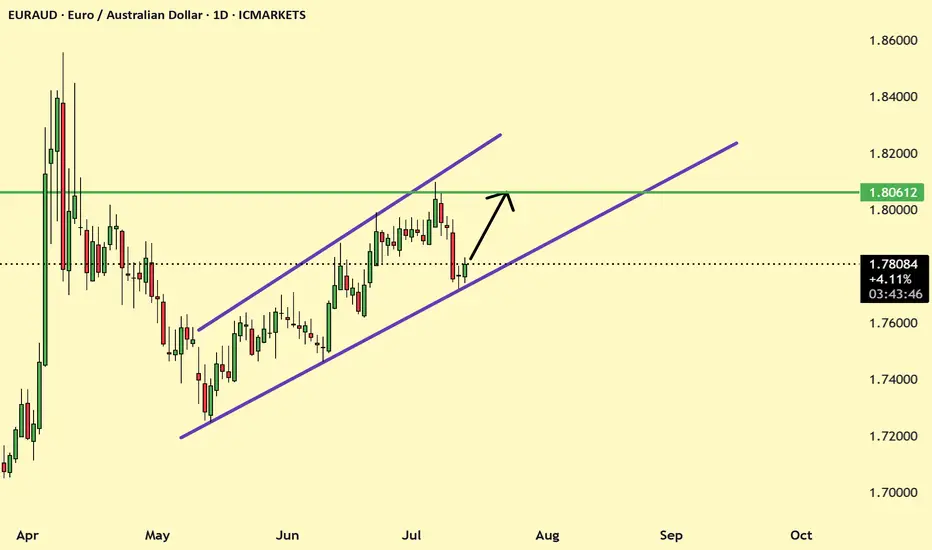
EUR/AUD Daily AnalysisWith price in a bullish trend and printing a Doji candle at the trendline, we may now see buyers step back into the market once again.
If you agree with this analysis, look for a trade setup that meets your strategy rules.
EUR_AUD WILL GO UP|LONG|
✅EUR_AUD is trading in an uptrend
And the bullish bias is confirmed
By the rebound we are seeing
After the pair retested the support
So I think the growth will continue
LONG🚀
✅Like and subscribe to never miss a new idea!✅
Disclosure: I am part of Trade Nation's Influencer program and receive a monthly fee for using their TradingView charts in my analysis.

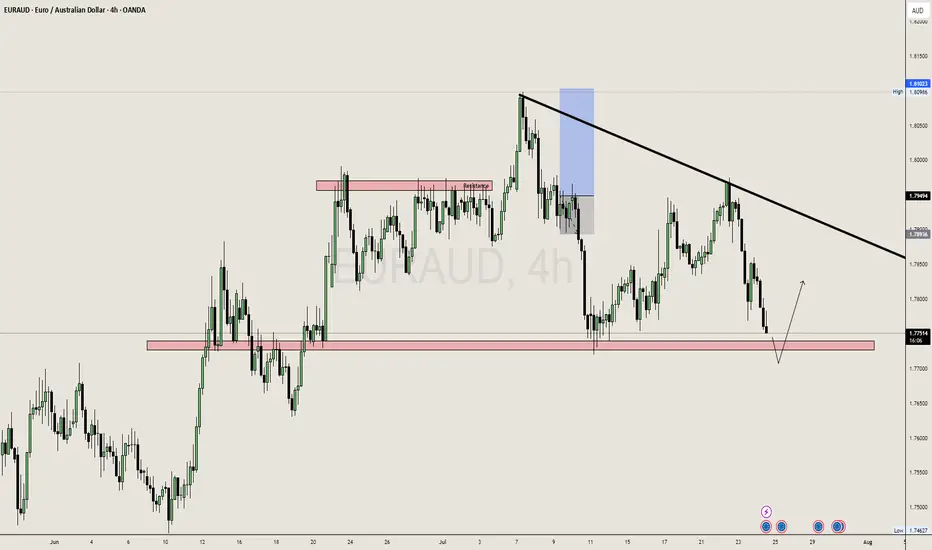
EURAUD Weekly Trade Setup(14 to 18th July 2025) - Head&ShoulderThis week, EURAUD (Euro/Australian Dollar) has entered a critical price zone, providing a textbook technical opportunity for traders. A clear Head & Shoulders pattern has formed on the 4-hour chart, pointing toward a potential trend reversal from bullish to bearish.
Let’s explore how to trade this intelligently from both bullish and bearish perspectives.
1. Bearish Setup – Head & Shoulders Pattern Breakdown
This is the primary trade idea for the week.
✅ Trade Logic:
Price has completed a classic Left Shoulder → Head → Right Shoulder formation.
The neckline (support) will be tested.
The current price is will pulling back to retest the right shoulder resistance zone, offering an ideal short opportunity.
🔻 Entry Plan:
Wait for bearish reversal confirmation (candlestick rejection or bearish engulfing) on the 1H or 4H timeframe.
Enter short once confirmation appears near 1.7850–1.7900.
📉 Stop Loss:
Place SL above the right shoulder high, adjusting for volatility and swing high (around 1.7950).
🎯 Targets:
Target zone: 1.7450–1.7500 (profit booking zone marked on the chart)
Potential Risk/Reward Ratio: 1:2, 1:3, or even 1:4+
2. Alternative Bullish Setup – Reversal at Neckline (High Risk)
This setup is for experienced or aggressive traders who spot early reversals.
✅ Trade Logic:
Price may bounce from the neckline and 200 EMA support area.
If this happens, a temporary bullish reversal may push price back toward the right shoulder zone.
🔺 Entry Plan:
Wait for bullish confirmation (reversal candle) near the neckline and EMA support (around 1.7700).
🚨 Stop Loss:
SL must be below the neckline swing low (around 1.7650).
🎯 Targets:
Resistance zone (right shoulder): 1.7850–1.7900
R:R setups of 1:2 or 1:3 possible
⚠️ This is considered a counter-trend trade and should be traded with caution.
3. Technical Confluence and Indicators
Pattern: Head & Shoulders (bearish reversal)
EMA 200: Price reacting around the long-term trend line
Support/Resistance: Cleanly defined horizontal zones
Reversal zones: Highlighted in red (supply) and green (demand)
4. Final Thoughts
This week’s EURAUD setup is a strong example of structure-based trading. With a well-formed head and shoulders pattern and a clean neckline break, the market signals a shift in momentum.
Safe Approach: Trade the short side after resistance rejection.
Risky Approach: Try a long on neckline bounce with tight SL.
Always confirm with your system and maintain strict risk management. Trade what you see, not what you feel.
Ready to trade? Save this setup, monitor price action, and execute only with confirmation.
=================================================================
Disclosure: I am part of Trade Nation's Influencer program and receive a monthly fee for using their TradingView charts in my analysis.
=================================================================

EUR-AUD Bullish Bias! Buy!
Hello,Traders!
EUR-AUD went down but
A strong horizontal support
Level is below around 1.7690
And as the pair is trading in
An uptrend we will be expecting
A round and a move up
On Monday!
Buy!
Comment and subscribe to help us grow!
Check out other forecasts below too!
Disclosure: I am part of Trade Nation's Influencer program and receive a monthly fee for using their TradingView charts in my analysis.

EURAUD Approaching SupportWe can expect a buy side move from the support till the trend line.
EA is Sideways in Daily we can plan the buy till the resistance zone/ trend line.
Euraud buy now Euraud has bounced off major support zones and has now broken structure resistance so I will be buying at 1.78600 and take profit at 1.79724 a 0.63% rise makes good profit on cfd also

EURAUD D1 CRTPair: EURAUD
TF: D1 - H1
I used Candle Range Theory to this trade idea, first of all we already have Candle Range, then Swept (Turtle Soup), came with Market Structure Shift, Fair Value Gap and Order Block. So I will place order limit at OB and FVG.
TAYOR
-Nxfi ICT

EURAUD Long TradeOANDA:EURAUD Long trade, with my back testing of this strategy, it hits multiple possible take profits, manage your position accordingly.
TP-1 is high probability.
This is good trade, don't overload your risk like greedy, be disciplined trader, this is good trade.
Use proper risk management
Looks like good trade.
Lets monitor.
Use proper risk management.
Disclaimer: only idea, not advice


EURAUD~+ RBA is dovish
~+ Recent AU weak labor data
~+ The euro has been in the role of a safe haven recently
EurAud buy setupSnrc1 setup align with htf trend
When market reach this zone try to find ltf entry 5m 15m
Trade Uni Long EURAUDKeep it simple, go long in trend on bullish momentum shifts. Learning structure and applying it correctly will help advance your trading career.

euraud long ideaBuying from fresh demand zone after bullish structure break.
Daily showing strong momentum, 1H confirms continuation with clean break and retest zone.
📍Entry: Demand zone
🎯 Target: 2R
🛑 SL: Below demand zone
Risk-Reward: Favorable setup aligning with higher timeframe bias.
euraud long tradein my opinion this is a good trade with a good r/r
hope hit the tp
consider this is my trade not your trade and i just like to share my trades with world

Euraud buy buy buy nowEuro is in a clear uptrend with ozzie dollar and pulled back just about enough now, we are now back in buy territory, broke through pivot point pulled back to pivot point showing nice spi,eon support zone now at 1.78598 zone buy here tp at 1.79538

EURNZDThis is a chart of EURNZD on the 4H timeframe. Here's what it shows and what you can post:
Analysis:
- CHoCH (Change of Character) shows a shift from bullish to bearish structure.
- Price retested the supply zone after CHoCH.
- Now it's reacting downwards from that area.
- Two Take Profit zones (TP1 and TP2) are clearly marked as price targets.
What to do:
- Look for sell entries below the retest zone.
- Set your targets at TP1 and TP2.
- Confirm with lower timeframe structure or candlestick patterns before entering.
