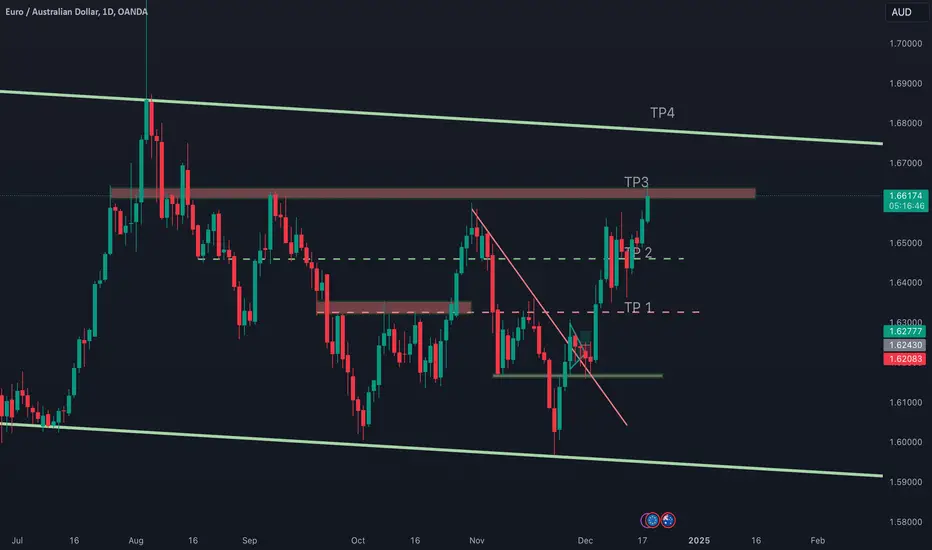
EURAUD | Big Resistance Zone EURAUD is heading in this big resistance zone. Since last year price has been rejected up to 5 times.
Last 5 weeks I was looking for long positions but will be looking for a shift of the trend.
Let me know what you think!
EURAUD trade ideas

euraudThe 4 TP zone that I gave for the channel that it made for Euraud before has also been reached. The channel is currently in the resistance zone for the flag formation it created. The main target zone for the long position that will be opened after the breakout is the 1.95-2.00 zone.

euraud tp4??I have previously shared 3 TPs for the Euraud parity, we have reached all 3 targets. I hope you have evaluated it. Next is our 4th TP region, if it reaches this level, we will expect a breakout.

EURAUDEURAUD WILL CONTINUE its upswing based on technical information ,but on fundamental the structure can change.

EURAUDTHE euraud call on ascending trendline was a complete analysis,we could be seeing some rejection at the supply roof on 4hrs

EUR/AUD - Short term weak high sell offHi guys, we are looking into the EUR/AUD - short term potential sell from here, we can see how we reached a strong resistance line which is being rejected.
Entry: 1.66920
Target : 1.6645
Stop: 1.67150
2:1 RR
As always my friends happy trading!
P.S. If you have questions or inquiries about one of my existing set-ups or personal questions / 1 on 1 sessions consider joining my channel so you can follow up with me in private!

EURAUD analysis elliot. Don't forget about stop-loss.
Write in the comments all your questions and instruments analysis of which you want to see.
Friends, push the like button, write a comment, and share with your mates - that would be the best THANK YOU.
P.S. I personally will open entry if the price will show it according to my strategy.
Always make your analysis before a trade

Illiquid Assets: Comprehensive Overview, Risks, and ExamplesIlliquid Assets: Comprehensive Overview, Risks, and Examples
Illiquid assets are those that don’t trade easily, often requiring more time and strategy to buy or sell effectively. Understanding these assets' unique characteristics and risks is crucial for traders who want to navigate their complexities. This article explores what makes an asset illiquid, the risks involved, and essential considerations for trading it.
What Are Illiquid Assets?
The illiquid asset definition refers to an asset that isn’t easily converted to cash. In turn, illiquid assets are those that aren’t easy to buy or sell without achieving a less-than-fair market price. They are the opposite of liquid assets, such as many stocks or government bonds, which can be traded with minimal impact on their value. Illiquid assets typically have fewer buyers and sellers, leading to less frequent trades, slower transactions, and more price variability.
Outside of the markets most traders regularly interact with, illiquid investments might include things like private equity, real estate, or certain collectibles, where valuation and demand can be uncertain. However, in financial markets, certain stocks, currency pairs, cryptocurrencies*, and commodities can also be considered illiquid.
For traders, this lack of liquidity means a trade can be harder to execute at the desired price, sometimes resulting in higher transaction costs or delays in getting out of a position. Illiquidity is particularly relevant in times of market stress when demand can dry up entirely, leaving traders holding assets they can’t easily convert to cash. The appeal of illiquid assets often lies in their potential to offer returns over time, but they come with the trade-off of being more challenging to manage in a fast-moving market.
Characteristics of Illiquid Assets
When comparing liquid vs illiquid assets, there are a few distinct traits that set them apart. These characteristics are worth understanding, as they directly impact how traders approach these assets.
Low Transaction Volume
One major feature of illiquid assets is limited trading activity. Unlike stocks that see hundreds or thousands of daily trades, illiquid assets might only attract occasional buyers and sellers. This low volume makes it harder to find a counterparty when you want to buy or sell, leading to longer wait times and potentially bigger price fluctuations than with more frequently traded assets.
Valuation Challenges
Determining the exact market value of illiquid assets can be tricky. Limited market activity can translate to a lack of up-to-date price data when a market is illiquid, meaning it might be challenging to set an accurate price. To use an extreme example, in real estate or private equity, values might depend on periodic appraisals rather than constant, real-time trading data. This uncertainty can make it harder for traders to calculate potential returns or evaluate risk effectively.
Limited Market Interest
Illiquid assets generally attract a smaller, more niche group of investors or traders. They may be specific to certain industries, geographic locations, or specialised interests, which limits their appeal. This restricted interest reduces demand, further contributing to their illiquidity.
Illiquid Assets: Examples
In most trading markets, illiquidity isn’t the norm, but it does occur in specific cases. Illiquid assets in trading tend to arise in less popular stocks, certain currency pairs, niche cryptocurrencies*, and specific commodities.
Lesser-Known or Thinly Traded Stocks
While major stocks in popular indices enjoy high liquidity, smaller or less-known stocks often don’t. These might be stocks of companies in emerging sectors or regions, with limited investor interest and low daily trading volume. When trading these stocks, a limited number of buyers and sellers can make transactions sluggish and cause price swings. Traders need to be cautious, as buying or selling large quantities can quickly impact prices.
Exotic Currency Pairs
In forex markets, major currency pairs like EUR/USD or USD/JPY are highly liquid. But when you move to exotic pairs—often involving currencies from smaller or emerging economies—liquidity dries up. These pairs see fewer trades, meaning bigger spreads and potential slippage. For traders, it can be harder to execute trades at ideal prices, and sudden market events can cause sharper price moves due to limited liquidity.
Explore real-time charts for various currency pairs, from major to exotic, in FXOpen’s free TickTrader platform.
Niche Cryptocurrencies*
Cryptocurrencies* offer another example. While major coins like Bitcoin and Ethereum are liquid, lesser-known altcoins often suffer from low trading volume. These niche coins may appeal to traders looking for high potential returns, but limited buyer interest can lead to volatile price swings and long waits to complete trades. Traders should account for the possibility of holding such assets longer than expected if market demand drops.
Specialty Commodities
Major commodities like crude oil, gold, and natural gas are generally liquid, but niche commodities can be far less so. For instance, specific metals or agricultural products may have fewer buyers and sellers, leading to greater price instability and higher transaction costs. In these markets, illiquidity can make it challenging to find counterparty interest, especially when market conditions shift.
Risks Associated with Illiquid Assets in Trading
Illiquid assets come with unique risks that can complicate trading strategies and impact potential returns. These risks are essential to understand, as they can significantly affect both short- and long-term outcomes.
Price Volatility
With fewer market participants and less frequent trading, illiquid assets are prone to greater price volatility. Even small trades can lead to significant price swings, as a limited number of buyers and sellers creates a more sensitive market. For traders, this volatility can mean unexpected price shifts.
Exit Challenges
Selling an illiquid asset can be far from straightforward. When there’s limited interest from buyers, exiting a position may take longer or require a price concession to attract potential buyers. This delay or the need to sell at a lower price can impact overall returns, especially in cases where funds need to be freed up quickly.
For traders, this creates a challenge: they may need to hold positions longer than anticipated, which could conflict with other trading opportunities or cash flow requirements.
Slippage Risks
Slippage—when there’s a difference between the expected price of a trade and the price at which it’s actually executed—can be especially pronounced with illiquid assets. This occurs because prices are more likely to move between the initiation of a trade and its completion in markets with limited participants.
For instance, if a trader tries to execute a larger-than-usual order in a low-volume stock, they might face a sharp price increase or decrease as their order shifts the market, leading to a less favourable outcome than planned.
Higher Transaction Costs
In illiquid markets, transaction costs tend to be higher, as brokers and exchanges factor in the risk of dealing with less popular assets. This can result in wider bid-ask spreads, where the gap between the buying and selling price becomes more significant, increasing trading costs.
For traders, higher transaction costs can impact profit margins, making it essential to weigh these added expenses when dealing with illiquid assets.
Capital Lock-In
Illiquid assets can also result in capital being locked up for an extended period. If market interest wanes or demand plummets, selling may be impossible without a considerable discount. This “lock-in” risk can create challenges for traders who may need to access funds or reallocate capital elsewhere.
For traders with capital tied up in illiquid assets, unforeseen market conditions or shifts in trading strategies can pose significant financial strain.
Practical Considerations for Traders
When trading illiquid assets, a few specific strategies may help manage the unique risks and challenges.
Liquidity Analysis
Evaluating an asset’s liquidity is essential. Traders may consider metrics such as average daily trading volume, bid-ask spreads, and historical transaction frequency. These indicators give insights into how challenging it might be to execute trades without major price impacts.
Timing and Market Conditions
Timing becomes especially critical with illiquid assets. Market conditions, such as economic stability or demand in specific sectors, can influence the limited buyer and seller pool. Monitoring broader trends helps traders anticipate demand shifts that could affect transaction possibilities or asset valuations.
Portfolio Diversification
Balancing illiquid assets with more liquid investments in a portfolio can potentially reduce overall risk. Diversifying investments across various asset classes allows traders to maintain greater flexibility. This approach helps ensure that funds aren’t overly tied up in assets that may require extended holding periods.
Position Sizing
Larger positions in illiquid assets can magnify challenges. Adjusting position sizes based on liquidity can potentially mitigate risks and improve a trader’s ability to exit positions without large price impacts.
The Bottom Line
In summary, illiquid assets present unique opportunities and challenges, requiring careful planning and strategy from traders. Understanding their characteristics, risks, and practical considerations is essential to navigate these markets effectively. For those interested in exploring a wide range of markets with competitive costs, consider opening an FXOpen account.
FAQ
What Is the Meaning of Illiquidity?
The illiquidity meaning refers to the challenge of quickly buying or selling an asset without causing a significant impact on its price. Illiquid assets generally have fewer buyers and sellers, low trading volumes, and infrequent transactions, making them challenging to convert to cash quickly at fair value.
What Is an Example of an Illiquid Currency?
An illiquid currency is typically one that belongs to an emerging or small economy, like the Tanzanian shilling or Icelandic króna. These currencies see limited trading in the global forex market, have fewer buyers and sellers, and often come with higher transaction costs and wider bid-ask spreads.
What Is the Illiquidity Risk?
Illiquidity risk is the potential difficulty in buying or selling an asset at its expected value due to limited market interest. This risk can lead to delays, lower exit prices, or forced long holding periods, affecting overall returns for traders.
What Is the Equity Liquidity Risk?
Equity liquidity risk is the chance that a stock cannot be sold or bought quickly without impacting its price. This risk is more common in thinly traded or small-cap stocks, where limited market activity makes finding buyers or sellers challenging.
What Is the Difference Between Liquid and Illiquid Assets?
Liquid assets can be bought or sold quickly with minimal impact on their price, such as stocks in major companies. Illiquid assets, however, trade infrequently, making fast transactions difficult without price concessions.
*At FXOpen UK, Cryptocurrency CFDs are only available for trading by those clients categorised as Professional clients under FCA Rules. They are not available for trading by Retail clients.
This article represents the opinion of the Companies operating under the FXOpen brand only. It is not to be construed as an offer, solicitation, or recommendation with respect to products and services provided by the Companies operating under the FXOpen brand, nor is it to be considered financial advice

EURAUD 4HRSEURAUD on 4hrs i want to see price come to my green demand floor for a potential buy setup

EURAUDEURAUD on daily we have a buy confirmation with little pull back, its best to know that weekly structure is bullish which could keep buying power to tap into our supply roof.

EURAUD WEEKLY PERSPECTIVEEURAUD had a strong bearish fall in price since 2020 but on technical it found support on 1.60433 backed by EURO bullish sentiment ,buying persist to the tune of break of weekly supply roof resisting JAN ,APRIL TO SEPTEMBER, December weekly candle broke that roof 1.66114 ,this is a buy signal that euro economy will out perform Australian economy ,our next sell zone will be 1.68450 a strong supply roof and 1.71769 will be a big sell pay day for EURAUD.
FEEL FREE TO CHALLENGE MY PERSPECTIVE .

EURAUDEURAUD on monthly the trade is slightly bullish to neutral, but we need a long confirmation for euraud by way of monthly supply roof break and close of monthly body candle, from this breakout we can go long.

EURAUD LONG - (Short + medium term direction prediction)Higher Timeframe trend = Buy
Retail trader bias = Sell
Institutional bias = Buy
Short term target = retail trader stoploss zone
I would like to clarify that I dont trade with extended targets like the secondary and tertiary ones marked. This might be handy for people who leave runners on their trades.
Also keep in mind that I am only providing my own SUBJECTIVE potential target levels here. The best thing to do would be to drop down to lower timeframes and look for good areas of value to enter that are part of your own plan.
S : 7
C : 41,59 - 26,74
R : 20-80

EURAUD: Bearish Continuation
The price of EURAUD will most likely collapse soon enough, due to the supply beginning to exceed demand which we can see by looking at the chart of the pair.
❤️ Please, support our work with like & comment! ❤️

#EURAUD 1DAYEURAUD (1D Timeframe) Analysis
Market Structure:
Channel Resistance: The price is currently testing the upper boundary of a parallel channel, indicating potential selling pressure near resistance.
Forecast:
Sell Opportunity: A rejection from the channel resistance suggests a possible downward move as the price respects the channel pattern.
Key Levels to Watch:
Entry Zone: Near the channel resistance area after signs of price rejection.
Risk Management:
Stop Loss: Placed above the channel resistance to manage risk.
Take Profit Zones: Target the midline or lower boundary of the channel for potential downside movement.
Market Sentiment:
Bearish Bias: Selling pressure is expected to dominate as long as the price remains below the resistance zone. Monitoring for confirmation signals before entry is advised.

euraud sell signal. Don't forget about stop-loss.
Write in the comments all your questions and instruments analysis of which you want to see.
Friends, push the like button, write a comment, and share with your mates - that would be the best THANK YOU.
P.S. I personally will open entry if the price will show it according to my strategy.
Always make your analysis before a trade

EURAUD: Awaiting Breakout for Bullish ContinuationHello,
FX:EURAUD is currently near its 3-month high at 1.671575. What we're waiting for now is a breakout and sustained move above this level to signal further upward momentum. If this doesn't occur, a downward movement is likely. There are expectations for continued bullish movement, but confirmation is still required.
No Nonsense. Just Really Good Market Insights. Leave a Boost
TradeWithTheTrend3344

EURAUD UpdateEURAUD pair has formed a valid ascending channel with 3 touches till now and we're waiting for the 4th
Also this pair has broke the resistance zone 1.6565 so we're waiting for a retest and in the same time it will be our 4th touch of the channel
Once this pair hits the price we will be looking for long (buy) position
and we also will be waiting it to break with an H4 candle below the 4th touch to enter a short (sell) position
Trade safe Family and follow us for more updates

euraud analysis elliot. Don't forget about stop-loss.
Write in the comments all your questions and instruments analysis of which you want to see.
Friends, push the like button, write a comment, and share with your mates - that would be the best THANK YOU.
P.S. I personally will open entry if the price will show it according to my strategy.
Always make your analysis before a trade

Watching and Waiting for a Trend line break on EURAUD Watching and waiting for this pair to break this trend line on the H4 time frame.
Reasons I think price will break through:
- RSI was overbought on H4
- Bearish RSI Divergence on H4
- Bullish candles are getting smaller
What do you think?
*Also please remember these are trading ideas and not trading signals. Thank you.

EUR_AUD WILL GROW|LONG|
✅EUR_AUD made a bullish
Breakout, retest and a nice
Rebound off of the key horizontal
Level of 1.6600 which is now
A support which reinforces our
Bullish bias thus making us
Expect some further growth
LONG🚀
✅Like and subscribe to never miss a new idea!✅

EUR-AUD Will Keep Growing! Buy!
Hello,Traders!
EUR-AUD is trading in an
Uptrend and the pair made
A bullish breakout of the
Key level of 1.6596 then
Made a pullback and is
Now going up again
So we are bullish biased
And we will be expecting
A further bullish move up
Buy!
Comment and subscribe to help us grow!
Check out other forecasts below too!
