Lingrid | EURCAD long OPPORTUNITY in Consolidation ZoneFX:EURCAD has formed a double bottom at the intersection of the support level and upward trendline after a steep correction from the 1.57201 high. The price is consolidating just above 1.56000, showing signs of reversal as it tries to reclaim the bullish structure. A confirmed breakout above minor resistance may open a path toward the 1.56760 level.
📈 Key Levels
Buy zone: 1.55800–1.56050
Buy trigger: close above 1.56200
Target: 1.56760
Sell trigger: drop below 1.55800
💡 Risks
Failure to hold above the upward trendline could invite bearish continuation
Extended rejection from the swap zone limits upward momentum
Lower highs forming may signal weakening bullish strength
Traders, if you liked this idea or if you have your own opinion about it, write in the comments. I will be glad 👩💻
EURCAD trade ideas

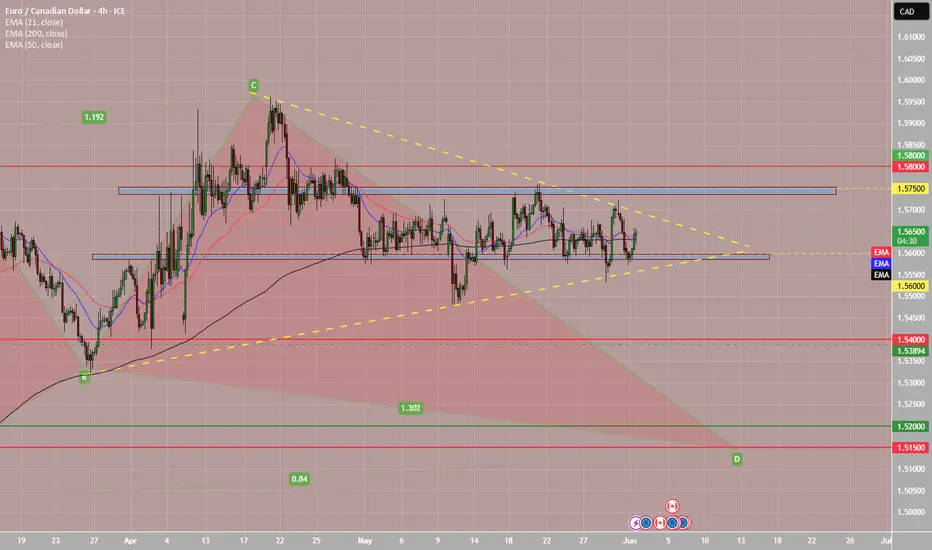
EURCAD's Triangle Hints Drop AheadThe correction looks like a contracting triangle, which is a common pattern in Elliott Wave theory. This kind of triangle usually forms during wave B or wave 4. It includes five smaller waves labeled A, B, C, D, and E, which move within two sloping lines that get closer together. There is also a demand zone marked in red on the chart.
Triangles often show a pause in the market before the price continues in the same direction as before. In this case, the triangle suggests that once wave E is complete, the price may drop again to finish wave C. The expected target area is between 1.54900 and 1.54320. This outlook remains valid as long as the price stays within the correction channel.

EUR/CAD 1H SELL Chart Analysis 02/06/2025This 1-hour EUR/CAD chart illustrates a short trade setup based on price action and supply-demand zones. The entry is near 1.56887, just below a significant resistance/supply zone marked in yellow and red, with the stop-loss positioned at the upper boundary near 1.57235. This area corresponds to a previous swing high and potential liquidity zone.
The take-profit levels are staged at multiple points below the entry:
TP1 around 1.55471
TP2 around 1.54748
TP3 around 1.54135
Final TP zone around 1.53100, near the extended yellow demand zone
The trade follows a risk-reward logic targeting multiple historical support and imbalance zones. Current price action is around 1.56671, showing a slight pullback after tapping into the resistance zone.
Highlighted regions:
Red zone: Stop-loss near 1.57235
Yellow zones: Supply and demand zones
Grey boxes: Imbalance/fair value gaps
Black lines: Key historical support/resistance levels
Lower yellow zone: Long-term target support area
Disclaimer:
This chart and analysis are for informational and educational purposes only and do not constitute financial advice. Trading Forex involves significant risk of loss and is not suitable for all investors. Always conduct your own analysis and consult a licensed financial advisor before making any trading decisions.

EC RANGED PRICE ACTION Price has been trading around a range for the last couple of weeks. Waiting on a breakout to see where possible next levels of Support/resistance might print out. Biased on a LL, favoring a Bearish breakout. But, as it can be seen on the the chart price holds support strong. Lets wait and see wait this trade bring in for us.
A Great Buy Opportunity on EURCADI'm long on EURCAD because overall price is still bullish on the bigger timeframes, price has swept liquidity on the downside then broke structure to the upside, indicating a continuation of the trend.

EURCAD BULLSEURCAD is expected to buy to complete the quasimodo pattern and as pat of the triangle formaion

EURCAD BULLISH OR BEARISH DETAILED ANALYSISEURCAD is currently consolidating within a clean symmetrical triangle formation on the 8H chart, tightening between dynamic support and resistance. Price is hovering around 1.56200 and coiling at the apex of the triangle, suggesting a breakout is imminent. With this structure developing over several weeks, this setup is primed for a high-probability directional move. The overall technical picture is showing compression, and the bullish bias becomes more likely if price breaks and closes above 1.56900.
From a fundamental perspective, the euro is gaining moderate strength as the ECB is maintaining a cautiously hawkish tone while assessing economic recovery and inflation persistence. Meanwhile, the Canadian dollar is facing downward pressure following the Bank of Canada's recent interest rate cut — a shift that surprised many traders and sparked risk-on flows away from the loonie. Crude oil prices, which often support CAD, have also turned volatile with no sustained bullish momentum, weakening CAD’s support base.
This triangle pattern reflects indecision but also the perfect setup for breakout traders waiting for volatility expansion. A confirmed bullish breakout would likely target 1.59200, with short-term resistance levels offering minor friction around 1.57800. The breakout aligns with a well-balanced risk-reward setup, with a stop area potentially below 1.56000. Price action has respected this structure consistently, adding further confluence for a clean technical move.
As EURCAD inches toward a decision point, traders should be on high alert for breakout confirmation and follow-through momentum. This is a textbook volatility squeeze pattern — when it resolves, it tends to run fast and far. With favorable macro fundamentals, this setup has the potential to deliver a solid trend continuation wave in the coming sessions.

EUR/CAD Raid Alert: Last Chance to Loot This Bullish Breakout!🏴☠️ EUR/CAD LOOT ALERT: Can We Steal 100 Pips Before the Trap Springs? (Thief Trading Blueprint)
🌟 Hola! Bonjour! Ciao! Hallo! Marhaba! 🌟
Attention Forex Bandits & Loonie Raiders! 💶🦫💰
🔥 Thief Trading Intel: We're targeting EUR/CAD for a MA breakout heist! Long entry only - eyeing that 1.57200 breakout level. High-risk MA Zone ahead: overbought, consolidating, perfect for our ambush.
"Take your pips and vanish - this steal's on the house!" 💨💵
🚪 ENTRY: The Trap is Set!
📈 "Wait for MA breakout at 1.57200 - then STRIKE!"
Option 1: Buy Stop above MA (breakout confirmation)
Option 2: Buy Limit at swing levels (15-30 min TF)
📌 Pro Thief Move: SET THOSE ALERTS!
🛑 STOP LOSS: Escape Plan
🔊 "Listen up, rookies!" 🗣️
Breakout trades? NO SL until after confirmation!
Rebels: Place wherever... but sleep with one eye open! 👁️
📍 Smart Crew SL: Nearest swing low (1H TF)
🎯 TARGET: Loot & Scoot!
🎯 1.58200 (100 pips of pure profit!)
⚡ SCALPERS' QUICK HIT
👀 Long only!
Deep pockets? Raid now
Light wallet? Join swing heist
Trailing SL = Your Getaway Car! 🚗💨
📢 WHY THIS HEIST?
"Euro vs Loonie" showing strength! Watch for:
COT data & Macro trends
Intermarket analysis
Sentiment shifts
🔗 Full dossier? Bio0 links below! 👉🏻☝🏻👉🏻☝🏻
⚠️ WARNING: News = Police Raid! 📰🚨
CAD news moves fast! Protect your stash:
❌ No new trades during news
🔒 Trailing stops = Handcuff-proof profits
💖 SUPPORT THE CREW!
💥 SMASH THAT BOOST BUTTON! 💥
More boosts = bigger future scores!
Stronger crew = more pips for all!
Next currency heist coming soon... 💶🔫

EUR/CAD BEARS ARE STRONG HERE|SHORT
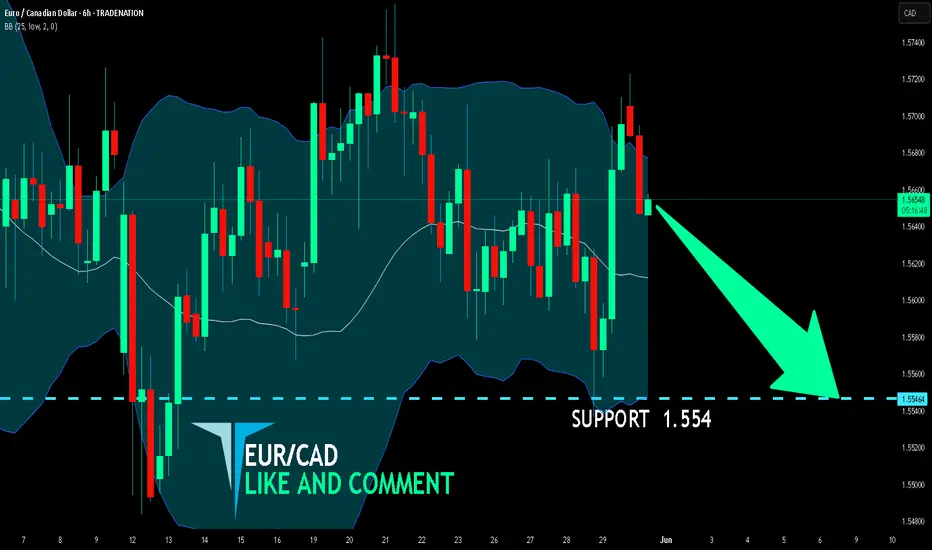
Hello, Friends!
EUR/CAD pair is trading in a local uptrend which we know by looking at the previous 1W candle which is green. On the 6H timeframe the pair is going up too. The pair is overbought because the price is close to the upper band of the BB indicator. So we are looking to sell the pair with the upper BB line acting as resistance. The next target is 1.554 area.
Disclosure: I am part of Trade Nation's Influencer program and receive a monthly fee for using their TradingView charts in my analysis.
✅LIKE AND COMMENT MY IDEAS✅
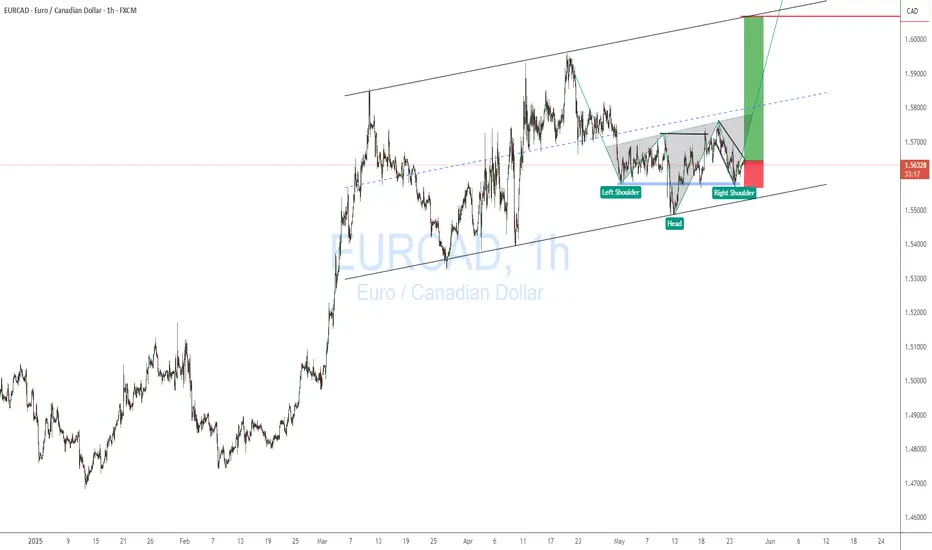
EURCAD BUYPrice is in a Weekly Uptrend.
Price attempted to reverse with head & shoulders but failed instead making new higher low at (1.54797).
Price is making rising higher lows and higher highs as it approaches head & shoulders neckline.
Key Support & Resistance level that is tested multiple times at (1.56981 - 1.56659) the more a level is tested 80% chance it breaks.
Rising trendline in H4.that price has respected.
If price breaks and closes above 1.57608 the B.O is confirmed.
For more conservative entry wait for the retest to confirm the BO and enter the trade

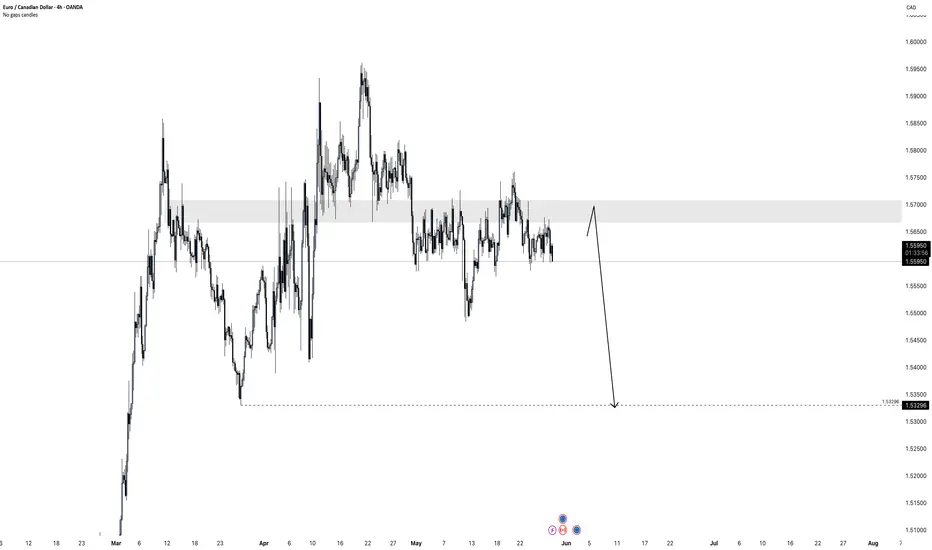
EUR/CAD – Final Pause Before the Bearish Break BeginsEUR/CAD is showing one of the cleanest accumulation traps we’ve seen on the higher timeframes.
What looks like a sideways range is actually a mass liquidation zone — retail traders are being baited into long positions, while smart money is quietly preparing to attack.
This is not consolidation — this is preparation for a long-term bearish move.
❗ Why Bearish?
Price rejected strongly from the 1.59600 zone, a historic resistance that hasn't been broken since March 2020.
This confirms it’s a key institutional level — and price reacted exactly as it should.
The current range is just the final pause before momentum shifts violently downward.
🎯 Trade Setup:
Stop Loss: 1.57270 — above the last weekly swing high and structure invalidation.
Target: 1.52500 — long-term first target. Potential for much deeper continuation.
⚠️ Final Note:
This is a rare opportunity.
Do not get trapped in the noise. This isn’t random movement — this is how institutions position before big shifts.
Patience. Precision. Execution.
The bear is waking up.

EURCAD Sell Setup- look for sell with price pull back
- refine entry with smaller SL for better RR, if you know how
A Message To Traders:
I’ll be sharing high-quality trade setups for a period time. No bullshit, no fluff, no complicated nonsense — just real, actionable forecast the algorithm is executing. If you’re struggling with trading and desperate for better results, follow my posts closely.
Check out my previously posted setups and forecasts — you’ll be amazed by the high accuracy of the results.
"I Found the Code. I Trust the Algo. Believe Me, That’s It."

EUR/CAD Bearish Flag Breakdown Toward Fibonacci SuppAnalysis
1. **Trend Breakdown:**
* The chart shows a clear **bearish structure** developing after a strong rally to the 1.58800 area (Fibonacci 1.618 extension level).
* Two upward trendlines were broken successively, confirming bearish momentum.
2. **Fibonacci Levels:**
* The retracement from 1.58800 down to the 0.382 level (1.54586) has held significant importance.
* Price action is respecting the **Fibonacci retracement zones**, with rejection near the 0.786 and 1.0 levels (1.56915 - 1.57109).
3. **Bearish Flag Pattern:**
* A small **bearish flag/pennant** formed after a strong drop, which has now broken downward.
* This confirms the **continuation of the bearish move**.
4. **Volume Confirmation:**
* Volume spikes during the initial sell-off and again on recent bearish candles suggest **strong selling interest**.
5. **Trade Setup (Marked on Chart):**
* **Entry:** Near 1.56443
* **Stop-Loss:** Around 1.57109 (just above recent highs)
* **Target:** Around 1.54848–1.54500 zone, aligning with prior demand and 0.382 Fib level
---
**Conclusion:**
The chart signals a high-probability **short setup**, backed by a break of structure, Fibonacci confluence, bearish flag breakdown, and volume. A continued decline toward the 1.54500–1.54800 region is likely, provided the price stays below 1.57100.

EURCAD Sell Setup- go check previous EC posted setup, now it's the following down move
- go for sell
- refine entry with smaller SL for better RR, if you have the strategy
A Message To Traders:
I’ll be sharing high-quality trade setups for a period time. No bullshit, no fluff, no complicated nonsense — just real, actionable forecast the algorithm is executing. If you’re struggling with trading and desperate for better results, follow my posts closely.
Check out my previously posted setups and forecasts — you’ll be amazed by the high accuracy of the results.
"I Found the Code. I Trust the Algo. Believe Me, That’s It."

EUR/CAD LongMacro fundamentals favor EUR strength: Strong Q1 GDP, sticky inflation, and no urgency for ECB rate cuts.
CAD is weakening: Oil prices are down ~15% for the month, BoC is leaning dovish, and trade risks remain elevated.
Technical structure is bullish: EUR/CAD broke above multi-year resistance at 1.5500. Price is now pulling back into that zone, which is likely to act as support (classic break-and-retest setup).
Monthly and weekly candles both support a bullish continuation, and this entry gives you a clean structure with tight risk and high reward potential.
EUR/CAD Swing Long Trade Setup
Entry: 1.5520 (buy limit)
Stop Loss: 1.5375 (below weekly structure and invalidation point)
Take Profit 1: 1.5800
Take Profit 2: 1.6000

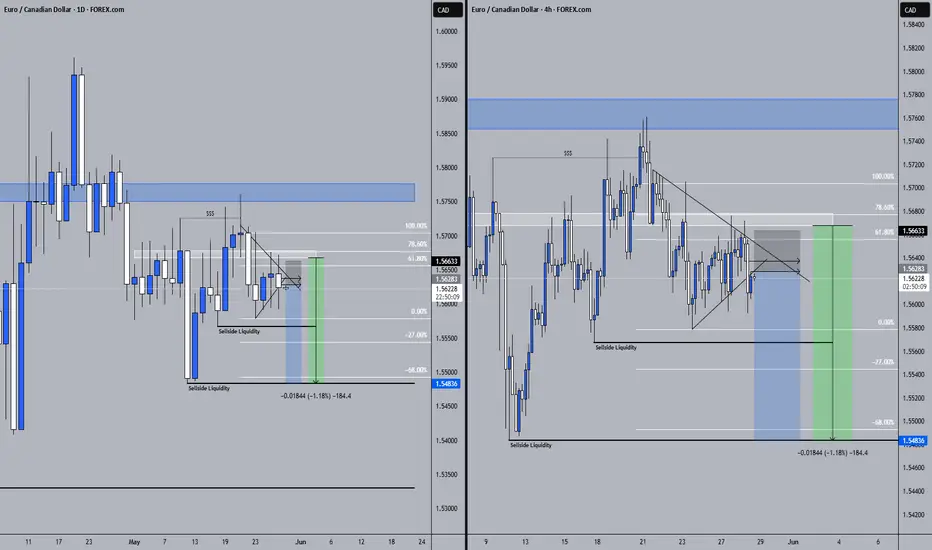
EURCAD 28/05/2025Weekly:
-Weekly highs.
-Liquidity sweep
Daily:
-H&S pattern.
4H:
-Bearish W pattern.
-FVG.
eurcad sell h1#eurcad sell @ 1.5650
stop: 1.5700 (-50) pips
target 1: 1.5600 (+50) pips
target 2: 1.5500 (+100) pips
target 3: 1.5430 (+170) pips
ICMARKETS:EURCAD

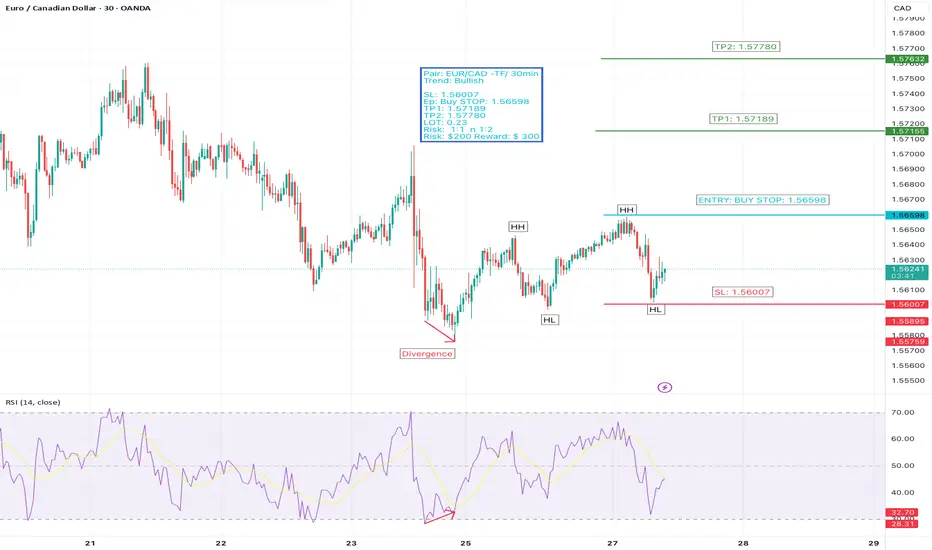
EUR/CAD – Bullish Reversal After Divergence | 30Min Chart setupAfter spotting a bullish divergence on the EUR/CAD 30-minute chart, the price action has confirmed our analysis — the chart has started forming Higher Highs (HHs) and Higher Lows (HLs), signaling the beginning of a bullish trend reversal.
Now that momentum has shifted, we’re preparing a bullish trade setup in line with the new trend.
Trade Setup Details:
Pair: EUR/CAD
Timeframe: 30 Min
Trend: Bullish
Entry (Buy Stop): 1.56598
Stop Loss (SL): 1.56007
Take Profit 1 (TP1): 1.57189 (1:1)
Take Profit 2 (TP2): 1.57780 (1:2)
Lot Size: 0.23
Risk/Reward:
Trade 1: Risk $100 / Reward $100 (1:1)
Trade 2: Risk $100 / Reward $200 (1:2)
Total Risk: $200
Total Potential Reward: $300
✅ Why This Setup?
✅ RSI Divergence: Signaled a potential reversal before price confirmed
✅ HHs and HLs: Clear market structure shift to bullish
✅ Buy Stop Entry: Waits for confirmation above resistance
✅ Smart Risk Management: Split reward target for flexibility
Hashtags:
#EURCAD #BullishTrend #RSIDivergence #ForexSignals #PriceAction #HHHL #TradingSetup #BuyStop #TrendReversal #ForexStrategy #TechnicalTrading #ChartAnalysis #TradingView
Qml patten If it fails it fails we are not the market makers we jus try to move like them..qml patterns can be used to push the price to a certain direction.we are taught to enter at the second manipulation but the reality is that's where we get taken out and then they go our direction init?

EURCAD | 20.05.2025SELL 1.56900 | STOP 1.59700 | TAKE 1.54100 | In the medium term, the price is in a wide range of movement. We expect the price of this pair to decline to the values of the nearest strong supports. Observe the news background and take into account the data publications.

EURCAD (Supply/Demand + OTE + Liquidity)Hello traders!
We have valid 705 fib level, there we can expect reversal + mitigation demand zone.
Now price go to local correction. In local 0.5 fib level you will see big volume like confirmation before impulse till Demand.
Entry: confirmation on LTF in POI
Target: First problem zone is OB 4H
MAIN MOVE IN SHORT - TILL 0.5 of GLOBAL FIB LEVEL. SEE PRIVOIUS IDEA.
Demand zone also can be like fuel, so
Have a profitable day and don't forget to subscribe for more updates!
If you like this idea drop a like, leave a comment.
