EURCAD at key resistance: Will price rebound to 1.5215?The price is currently at a strong resistance level, where it has struggled to break through and reversed sharply to the downside before. This makes the area particularly important to monitor, especially for traders considering potential short setups.
If we begin to see signs of rejection at this level, such as long upper wicks, bearish candlestick patterns, or a clear loss of buying momentum, we could see a move down toward the 1.5215 level . In this particular context I am targeting a very achievable bounce. But if price cleanly breaks out, that would rule out the bearish outlook and suggest even further upside will follow.
This area is pretty important and could give us a better idea of where price is headed.
Just sharing my thoughts on support and resistance, this isn’t financial advice. Always confirm your setups and manage your risk properly.
EURCAD trade ideas

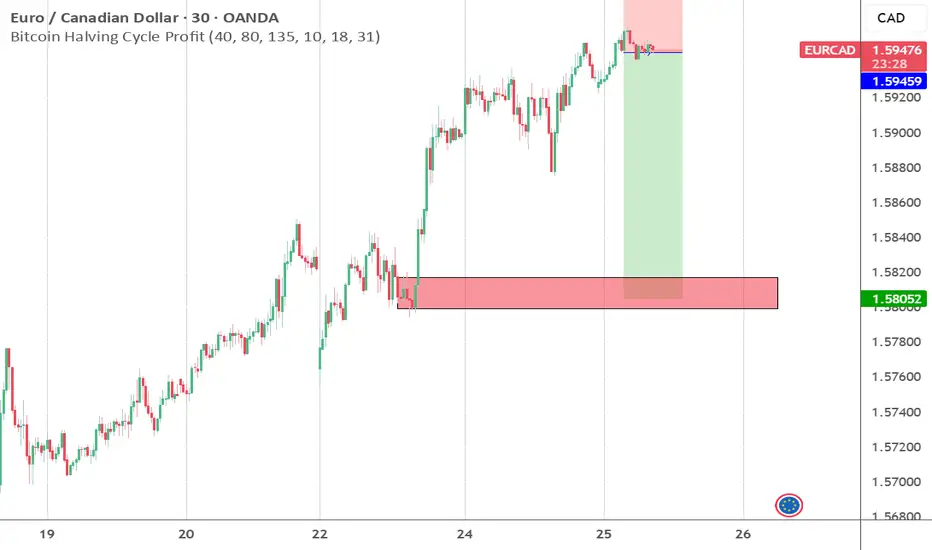
Lingrid | EURCAD April High - Key Resistance Level TestThe price perfectly fulfilled my last idea . FX:EURCAD is extending its bullish leg after breaking out of both a triangle pattern and the downward trendline. The pair reached the 1.59500 resistance area and is now hovering within a broad supply zone where previous reactions occurred. Unless bulls force a sustained breakout, the price may revisit the 1.58060 support for reaccumulation.
📈 Key Levels
Sell zone: 1.59500 - 1.59700
Sell trigger: breakdown below 1.59000
Target: 1.58060
Buy trigger: above 1.57500
💡 Risks
False breakout from resistance could trap late buyers
Extended move may prompt short-term profit-taking
Break below the upward trendline weakens bullish momentum
If this idea resonates with you or you have your own opinion, traders, hit the comments. I’m excited to read your thoughts!

24.06.25 Morning ForecastPairs on Watch -
FX:AUDNZD
FX:USDJPY
FX:EURCAD
A short overview of the instruments I am looking at for today, multi-timeframe analysis down to what I will be looking at for an entry. Enjoy!

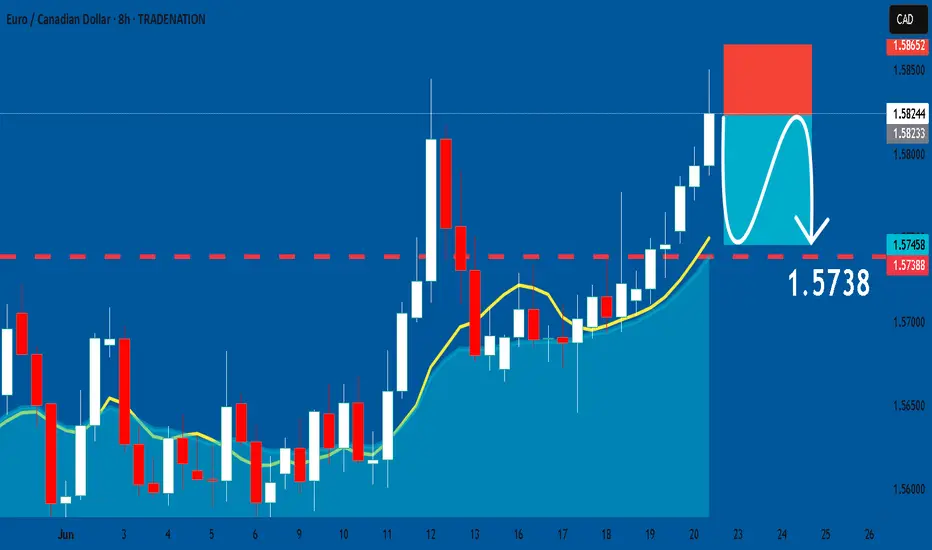
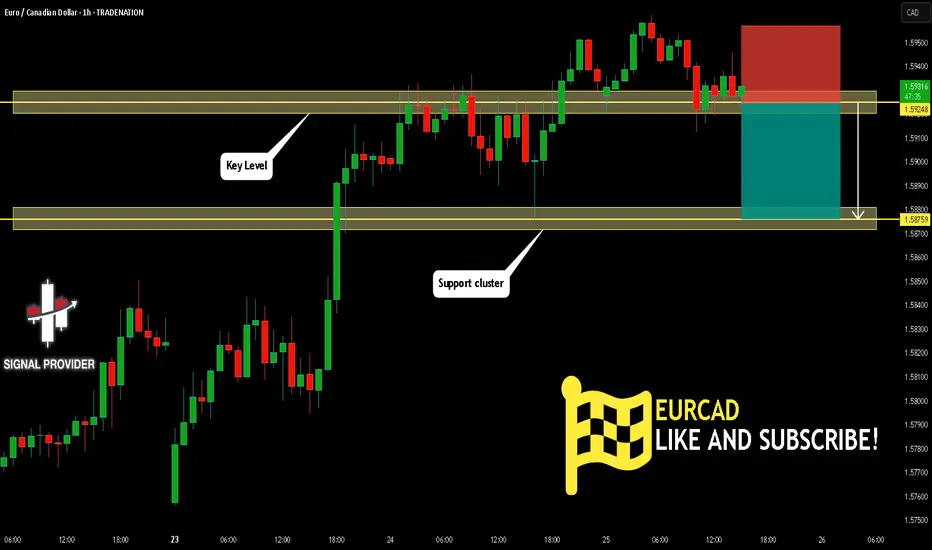
EURCAD: Short Trade Explained
EURCAD
- Classic bearish pattern
- Our team expects retracement
SUGGESTED TRADE:
Swing Trade
Sell EURCAD
Entry - 1.5823
Stop - 1.5865
Take - 1.5738
Our Risk - 1%
Start protection of your profits from lower levels
Disclosure: I am part of Trade Nation's Influencer program and receive a monthly fee for using their TradingView charts in my analysis.
❤️ Please, support our work with like & comment! ❤️
EURCAD Sell- Go for sell then manage your trade
- potentially go lower
- Refine entry with smaller SL for better RR, if your strategy allow
A Message To Traders:
I’ll be sharing high-quality trade setups for a period time. No bullshit, no fluff, no complicated nonsense — just real, actionable forecast the algorithm is executing. If you’re struggling with trading and desperate for better results, follow my posts closely.
Check out my previously posted setups and forecasts — you’ll be amazed by the high accuracy of the results.
"I Found the Code. I Trust the Algo. Believe Me, That’s It."


EURCAD Bearish Setup | Trend Reversal Incoming?The EUR/CAD pair has been respecting a parallel ascending channel, with price recently touching the upper boundary and now showing signs of a potential sharp reversal.
🔹 Key Technical Observations:
Price broke out of a long consolidation zone (early June), followed by a strong bullish impulse.
Currently rejecting the upper boundary of the parallel channel, suggesting bullish exhaustion.
Bearish projection aims for a potential drop toward the 1.55400 support zone, aligning with channel midline or lower boundary.
📊 Trade Idea:
Watch for confirmation of rejection (bearish engulfing / break of minor support).
Short entries can be considered on break below intraday structure.
Target Zone: 1.55400
Invalidation: Clean break and close above 1.58500
⚠ Always manage risk and confirm with your trading strategy.

SELL EURCAD for bullish trend reversal STOP LOSS: 1.6046SELL EURCAD for bullish trend reversal
STOP LOSS: 1.6046
Regular Bearish Divergence
In case of Regular Bearish Divergence:
* The Indicator shows Lower Highs
* Actual Market Price shows Higher Highs
We can see a strong divergence on the MACD already and There is a strong trend reversal on the daily time frame chart.....
The daily time frame is showing strength of trend reversal from this level resistance so we
are looking for the trend reversal and correction push from here .....
TAKE PROFIT : take profit will be when the trend comes to an end, feel from to send me a direct DM if you have any question about take profit or anything
Remember to risk only what you are comfortable with….....trading with the trend, patient and good risk management is the key to success here

EURCAD Sell- Go for short term sell then manage your trade
- keep looking for sell even if price goes one more up
- potentially go lower
- in any case it has to at least go down to 1.5500 level or lower
- Refine entry with smaller SL for better RR, if your strategy allow
A Message To Traders:
I’ll be sharing high-quality trade setups for a period time. No bullshit, no fluff, no complicated nonsense — just real, actionable forecast the algorithm is executing. If you’re struggling with trading and desperate for better results, follow my posts closely.
Check out my previously posted setups and forecasts — you’ll be amazed by the high accuracy of the results.
"I Found the Code. I Trust the Algo. Believe Me, That’s It."

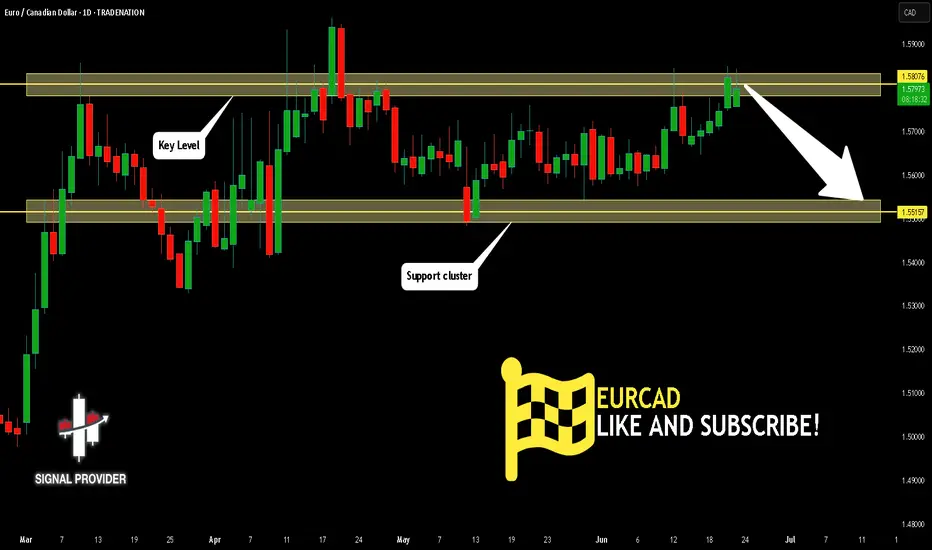
EURCAD Will Go Lower From Resistance! Sell!
Take a look at our analysis for EURCAD.
Time Frame: 1D
Current Trend: Bearish
Sentiment: Overbought (based on 7-period RSI)
Forecast: Bearish
The market is testing a major horizontal structure 1.580.
Taking into consideration the structure & trend analysis, I believe that the market will reach 1.551 level soon.
P.S
The term oversold refers to a condition where an asset has traded lower in price and has the potential for a price bounce.
Overbought refers to market scenarios where the instrument is traded considerably higher than its fair value. Overvaluation is caused by market sentiments when there is positive news.
Disclosure: I am part of Trade Nation's Influencer program and receive a monthly fee for using their TradingView charts in my analysis.
Like and subscribe and comment my ideas if you enjoy them!
EUR/CAD SELLERS WILL DOMINATE THE MARKET|SHORT
Hello, Friends!
The BB upper band is nearby so EUR-CAD is in the overbought territory. Thus, despite the uptrend on the 1W timeframe I think that we will see a bearish reaction from the resistance line above and a move down towards the target at around 1.575.
Disclosure: I am part of Trade Nation's Influencer program and receive a monthly fee for using their TradingView charts in my analysis.
✅LIKE AND COMMENT MY IDEAS✅

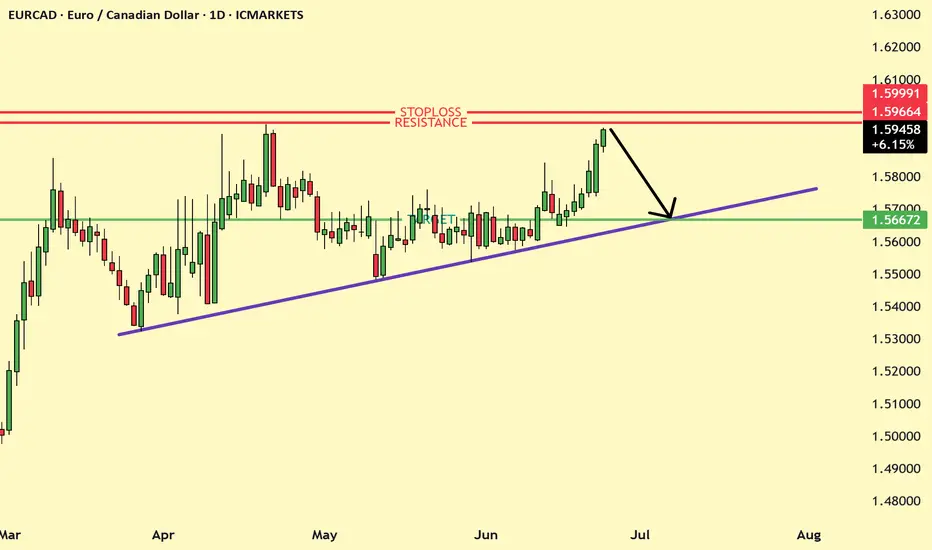
EURCAD At resistance Short EUR/CAD has recently hit a resistance zone near 1.5966–1.5999, which is labeled as a stop-loss/resistance area. The price is expected to reverse from this resistance and retrace down toward the rising trendline support around 1.5667. This zone has acted as a key support level in previous sessions.
EURCAD Will Fall! Sell!
Here is our detailed technical review for EURCAD.
Time Frame: 1h
Current Trend: Bearish
Sentiment: Overbought (based on 7-period RSI)
Forecast: Bearish
The market is approaching a significant resistance area 1.592.
Due to the fact that we see a positive bearish reaction from the underlined area, I strongly believe that sellers will manage to push the price all the way down to 1.587 level.
P.S
Overbought describes a period of time where there has been a significant and consistent upward move in price over a period of time without much pullback.
Disclosure: I am part of Trade Nation's Influencer program and receive a monthly fee for using their TradingView charts in my analysis.
Like and subscribe and comment my ideas if you enjoy them!
EURCAD: The Reaction Was Clean But The Drop Might Be CleanerEURCAD just gave a textbook reaction from a liquidity grab followed by a clean break of structure. After taking out the highs and filling the upper imbalance, price is reversing right back into a bearish FVG.
If price respects it, the downside continuation becomes even more likely.
This setup is simple and clear. Let the market pull into the zone and watch how it reacts. If momentum shifts again, the path down toward previous lows could be smooth.
Be patient. Let price come to you. No need to force entries. Wait for the lower timeframes to confirm the shift before making any move.


EURCAD BUY SETUPWe have transitioned from a downtrend to and up trend as shown by the transition for lower low and lower high to a higher high and potential higher low. we have pulled back to a key level for an entry.

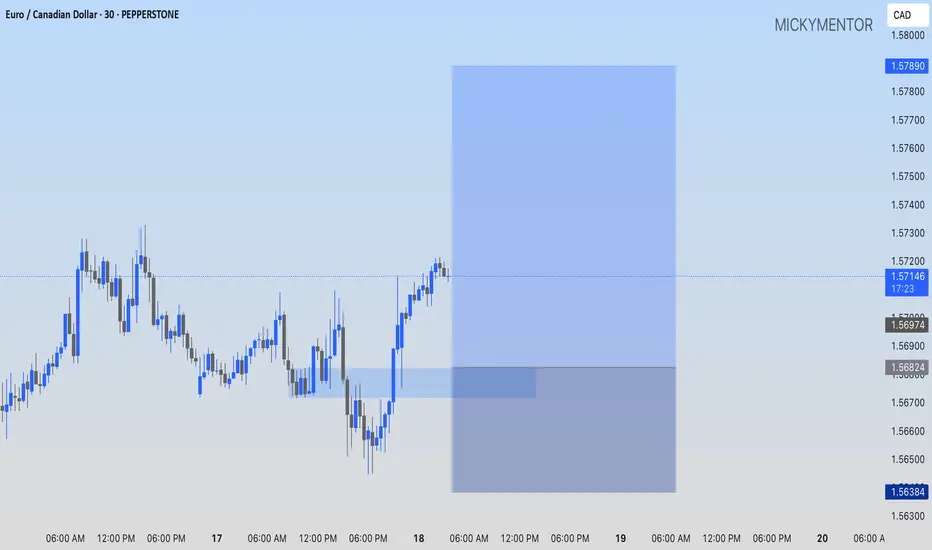
EURCAD: I'M GOING LONG!!!PEPPERSTONE:EURCAD I'm buying from 1.56824 while maintaining 1.57890 as my profit target.
EUR/CAD Long Bias🚀 EUR/CAD – Strong Long Opportunity Based on Multi-Factor Confluence
Over the past week, I conducted a comprehensive macro and sentiment-driven analysis across G10 FX pairs. Among several potential setups, EUR/CAD emerged as the most fundamentally and technically aligned long opportunity, supported by a confluence of high-probability signals across positioning, macro divergence, and capital flow sentiment.
🔍 Key Drivers Behind the EUR/CAD Long Bias:
1️⃣ Macroeconomic Divergence (ENDO View)
🇪🇺 Eurozone has shown relative stability in core macro indicators:
Inflation continues to cool, providing flexibility for ECB rate guidance.
GDP growth remains structurally flat but not contracting — suggesting resilience.
🇨🇦 Canada, on the other hand:
Shows a deteriorating inflation-growth mix.
Retail Sales and Industrial Production trends are softening.
ENDO analysis flags CAD as one of the weakest among G10 currencies.
2️⃣ Positioning – COT Report & Z-Scores
Speculative traders are increasing their long exposure to EUR (COT net longs rising +13,887 last week).
Z-Score on EUR long positions: +1.33 → statistically elevated interest in long EUR exposure.
CAD positioning is flat-to-negative, with no bullish buildup in speculative flows.
This gives EUR a clear relative edge in terms of speculative conviction.
3️⃣ Score & EXO Sentiment Framework
EUR/CAD is one of few pairs showing clear directional consensus across:
✅ EXO Score Sheet: Long Bias confirmed.
✅ RR_w Sheet: Strong risk/reward rating supports further upside.
✅ IR Forecast Sheet: ECB-CAD policy spread favors EUR strength in medium term.
4️⃣ Market Sentiment – Risk Regime
We are currently in a “Risk-On” sentiment regime, which generally favors currencies like EUR over defensive, commodity-linked currencies like CAD.
CAD tends to underperform in reflationary sentiment waves — especially when Oil fails to support the currency.
5️⃣ Cluster & Trend Confirmation
While not a primary factor, cluster analysis shows that EUR/CAD is not in a weak trend regime.
Trend alignment over 30 and 14 days remains favorable.
🔚 Conclusion:
EUR/CAD is one of the few pairs this week that aligns across all analytical fronts: macro, positioning, sentiment, and structure. In a crowded FX environment, such confluence is rare and valuable.

Eurcad LongTradeable idea, this pair broke through the trend line and it seems like it might touch it from above. Look carefully at happens here and look to go long where possible.

POSSIBLE BUY OPPORTUNITY ON EURCADAfter ranging for over a month, EURCAD has finally made a breakout to the upside. We see the formation of a demand zone of which we can expect a classical breakout and re-test!

EURCAD Set To Fall! SELL!
My dear subscribers,
This is my opinion on the EURCAD next move:
The instrument tests an important psychological level 1.5718
Bias - Bearish
Technical Indicators: Supper Trend gives a precise Bearish signal, while Pivot Point HL predicts price changes and potential reversals in the market.
Target - 1.5674
My Stop Loss - 1.5743
About Used Indicators:
On the subsequent day, trading above the pivot point is thought to indicate ongoing bullish sentiment, while trading below the pivot point indicates bearish sentiment.
Disclosure: I am part of Trade Nation's Influencer program and receive a monthly fee for using their TradingView charts in my analysis.
———————————
WISH YOU ALL LUCK
