EURCAD Swing SellEURCAD will decline from this area observing this head and shoulders pattern. Price seems to be exhausted and may reverse anytime now
EURCAD trade ideas

EURCAD – Over a Decade of Rejections Finally Breaking the Cycle?EURCAD is once again testing the legendary multi-year resistance between 1.60 and 1.6150, a zone that has caused at least 5 major rejections since 2014. Each of those led to significant drawdowns — yet this time, price is pressing deeper into it, potentially signaling a macro regime shift if bulls follow through.
Key Technical Observations
Timeframe: 1W
“Multi-Year Supply Zone” or “Overhead Resistance Zone”: 1.60 – 1.6150
Historical Reaction Dates:
🔸 17 Mar 2014
🔸 18 Jan 2016
🔸 19 Mar 2018
🔸 16 Mar 2020
🔸 27 Jul 2020
Current Candle (30 Jun 2025):
Pierced the zone briefly — now hovering just inside
Volume: Noticeable uptick in the last few weeks — interest is real
Structure Below: Strong accumulation base breakout around 1.5280, serving as major support now
TLDR
EURCAD is testing a monster historical supply zone (1.60–1.6150) for the 6th time in 11 years. This could be the breakout that changes the macro trend, but without confirmation, it's still a zone to respect.
Disclaimer
This is for educational purposes only. Not financial advice.

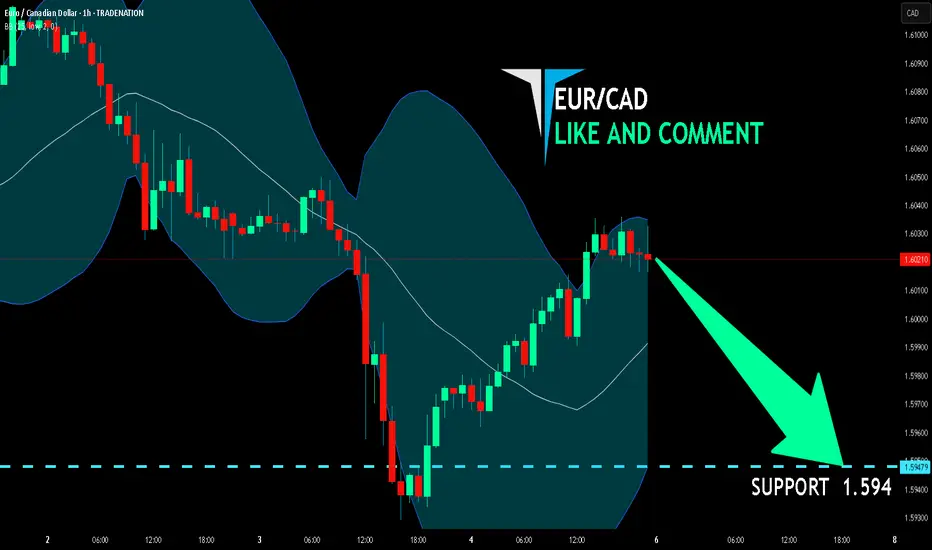
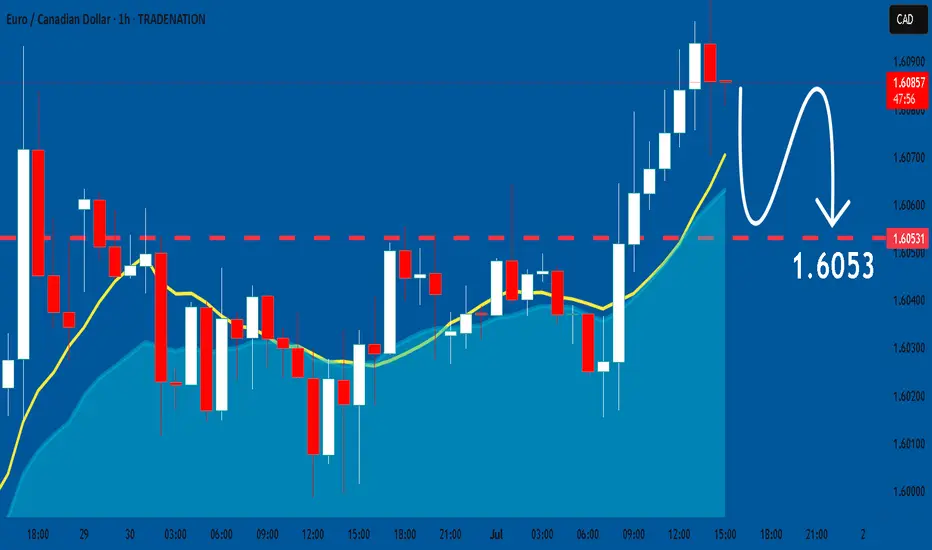
EUR/CAD BEARS ARE GAINING STRENGTH|SHORT
Hello, Friends!
We are targeting the 1.594 level area with our short trade on EUR/CAD which is based on the fact that the pair is overbought on the BB band scale and is also approaching a resistance line above thus going us a good entry option.
Disclosure: I am part of Trade Nation's Influencer program and receive a monthly fee for using their TradingView charts in my analysis.
✅LIKE AND COMMENT MY IDEAS✅
Trade Recap CW27Quick and easy trade recap of my single position from last week with a cheesy little missed trade on EUR/CAD that should have been taken.

EURCAD Wave Analysis – 4 July 2025- EURCAD reversed from support level 1.5950
- Likely to rise to resistance level 1.6100
EURCAD currency pair recently reversed up from the strong support level 1.5950 (former double top from April, acting as the support after it was broken).
The upward reversal from the support level 1.5950 continues the active short-term impulse wave 5 of the intermediate impulse wave (3) from last November.
Given the strong daily uptrend and the strongly bullish euro sentiment seen today, EURCAD currency pair can be expected to rise to the next resistance level 1.6100.

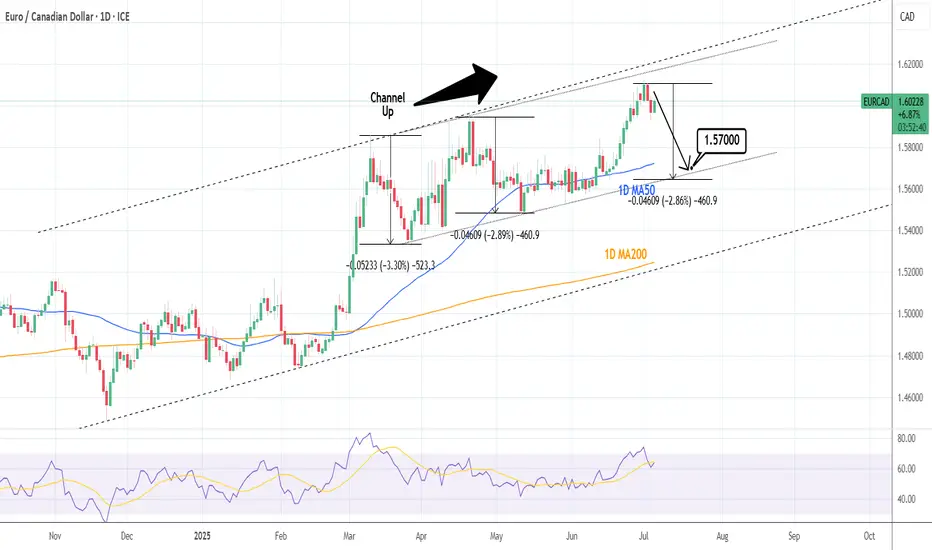
EURCAD: Sell signal on Double Channel Up Top.EURCAD is bullish on its 1D technical outlook (RSI = 63.955, MACD = 0.010, ADX = 41.562) having peaked on two Channel Up patterns at the same time. Technically it should now start the new bearish wave to test the bottom a little below the 1D MA50. Short, TP = 1.57000.
See how our prior idea has worked out:
## If you like our free content follow our profile to get more daily ideas. ##
## Comments and likes are greatly appreciated. ##
EUR/CAD: Wave 5 Trade SetupEUR/CAD is presenting a compelling long setup as what appears to be a five-wave impulse from the June lows looks ready for its final leg higher. The structure shows a classic wave 4 correction that has found support right where Elliott Wave theory suggests it should—setting up a potential wave 5 that could deliver solid risk-to-reward for patient traders.
What the Current Structure Shows (Primary Scenario)
Clean Five-Wave Impulse in Progress: The move up from the June 2025 lows has unfolded in a textbook impulsive pattern, with waves 1, 2, and 3 clearly defined and wave 4 appearing to have completed its correction.
Wave 4 Finds Support: The correction has retraced to a level that respects the typical boundaries for a fourth wave—not too deep to overlap with wave 1, but enough to provide a healthy pullback before the final push.
Wave 5 Setup: With wave 4 likely complete, the structure points to wave 5 beginning, targeting the equality relationship with wave 1 at 1.6170.
Why the Count Is Labeled This Way
The initial surge from the lows shows strong, impulsive characteristics with clear five-wave subdivisions.
Wave 3 extended beyond the typical 1.618 relationship with wave 1, which is common in strong trends.
The current level, at around 1.5927, represents a logical support zone where wave 4 should find its footing.
Trade Setup: Riding the Final Wave
Entry: Current levels, with wave 4 appearing to have bottomed.
Stop Loss: Below 1.5952—if price breaks this level, the wave count is invalidated and suggests wave 4 may be more complex or the entire structure needs reassessment.
Target: 1.6170, where wave 5 achieves equality with wave 1. This is a classic Elliott Wave projection when wave 3 has been the extended wave in the sequence.
What to Watch Next (Confirmation or Invalidation)
Confirmation: A break of the B wave termination point at 160.50 would be confirmation that wave 5 may have started.
Invalidation: A break below 1.5928 would suggest wave 4 is not complete and may be forming a more complex correction.
After Wave 5: Once the target is reached, expect a significant correction as the entire five-wave sequence from the June lows completes.
Alternate Count
If the current support fails, wave 4 could extend into a more complex correction—possibly a triangle or double zigzag—before wave 5 begins. This would delay but not necessarily invalidate the bullish scenario.

EURCAD Potential Short SetupsEURCAD dropped below 1.59988 with bears driving it towards 1.59292. If EURCAD holds below our resistance zone it would be ideal to have a bearish bias.
Sell Zone: 1.59988 - 1.60120
Target Levels: 1.59615 - 1.59292
LIKE or COMMENT if this idea sparks your interest, or share your thoughts below!
FOLLOW to keep up with fresh ideas.
Tidypips: "Keep It Clean, Trade Mean!"

EURCAD Wave Analysis – 3 July 2025- EURCAD reversed from resistance zone
- Likely to fall to support level 1.5800
EURCAD currency pair recently reversed down from the major resistance zone located between the strong resistance level 1.6150 (former yearly high from 2018) and the resistance level 1.5965 (former Double Top from 2020).
The downward reversal from this resistance zone stopped the previous impulse waves 5 and (3).
Given the strength of the resistance level 1.6150 and the bearish divergence on the weekly Stochastic indicator, EURCAD currency pair can be expected to fall further to the next support level 1.5800.

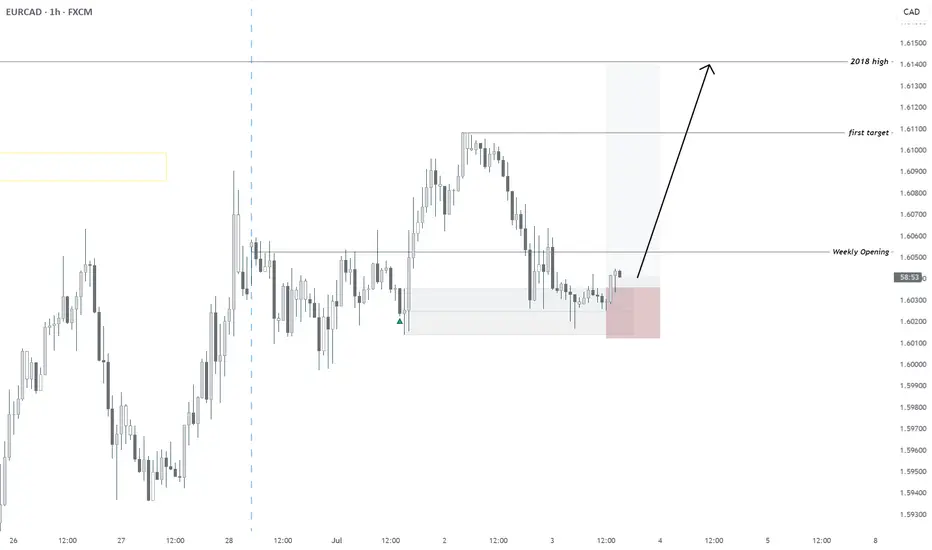
07/02/2025 | EURCAD | BULLISH - REACHING MULTI-YEAR HIGHDaily FX Outlook today:
All timeframes Bullish
Invalidation: 1.60055
First TP: on chart
Second: 2018 High
EURCAD Will Go Down!
HI,Traders !
EUR-CAD made a bearish
Breakout of the rising support
And is now consolidating
Below the line so we are
Bearish biased and we will
Be expecting a further
Bearish continuation !
Comment and subscribe to help us grow !

EUR/CAD 4H Technical Analysis – Trend Continuation Signal ForminIn today’s 4-hour analysis of the EUR/CAD currency pair, we uncover a classic trend continuation setup supported by both price structure and oscillator signals. This kind of setup is a favorite among professional traders because it combines momentum, market psychology, and technical precision.
If you’re a trader looking for clarity during pullbacks, this strategy offers a high-probability entry based on simple but effective tools: EMA crossover, Stochastic RSI, and clean candlestick behavior.
---
Market Structure: A Textbook Uptrend
The EUR/CAD pair has shown exceptional strength over the last few weeks. The current 4-hour chart reveals a clear higher high, higher low structure, with price comfortably trading above both the 50 EMA and 200 EMA.
This isn’t just noise. It’s a strong institutional trend fueled by euro strength and CAD weakness — possibly linked to recent oil weakness or shifts in eurozone inflation sentiment.
The market is currently undergoing a natural pullback — and this pullback may be offering savvy traders a prime entry opportunity.
---
Indicator Confirmation: Stochastic RSI Resetting
Let’s dig into the Stochastic RSI, set at (3, 3, 14, 14), a powerful tool to detect momentum reversals within trends.
* The oscillator has dipped into oversold territory, with values at 0.44 and 0.29.
* In the context of a strong uptrend, this suggests a healthy pause, not a reversal — meaning the market is likely reloading before its next upward move.
* Traders often refer to this behavior as a “reset within a trend” — a critical moment when fear shakes out weak hands and invites disciplined entries.
---
Dynamic Support Holding Firm
The 50 EMA, currently near 1.59792, is acting as dynamic support, catching price dips and rejecting strong bearish moves. Below that, the 200 EMA sits at 1.57965, further confirming a deep support zone.
This kind of dual-EMA structure is a hallmark of trend strength. Price sitting above both with clean spacing means the trend is still maturing and has more room to go.
---
Trade Setup: Buying the Pullback
If you’re planning an entry, here’s a simple, structured idea:
Entry Zone: Between 1.59800 and 1.60000, once a bullish candlestick confirms support (look for pin bars or engulfing candles).
Stop Loss: Below 1.59500 (under swing low and below the 50 EMA to allow breathing space).
Take Profit Levels:
* TP1: 1.61000 (recent swing high)
* TP2: 1.61800 (next Fibonacci extension and psychological round number)
This trade idea supports a 1:2 or 1:3 reward-to-risk ratio, depending on your exit management — ideal for both intraday and short-swing traders.
---
Why This Trade Matters
Many traders struggle with knowing when to enter a trend after they “miss the move.” This is where understanding pullbacks becomes a skill edge.
Instead of chasing highs, this strategy teaches patience — wait for the crowd to panic on a dip, then ride the institutional wave.
This setup works not because of magic indicators, but because it respects market rhythm and trend psychology.
You’re not fighting the market. You’re listening to it.
---
Educational Takeaway
If you’re learning how to trade trends, study this EUR/CAD 4H chart. Here’s what to take away:
* Let price lead, not indicators.
* Look for alignment between EMAs and oscillator resets.
* Enter at key zones — not at the top, not too early.
* Be patient. The best setups are the ones that make sense even to the eye.
Trading is not about being perfect. It’s about consistency, discipline, and only acting when the odds are in your favor.
---
Risk Disclaimer
This analysis is shared for educational purposes only and does not constitute financial advice. Always use risk management, protect your capital, and never trade with money you cannot afford to lose.
Past performance does not guarantee future results.
---
Final Thoughts
The EUR/CAD chart is offering more than a setup — it’s offering a lesson in trading discipline.
With the right entry signal near support and the current structure holding, this pair has the potential to deliver a clean continuation toward 1.6100 and possibly beyond.
Watch for confirmation. Respect your plan. Trade smart.
---
Have you traded EUR/CAD recently? Do you see the same opportunity forming?
Drop your thoughts in the comments — let’s learn together.

EURCAD BullishI like to have consistency in movements and respect the direction of the daily and weekly charts.
I see the formation of a triangle on the daily chart. And we have a possible entry confirmation at the 1.56803 level. Good luck.

EURCAD: Expecting Bearish Continuation! Here is Why:
The recent price action on the EURCAD pair was keeping me on the fence, however, my bias is slowly but surely changing into the bearish one and I think we will see the price go down.
Disclosure: I am part of Trade Nation's Influencer program and receive a monthly fee for using their TradingView charts in my analysis.
❤️ Please, support our work with like & comment! ❤️
EURCAD - LONG - Statistically-backed FX shortlistEURCAD - LONG
Daily Outlook: Statistically-backed FX shortlist
@darksheeptrades
The Top 3 Candlestick Patterns In Buying This Forex PairThis will be the first time of me trading a breakout strategy.
This breakout pattern happened on the week.
Looking back within this 4 hour time frame.What do you see?
-Doji
-Hanging Man
-Bullish Engulfing
These 3 patterns are working together..How?? let me explain:
The bullish engulfing is showing the surpport level of this price action.Then comes in the hanging man.
The hanging man shows you the resistance level.
Its very clear to see on this chart that the price
has broken resistance and this is a very clear breakout.
That is what my mentor Tim Sykes usually says.Because he loves clear breakouts.
This 4 hour time frame is the key to entry
positions in short term trading.
Rocket boost this content to learn more.
Disclaimer:Trading is risky please learn risk management
and profit taking strategies.Also feel free to use a simulation trading account before you trade with real money.
Also do not use margin.

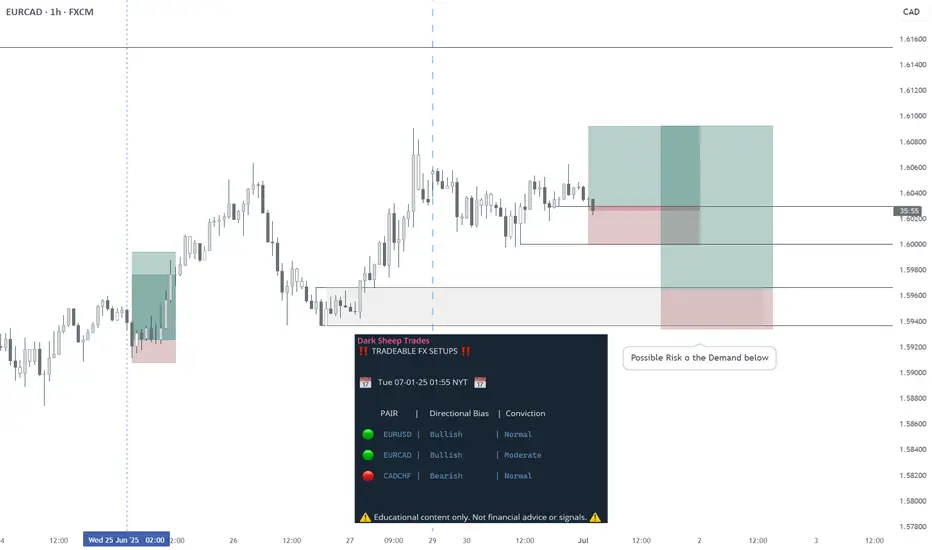
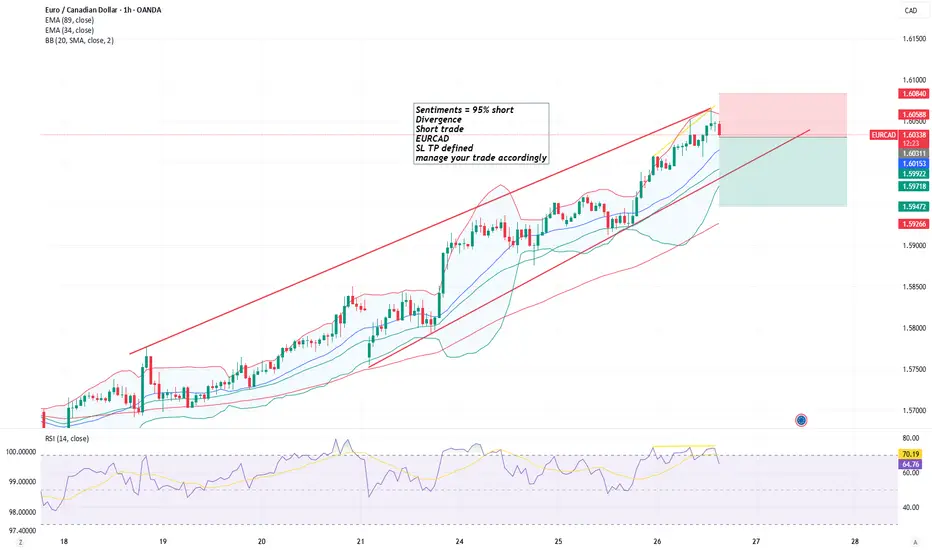
EURCAD SHort - 1hr TF - 95% short sentimentsEURCAD SHort - 1hr TF - 95% short sentiments
Stop Loss
Take profit
levels defined
Entry at CMP
EUR/CAD Raid Alert: Last Chance to Loot This Bullish Breakout!🏴☠️ EUR/CAD LOOT ALERT: Can We Steal 100 Pips Before the Trap Springs? (Thief Trading Blueprint)
🌟 Hola! Bonjour! Ciao! Hallo! Marhaba! 🌟
Attention Forex Bandits & Loonie Raiders! 💶🦫💰
🔥 Thief Trading Intel: We're targeting EUR/CAD for a MA breakout heist! Long entry only - eyeing that 1.57200 breakout level. High-risk MA Zone ahead: overbought, consolidating, perfect for our ambush.
"Take your pips and vanish - this steal's on the house!" 💨💵
🚪 ENTRY: The Trap is Set!
📈 "Wait for MA breakout at 1.57200 - then STRIKE!"
Option 1: Buy Stop above MA (breakout confirmation)
Option 2: Buy Limit at swing levels (15-30 min TF)
📌 Pro Thief Move: SET THOSE ALERTS!
🛑 STOP LOSS: Escape Plan
🔊 "Listen up, rookies!" 🗣️
Breakout trades? NO SL until after confirmation!
Rebels: Place wherever... but sleep with one eye open! 👁️
📍 Smart Crew SL: Nearest swing low (1H TF)
🎯 TARGET: Loot & Scoot!
🎯 1.58200 (100 pips of pure profit!)
⚡ SCALPERS' QUICK HIT
👀 Long only!
Deep pockets? Raid now
Light wallet? Join swing heist
Trailing SL = Your Getaway Car! 🚗💨
📢 WHY THIS HEIST?
"Euro vs Loonie" showing strength! Watch for:
COT data & Macro trends
Intermarket analysis
Sentiment shifts
🔗 Full dossier? Bio0 links below! 👉🏻☝🏻👉🏻☝🏻
⚠️ WARNING: News = Police Raid! 📰🚨
CAD news moves fast! Protect your stash:
❌ No new trades during news
🔒 Trailing stops = Handcuff-proof profits
💖 SUPPORT THE CREW!
💥 SMASH THAT BOOST BUTTON! 💥
More boosts = bigger future scores!
Stronger crew = more pips for all!
Next currency heist coming soon... 💶🔫

EUR/CAD BEARS ARE STRONG HERE|SHORT
Hello, Friends!
We are now examining the EUR/CAD pair and we can see that the pair is going up locally while also being in a uptrend on the 1W TF. But there is also a powerful signal from the BB upper band being nearby, indicating that the pair is overbought so we can go short from the resistance line above and a target at 1.588 level.
Disclosure: I am part of Trade Nation's Influencer program and receive a monthly fee for using their TradingView charts in my analysis.
✅LIKE AND COMMENT MY IDEAS✅

EURCAD My Opinion! SELL!
My dear friends,
Please, find my technical outlook for EURCAD below:
The instrument tests an important psychological level 1.6006
Bias - Bearish
Technical Indicators: Supper Trend gives a precise Bearish signal, while Pivot Point HL predicts price changes and potential reversals in the market.
Target - 1.5978
About Used Indicators:
Super-trend indicator is more useful in trending markets where there are clear uptrends and downtrends in price.
Disclosure: I am part of Trade Nation's Influencer program and receive a monthly fee for using their TradingView charts in my analysis.
———————————
WISH YOU ALL LUCK

EURCAD: The Buy Might Be Hidden in the GapEURCAD just cleared out some liquidity at the highs and is now pulling back into an interesting zone. The bullish structure is still intact, and price has left behind a clean fair value gap right above the previous day’s low.
This zone is where I’m watching closely.
If price taps into that FVG and gives a strong reaction, we could see another leg to the upside. But no need to jump in blindly. Let the 15-minute timeframe show a change of character first.
If that shift happens, I’ll be looking for entries back toward the highs.
Let price come to you. Let structure guide you.

EURCAD: Pullback Trade From Support 🇪🇺🇨🇦
EURCAD is going to bounce from a recently broken
key daily horizontal resistance that turned into support after a violation.
The price violated a neckline of a double bottom pattern with
a bullish imbalance candle on an hourly time frame as a confirmation.
Goal - 1.5998
I am part of Trade Nation's Influencer program and receive a monthly fee for using their TradingView charts in my analysis.

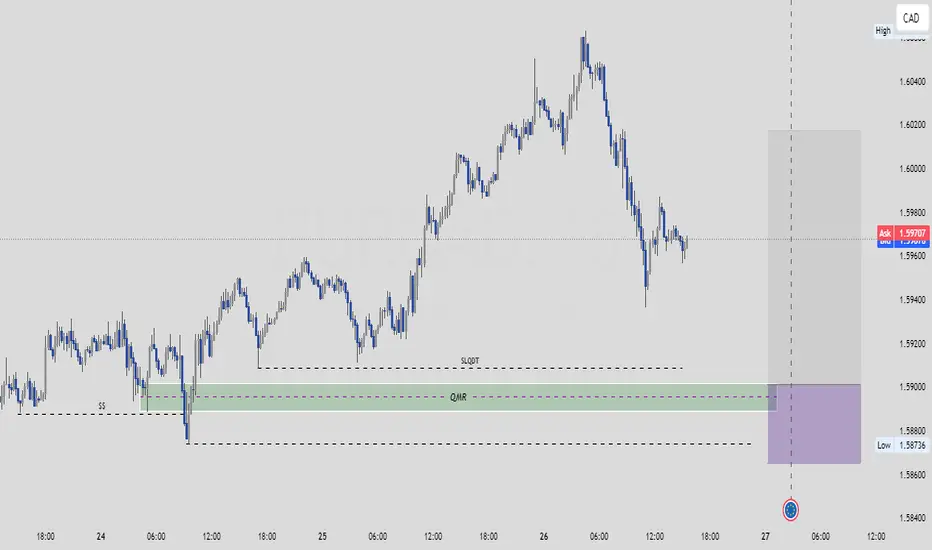
A buy continuation on EURCADThis is an SBI, showing an Inducement (SS), break of structure and a structural liquidity. Now we wait for the market to sweep the structural liquidity (SLQDT) and then we buy