EURCHF trade ideas

EURCHF at Key Support ZoneEURCHF at Key Support Zone
The EURCHF pair has tested a major support zone for the fourth time since December 2023.
This level also marks the lowest price, but rather than reflecting CHF strength, the movement seems to be driven by intervention from the Swiss National Bank (SNB).
While some analysts suggest a safe-haven shift to CHF due to the Trade War, the sharp drop in GBPCHF—despite GBP's overall strength—raises doubts about this theory.
If this support holds, EURCHF could rebound towards key resistance levels: 0.9355, 0.9425, 0.9485, 0.9545, and 0.9600.
You may find more details in the chart!
Thank you and Good Luck!
❤️PS: Please support with a like or comment if you find this analysis useful for your trading day❤️
Disclosure: I am part of Trade Nation's Influencer program and receive a monthly fee for using their TradingView charts in my analysis.

EURCHF, Bullish, Fundamental and Technical AnalysisFundamental Analysis
1. Fundamentals scoring data indicates EUR is stong buy while CHF is CHF is on selling side
2. Seasonality shows EURCHF is Bullish from mid of aprail till end of month
3. COT data shows increase in long positions in EUR
Technical Analysis
1. Currently at strong Support area
2. Double Bottom formation
3. Bullish divergence
4. Buy in 2 parts with sl below support area
5. Take profit on resistance levels

EURCHF is gonna change its trendas the price is at important support level which has not been broken since 2002 and price has hit this level just for the fourth time and whenever the price does that we see the upward movement. My suggestion would be to look for buy setups on 4hr & 1hr as bullish divergence has been formed on 4hr. Buy stop order can be placed on 0.93244 level

EUR-CHF Local Bullish Bias! Buy!
Hello,Traders!
EUR-CHF has hit a horizontal
Demand level abound 0.9202
And we are already seeing a
Local bullish rebound so
Despite this being a counter
Trend long, we will still be
Expecting a local bullish
Correction on Monday
Because the pair seems to
Be oversold, however, we
Would suggest using small
Lot size due to how risky and
Volatile the market has been
These last few weeks
Buy!
Comment and subscribe to help us grow!
Check out other forecasts below too!
Disclosure: I am part of Trade Nation's Influencer program and receive a monthly fee for using their TradingView charts in my analysis.

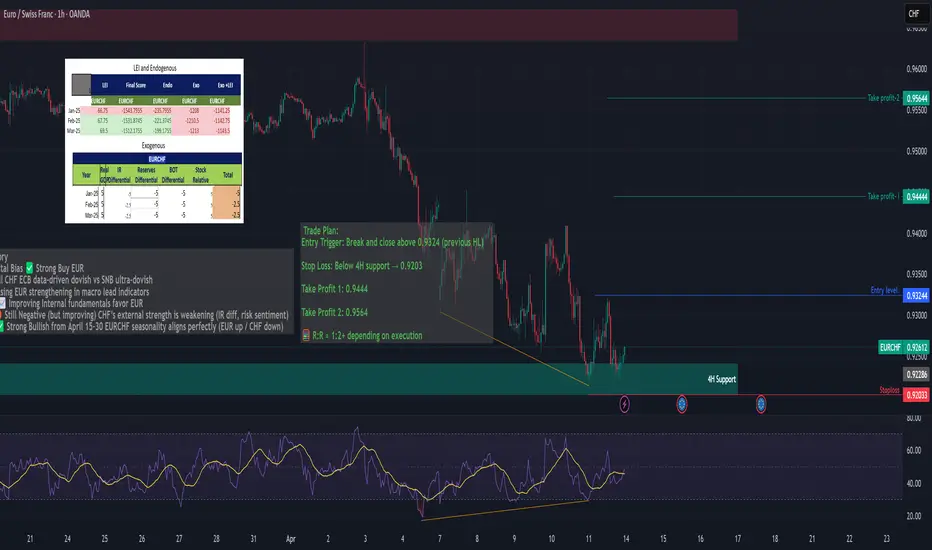
EURCHF – Bullish Reversal Setup + Fundamentals Trade Idea Summary: EUR/CHF showing strong bullish confluence:
✅ Bullish RSI Divergence on both 1H & 4H
📉 Price testing a key 4H support zone
📊 Seasonality favors EURCHF upside (bullish from April 15–30)
🧠 Fundamentals, COT, LEI + Endogenous indicators support long EUR / short CHF
ECB: Dovish but stable, EUR fundamentals improving (LEI ↑, Endo ↑)
SNB: Aggressively dovish, low inflation, weak CHF outlook
EURCHF BUY📉 EURCHF: Historical Downtrend, but a Major Support in Play! 🔍
The euro against the Swiss franc has been in a long-standing downtrend, something no one can really deny.
➡️ So yes, we are clearly in a macro bearish trend.
However, here’s what’s interesting: Since January 2024, the market has formed a key support zone around 0.9200, and we are right on it now.
🔹 From a macro perspective, the euro seems to be quietly resisting the "Trump effect", at least on the surface.
🔹 On the H1 chart, the trend is still bearish, but… we can spot a slowdown in selling pressure and a discreet appearance of buyers.
📌 We still need to wait for clear confirmations before jumping in.
💬 What’s your take on EURCHF? Opportunity or trap? Good luck out there!

EUR_CHF SUPPORT AHEAD|LONG|
✅EUR_CHF is about to retest a key structure level of 0.9204
Which implies a high likelihood of a move up
As some market participants will be taking profit from short positions
While others will find this price level to be good for buying
So as usual we will have a chance to ride the wave of a bullish correction
LONG🚀
✅Like and subscribe to never miss a new idea!✅

EURCHF: To The New Lows 🇪🇺🇨🇭
THere is a high chance that EURCHF will drop lower before the market closes.
I see a confirmed violation of a support of the flag
on an hourly time frame.
Next support - 0.921
❤️Please, support my work with like, thank you!❤️

EURCHF: Bullish Continuation & Long Trade
The recent price action on the EURCHF pair was keeping me on the fence, however, my bias is slowly but surely changing into the bullish one and I think we will see the price go up.
Disclosure: I am part of Trade Nation's Influencer program and receive a monthly fee for using their TradingView charts in my analysis.
❤️ Please, support our work with like & comment! ❤️

EURCHF: Strong bearish waveEURCHF is bearish on its 1D technical outlook (RSI = 32.579, MACD = -0.004, ADX = 41.175) being on a strong bearish wave inside its Channel Down. We estimate to complete a symmetric -8.33% decline from the top, as the previous wave did (TP = 0.91100).
See how our prior idea has worked out:
## If you like our free content follow our profile to get more daily ideas. ##
## Comments and likes are greatly appreciated. ##

EURCHF upside prevailsEURCHF plan (4/10/2025)
EP 0.93480
SL 0.92606
TP 0.94994
risk 0,25% ratio 1: 1.73

EUR/CHF Bullish Reversal Setup – Support Zone Entry with 1:4 Ris1. Trend & EMAs:
The EMA 200 (blue) and EMA 30 (red) are displayed.
Price is below both EMAs, indicating a bearish trend overall.
However, there's a potential reversal or retracement trade being considered.
2. Trade Setup (Long Position):
Entry Point: 0.92750
Stop Loss: 0.92526 (about 22.4 pips below entry)
Target (Take Profit): 0.93643 (about 89.3 pips above entry)
Risk-Reward Ratio (RRR): Approx. 1:4, which is favorable
3. Support & Resistance:
The entry zone is based on a demand/support area where price previously bounced.
The target


EUR/CHF BULLISH BIAS RIGHT NOW| LONG
Hello, Friends!
Previous week’s red candle means that for us the EUR/CHF pair is in the downtrend. And the current movement leg was also down but the support line will be hit soon and lower BB band proximity will signal an oversold condition so we will go for a counter-trend long trade with the target being at 0.943.
Disclosure: I am part of Trade Nation's Influencer program and receive a monthly fee for using their TradingView charts in my analysis.
✅LIKE AND COMMENT MY IDEAS✅

EURCHF Set To Grow! BUY!
My dear subscribers,
This is my opinion on the EURCHF next move:
The instrument tests an important psychological level 0.9353
Bias - Bullish
Technical Indicators: Supper Trend gives a precise Bullish signal, while Pivot Point HL predicts price changes and potential reversals in the market.
Target - 0.9434
My Stop Loss - 0.9307
About Used Indicators:
On the subsequent day, trading above the pivot point is thought to indicate ongoing bullish sentiment, while trading below the pivot point indicates bearish sentiment.
Disclosure: I am part of Trade Nation's Influencer program and receive a monthly fee for using their TradingView charts in my analysis.
———————————
WISH YOU ALL LUCK

EURCHF INTRADAY sideways consolidation EUR/CHF – Simple Technical Analysis
The EUR/CHF pair is currently showing a neutral sentiment, with price moving sideways in a consolidation range. Recent intraday action suggests a corrective pullback toward support at 0.9317, which is a key level from a previous range.
If the pair bounces from 0.9317, it could push higher toward 0.9475, and potentially extend gains to 0.9586 and 0.9743 over the longer term.
However, if 0.9317 breaks down and the pair closes below it, the bullish scenario would be invalidated. This could trigger further downside toward 0.9200, and possibly 0.9050.
Conclusion
Above 0.9317 = Neutral-to-bullish bias; watch for upside toward 0.9475+
Below 0.9317 (daily close) = Turns bearish; opens downside toward 0.9200 and 0.9050
Current sentiment: Range-bound / wait for breakout confirmation
This communication is for informational purposes only and should not be viewed as any form of recommendation as to a particular course of action or as investment advice. It is not intended as an offer or solicitation for the purchase or sale of any financial instrument or as an official confirmation of any transaction. Opinions, estimates and assumptions expressed herein are made as of the date of this communication and are subject to change without notice. This communication has been prepared based upon information, including market prices, data and other information, believed to be reliable; however, Trade Nation does not warrant its completeness or accuracy. All market prices and market data contained in or attached to this communication are indicative and subject to change without notice.

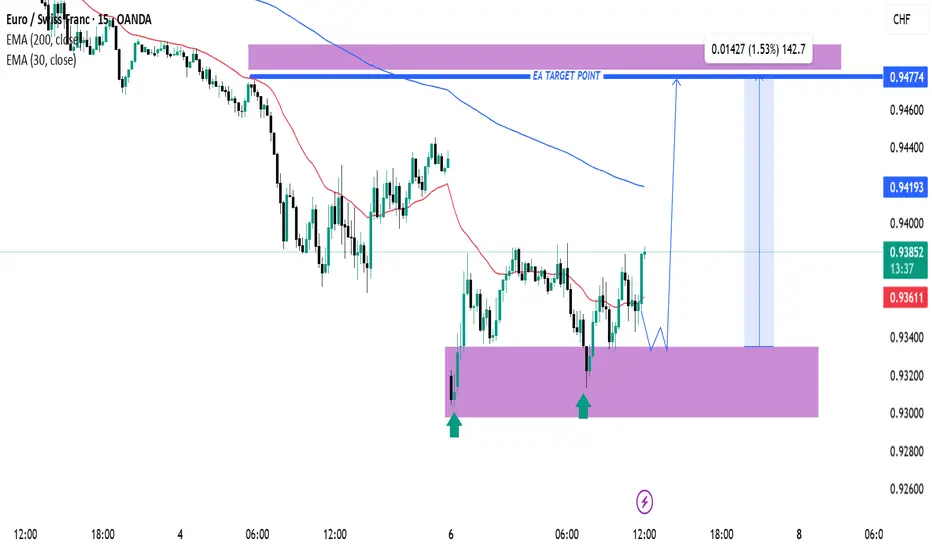
EUR/CHF Bullish Reversal Setup from Key Support Zone – Targeting1. Support Zone (Purple Box at Bottom):
The price has tested this zone multiple times (marked by green arrows), indicating strong demand and a potential double or triple bottom pattern forming.
This support zone ranges roughly between 0.93150 and 0.93350.
2. Projected Bullish Move:
A projected move is drawn from the current price level (around 0.93638) to a target zone near 0.94774, which is marked as the "EA Target Point".
This suggests a potential gain of approximately 1.53% (142.7 pips).
3. Exponential Moving Averages (EMAs):
EMA 30 (red) is currently below the
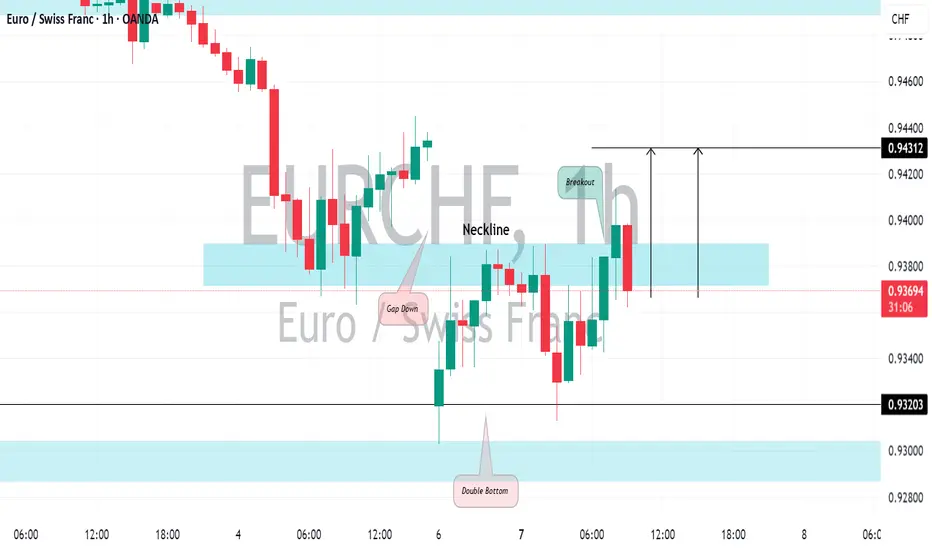
EURCHF: Classic Gap Down To TradeOut of the different gap openings present today, the one I noticed on 📈EURCHF appears to be a promising trading opportunity.
I have identified a clear double bottom pattern on the hourly chart following the gap down opening.
There is a strong likelihood that the gap will be filled soon, with a target set at 0.9431.
EURCHF: One More Gap 🇪🇺🇨🇭
One more gap is going to be filled today.
EURCHF violated a resistance line of a narrow consolidation range
on an hourly time frame.
It looks like the price is heading towards a gap down opening level now.
Goal - 0.9429
❤️Please, support my work with like, thank you!❤️
I am part of Trade Nation's Influencer program and receive a monthly fee for using their TradingView charts in my analysis.

EURCHF - BULLISH CONTINUATION Retreating from its recent high, and using a channel confirmation as seen. the recent equal lows have been swept and price MIGHT be ready for more bullishness. NOT A FINANCIAL ADVICE.


EUR/CHF: Bullish Continuation in ProgressWelcome back! Let me know your thoughts in the comments!
** EURCHF Analysis !
We recommend that you keep this pair on your watchlist and enter when the entry criteria of your strategy is met.
Please support this idea with a LIKE and COMMENT if you find it useful and Click "Follow" on our profile if you'd like these trade ideas delivered straight to your email in the future.
Thanks for your continued support! Welcome back! Let me know your thoughts in the comments!
