EUR/CZK : bearish trend at the test of the bottom.FOREXCOM:EURCZK
The trend is bearish, of course. However, the currency cross is exactly at the test of the previous bottom (see the support line and the yellow circled areas). It could be a rebound or a volatility exhaust. The mentioned bottom is a key level.
Let's look at the next trading sessions.
EURCZK trade ideas
EURCZK: Buy opportunity (long term).The pair is trading within a multi month Rectangle with 25.4100 being the 1M Support. This month 1D has succeeded at pricing a bottom on this support as it stopped the previous downtrend and consolidated (neutral RSI = 44.755, ADX = 16.849, CCI = -10.1188, highs/Lows = 0.0000).
We are taking this as a strong long term buy signal with 25.8300 - 25.9000 as our Target Zone.
** If you like our free content follow our profile (www.tradingview.com) to get more daily ideas. **
Comments and likes are greatly appreciated.
EUR/CZK 1:2 Risk Reward Ratio (potentially more) SHORTEURO pairs have been in a downtrend for quite some time already, while most have had a recent
retracement leaving you thinking that you might have missed out and the wide stop losses arent worth it, its worth looking into more exotic and not as popular pairs that still havent reacted or are yet to touch the critical price points. The entries for this specific trade are quite basic and easy to understand whereas exits you have to be a bit more creative with
Entry : Top of the trendline
TP (1) : At 1:2 Risk Reward Ratio, or 50 Day moving average
TP (2) : The support area marked at the bottom OR below (watch for breakout, if successfully broken keep the trade at your own risk until you determine or see a retracement (1D wick, incredibly oversold RSI etc.)
Stop loss is not based on any pivotal points and is strictly based on reasonable percentage, we're not allowing a lot of room for error because the trade is based solely on the trendline, meaning that if/once its broken, we no longer want to participate/stay in the trade. RSI indicators are also showing overbought.
EURCZK: Sell opportunity on the Descending Triangle.The pair is trading on a year long 1W Descending Triangle with clear Lower Highs that provided optimal sell entries throughout 2019. We are currently on such a Lower High and with 1W neutral (RSI = 52.272, STOCH = 45.628, Williams = -46.569, Highs/Lows = 0.0000) we are targeting the top of the 1D Support zone (TP = 25.62400). Notice how a 1D Higher High sequence (curves) precedes every Lower High rejection on 1W. Similar formation printed in April.
** If you like our free content follow our profile (www.tradingview.com) to get more daily ideas. **
Comments and likes are greatly appreciated.
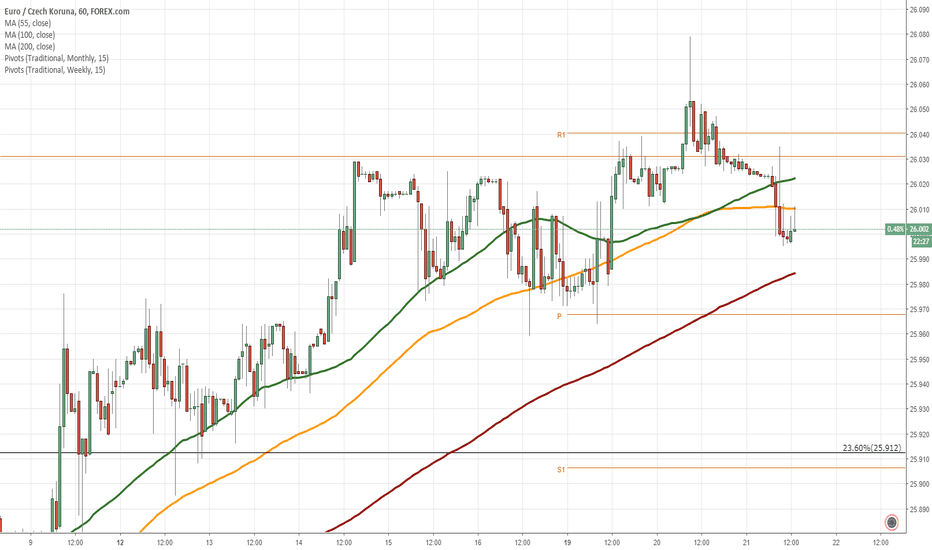
EUR/CZK 1H Chart: Upside potentialThe Euro has been appreciating against the Czech Koruna since the currency pair reversed from the lower boundary of a long-term ascending channel near the 25.40 mark.
Given that the exchange rate is being supported by the 55-, 100– and 200-period SMAs (4H), it is expected that the rate targets the Fibonacci 0.00% retracement at 26.16. Technical indicators for the short run also support bullish scenario.
The general price movement is expected to be upside within the following weeks until the upper channel line near 26.35 is reached.
EUR/CZK 1H Chart: Rising wedge in sightThe Euro has been appreciating against the Czech Koruna after the currency pair reversed from the lower boundary of a long-term ascending channel at 25.43.
As apparent on the chart, the rate has been trading in a rising wedge since the end of September. The pair's neat movement in this pattern suggests that its next move should be north towards the Fibonacci 23.60% retracement at 25.94.
The general price movement is expected to be upside within the following weeks until the 2018 high is reached at 26.14.
EUR/CZK 1H Chart: Trades in falling wedgeThe Czech Koruna has been appreciating against the Euro since the beginning of August after the pair reversed from the 2018 high at 26.14. This movement is bounded in a falling wedge.
As apparent on the chart, the exchange rate reversed from the lower pattern line at 25.43. From the theoretical point of view, it is likely that a surge towards the upper boundary of the wedge at 25.63 could happen within following trading sessions.
However, technical indicators suggest this advance might not be immediate. The pair could go down to the weekly R1 at 25.55 during next trading hours.


