EURGBP is Nearing the Daily Trend!!!Hey Traders, in the coming week we are monitoring EURBBP for a buying opportunity around 0.86400 zone, EURGBP is trading in an uptrend and currently is in a correction phase in which it is approaching the trend at 0.86400 support and resistance area.
Trade safe, Joe.
EURGBP trade ideas

EURGBP – Bearish Continuation in Play?Hello TradingView Family / Fellow Traders. This is Richard, also known as theSignalyst.
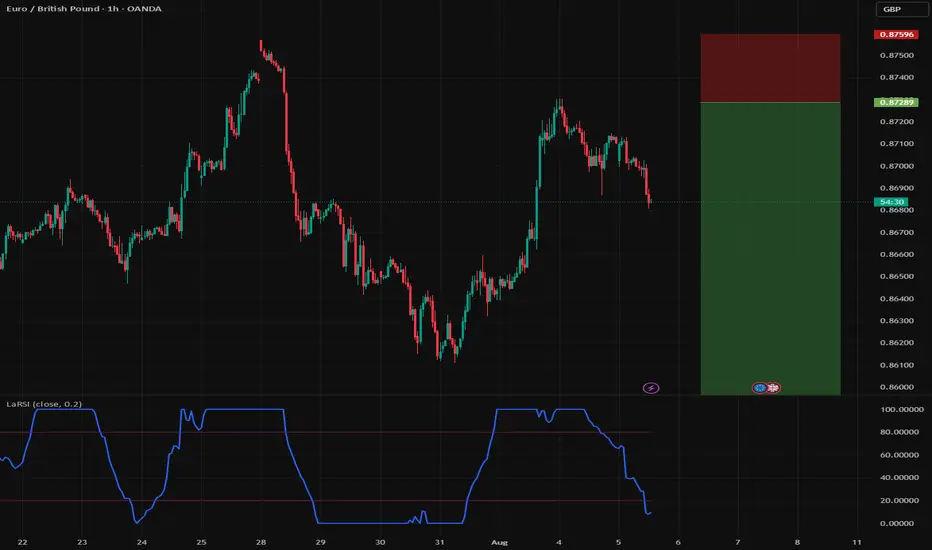
📈EURGBP has been overall bearish trading within the falling channel marked in orange.
Moreover, the green zone is a strong structure.
📚 As per my trading style:
As #EURGBP approaches the red circle zone, I will be looking for bearish reversal setups (like a double top pattern, trendline break , and so on...)
📚 Always follow your trading plan regarding entry, risk management, and trade management.
Good luck!
All Strategies Are Good; If Managed Properly!
~Richard Nasr
Disclosure: I am part of Trade Nation's Influencer program and receive a monthly fee for using their TradingView charts in my analysis.

EURCHF ShortWe are selling this pair. we are in a key fibonacci level, where there is a doji indicating a strong level.


EURGBP Expected Growth! BUY!
My dear friends,
Please, find my technical outlook for EURGBP below:
The instrument tests an important psychological level 0.8673
Bias - Bullish
Technical Indicators: Supper Trend gives a precise Bullish signal, while Pivot Point HL predicts price changes and potential reversals in the market.
Target - 0.8707
About Used Indicators:
Super-trend indicator is more useful in trending markets where there are clear uptrends and downtrends in price.
Disclosure: I am part of Trade Nation's Influencer program and receive a monthly fee for using their TradingView charts in my analysis.
———————————
WISH YOU ALL LUCK

EURGBP Short high probabilityWe have been overextended on all the oscillators on the higher TF. I suspect we need to re test the average price before we can continue up, if we reverse then we are still on the right foot for our speculation. I would add positions every candle or every other candle until we hit Sl and lets take TP based on VWAP or just above VWAP

DeGRAM | EURGBP is testing the upper boundary of the channel📊 Technical Analysis
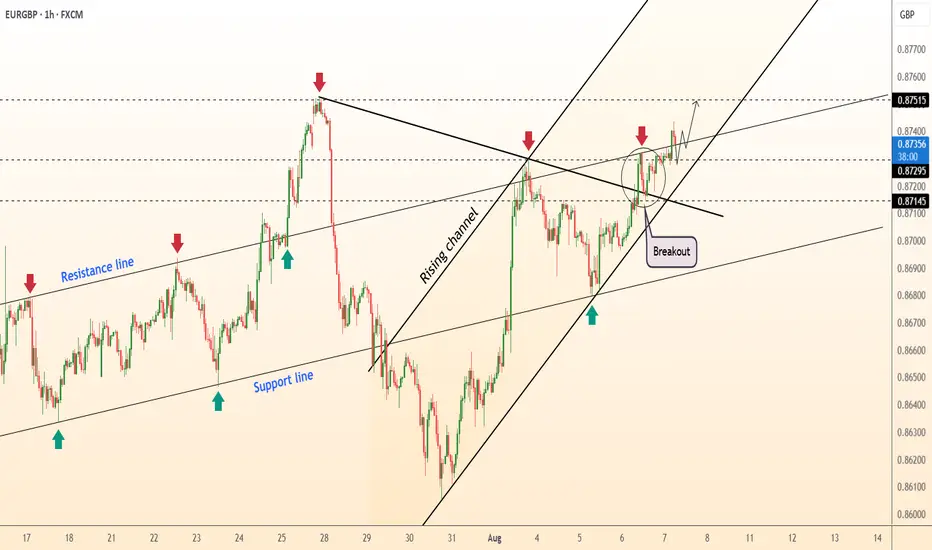
● EURGBP confirmed a breakout from both the wedge and prior descending trendline, now holding above 0.8720 and grinding along the rising intraday channel.
● Bullish continuation is supported by a double retest of the wedge top, with 0.8751 as the next upside target in line with the channel resistance.
💡 Fundamental Analysis
● GBP weakened after dovish BoE statement warning of economic stagnation, while the Euro gained from improved German factory orders and hawkish ECB commentary.
✨ Summary
Buy above 0.8720; breakout continuation eyes 0.8751. Bull bias void on a 1 h close below 0.8710.
-------------------
Share your opinion in the comments and support the idea with like. Thanks for your support!
EURGBP – CHART EXPLANATION & FULL TOP DOWN ANALYSIS BREAKDOWN 📊 EURGBP – CHART EXPLANATION & FULL TOP DOWN ANALYSIS BREAKDOWN
Q3 | W32 | D6 | Y25
Daily Forecast 🔍📅
Here’s a short diagnosis of the current chart setup 🧠📈
Higher time frame order blocks have been identified — these are our patient points of interest 🎯🧭.
It’s crucial to wait for a confirmed break of structure 🧱✅ before forming a directional bias.
This keeps us disciplined and aligned with what price action is truly telling us.
📈 Risk Management Protocols
🔑 Core principles:
Max 1% risk per trade
Only execute at pre-identified levels
Use alerts, not emotion
Stick to your RR plan — minimum 1:2
🧠 You’re not paid for how many trades you take, you’re paid for how well you manage risk.
🧠 Weekly FRGNT Insight
"Trade what the market gives, not what your ego wants."
Stay mechanical. Stay focused. Let the probabilities work.
FX:EURGBP


Market Analysis: EUR/GBP Loses MomentumMarket Analysis: EUR/GBP Loses Momentum
EUR/GBP is consolidating and might aim for a fresh increase above 0.8700.
Important Takeaways for EUR/GBP Analysis Today
- EUR/GBP is trading in a positive zone above the 0.8665 pivot level.
- There is a short-term declining channel forming with resistance near 0.8705 on the hourly chart.
EUR/GBP Technical Analysis
On the hourly chart of EUR/GBP, the pair started a consolidation phase after it failed to surpass 0.8730. The Euro traded below the 0.8710 and 0.8700 support levels against the British Pound.
The EUR/GBP chart suggests that the pair even declined below the 23.6% Fib retracement level of the upward move from the 0.8605 swing low to the 0.8729 high. It is now consolidating losses and trading below the 50-hour simple moving average.
The pair is now facing resistance near the 0.8705 level. There is also a short-term declining channel forming with resistance near 0.8705.
The next major resistance could be 0.8730. The main resistance is near the 0.8750 zone. A close above the 0.8750 level might accelerate gains. In the stated case, the bulls may perhaps aim for a test of 0.8780. Any more gains might send the pair toward the 0.8800 level.
Immediate support sits near 0.8680. The next major support is near 0.8665 or the 50% Fib retracement level of the upward move from the 0.8605 swing low to the 0.8729 high.
A downside break below 0.8665 might call for more downsides. In the stated case, the pair could drop toward 0.8635.
This article represents the opinion of the Companies operating under the FXOpen brand only. It is not to be construed as an offer, solicitation, or recommendation with respect to products and services provided by the Companies operating under the FXOpen brand, nor is it to be considered financial advice.

Are you selling EUR/GBP? Based on fractal analysis and price cycles, the upward trend in EUR/GBP has ended, and we are about to witness a downward trend.
Let me emphasize: be friends with the trend.
Wish you success.

EUR/GBP BULLS ARE STRONG HERE|LONG
EUR/GBP SIGNAL
Trade Direction: long
Entry Level: 0.863
Target Level: 0.872
Stop Loss: 0.857
RISK PROFILE
Risk level: medium
Suggested risk: 1%
Timeframe: 9h
Disclosure: I am part of Trade Nation's Influencer program and receive a monthly fee for using their TradingView charts in my analysis.
✅LIKE AND COMMENT MY IDEAS✅

EURGBP – DAILY FORECAST Q3 | W32 | D6 | Y25📊 EURGBP – DAILY FORECAST
Q3 | W32 | D6 | Y25
Daily Forecast 🔍📅
Here’s a short diagnosis of the current chart setup 🧠📈
Higher time frame order blocks have been identified — these are our patient points of interest 🎯🧭.
It’s crucial to wait for a confirmed break of structure 🧱✅ before forming a directional bias.
This keeps us disciplined and aligned with what price action is truly telling us.
📈 Risk Management Protocols
🔑 Core principles:
Max 1% risk per trade
Only execute at pre-identified levels
Use alerts, not emotion
Stick to your RR plan — minimum 1:2
🧠 You’re not paid for how many trades you take, you’re paid for how well you manage risk.
🧠 Weekly FRGNT Insight
"Trade what the market gives, not what your ego wants."
Stay mechanical. Stay focused. Let the probabilities work.
FX:EURGBP

EURGBP – DAILY FORECAST Q3 | W32 | D4 | Y25📊 EURGBP – DAILY FORECAST
Q3 | W32 | D4 | Y25
Daily Forecast 🔍📅
Here’s a short diagnosis of the current chart setup 🧠📈
Higher time frame order blocks have been identified — these are our patient points of interest 🎯🧭.
It’s crucial to wait for a confirmed break of structure 🧱✅ before forming a directional bias.
This keeps us disciplined and aligned with what price action is truly telling us.
📈 Risk Management Protocols
🔑 Core principles:
Max 1% risk per trade
Only execute at pre-identified levels
Use alerts, not emotion
Stick to your RR plan — minimum 1:2
🧠 You’re not paid for how many trades you take, you’re paid for how well you manage risk.
🧠 Weekly FRGNT Insight
"Trade what the market gives, not what your ego wants."
Stay mechanical. Stay focused. Let the probabilities work.
FX:EURGBP

EURGBP Roadmap EURGBP looking for entry signal at july highs for a leg down. small chance over shooting july highs before turning down.

EURGBP – Climbing a Hill That Might Give WayEURGBP – Climbing a Hill That Might Give Way ⛰️⚠️
EURGBP is climbing a hill that might soon give way. The pair has been grinding higher, but the move feels tired — and momentum is now wobbling on lower timeframes. This is a sell idea against the crowd: a counterpunch at weekly resistance, with price action flashing warning signs 🚨.
📉 I’m bearish on EURGBP — looking to short this overbought market as momentum stalls.
Here’s what’s fueling the setup:
📍 The weekly chart is at major resistance
💡 Price is overbought and pausing with sell signals on the 4H
📈 EUR’s recent rally is built more on sentiment than substance
🇬🇧 GBP fundamentals remain steady despite a recent dip in sentiment
⚖️ This is a clean counter-trend short with favorable risk-to-reward
Zooming out 🔍
The Eurozone isn’t in great shape. Growth is flat 📉, consumption is weakening 🛒, and the ECB has paused rate cuts 🧊 — not because conditions are improving, but because uncertainty is high. Inflation is drifting below target 🎯, and the Euro’s sharp appreciation (+17% since February 📊) risks damaging exports just as US tariff threats re-emerge 🚧.
On the GBP side 🇬🇧, the UK’s story is steadier. GDP growth is modest, investment is picking up 📈, and the BoE is gradually easing 🧭. More cuts may be coming, but they’re largely priced in 💷. Despite weaker recent sentiment, the Pound still has recovery potential — especially if Eurozone fragilities resurface 🕳️.
✅ Technically and fundamentally, this trade lines up. EURGBP is stretched, softening, and ripe for a short.
🤔 Agree with this fade? Or are you still riding the Euro train 🚂? Let’s debate it.
EURGBP – DAILY FORECAST Q3 | W32 | D7 | Y25📊 EURGBP – DAILY FORECAST
Q3 | W32 | D7 | Y25
Daily Forecast 🔍📅
Here’s a short diagnosis of the current chart setup 🧠📈
Higher time frame order blocks have been identified — these are our patient points of interest 🎯🧭.
It’s crucial to wait for a confirmed break of structure 🧱✅ before forming a directional bias.
This keeps us disciplined and aligned with what price action is truly telling us.
📈 Risk Management Protocols
🔑 Core principles:
Max 1% risk per trade
Only execute at pre-identified levels
Use alerts, not emotion
Stick to your RR plan — minimum 1:2
🧠 You’re not paid for how many trades you take, you’re paid for how well you manage risk.
🧠 Weekly FRGNT Insight
"Trade what the market gives, not what your ego wants."
Stay mechanical. Stay focused. Let the probabilities work.
FX:EURGBP


EURGBP - What do you think?We are bullish in the higher time frames.
The entry we are taking is a low probability, low risk counter trend.
We are risking 14 pips for a potential 1:10+

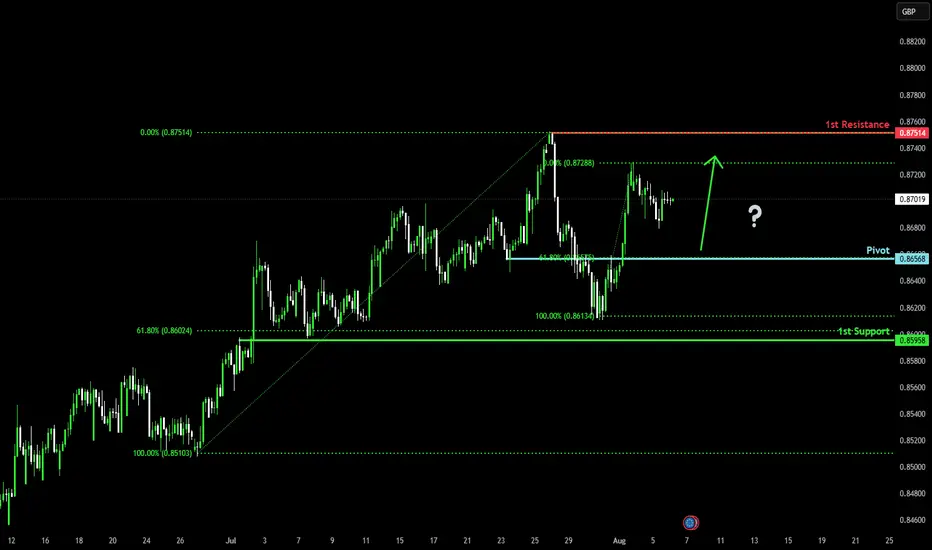
Falling towards 61.8% Fibonacci support?EUR/GBP is falling towards the pivot and could bounce to the 1st resistance which is a swing high resistance.
Pivot: 0.8656
1st Support: 0.8595
1st Resistance: 0.8751
Risk Warning:
Trading Forex and CFDs carries a high level of risk to your capital and you should only trade with money you can afford to lose. Trading Forex and CFDs may not be suitable for all investors, so please ensure that you fully understand the risks involved and seek independent advice if necessary.
Disclaimer:
The above opinions given constitute general market commentary, and do not constitute the opinion or advice of IC Markets or any form of personal or investment advice.
Any opinions, news, research, analyses, prices, other information, or links to third-party sites contained on this website are provided on an "as-is" basis, are intended only to be informative, is not an advice nor a recommendation, nor research, or a record of our trading prices, or an offer of, or solicitation for a transaction in any financial instrument and thus should not be treated as such. The information provided does not involve any specific investment objectives, financial situation and needs of any specific person who may receive it. Please be aware, that past performance is not a reliable indicator of future performance and/or results. Past Performance or Forward-looking scenarios based upon the reasonable beliefs of the third-party provider are not a guarantee of future performance. Actual results may differ materially from those anticipated in forward-looking or past performance statements. IC Markets makes no representation or warranty and assumes no liability as to the accuracy or completeness of the information provided, nor any loss arising from any investment based on a recommendation, forecast or any information supplied by any third-party.
EURGBP – DAILY FORECAST Q3 | W32 | D8 | Y25📊 EURGBP – DAILY FORECAST
Q3 | W32 | D8 | Y25
Daily Forecast 🔍📅
Here’s a short diagnosis of the current chart setup 🧠📈
Higher time frame order blocks have been identified — these are our patient points of interest 🎯🧭.
It’s crucial to wait for a confirmed break of structure 🧱✅ before forming a directional bias.
This keeps us disciplined and aligned with what price action is truly telling us.
📈 Risk Management Protocols
🔑 Core principles:
Max 1% risk per trade
Only execute at pre-identified levels
Use alerts, not emotion
Stick to your RR plan — minimum 1:2
🧠 You’re not paid for how many trades you take, you’re paid for how well you manage risk.
🧠 Weekly FRGNT Insight
"Trade what the market gives, not what your ego wants."
Stay mechanical. Stay focused. Let the probabilities work.
FX:EURGBP

EURGBP – DAILY FORECAST Q3 | W32 | D5 | Y25📊 EURGBP – DAILY FORECAST
Q3 | W32 | D5 | Y25
Daily Forecast 🔍📅
Here’s a short diagnosis of the current chart setup 🧠📈
Higher time frame order blocks have been identified — these are our patient points of interest 🎯🧭.
It’s crucial to wait for a confirmed break of structure 🧱✅ before forming a directional bias.
This keeps us disciplined and aligned with what price action is truly telling us.
📈 Risk Management Protocols
🔑 Core principles:
Max 1% risk per trade
Only execute at pre-identified levels
Use alerts, not emotion
Stick to your RR plan — minimum 1:2
🧠 You’re not paid for how many trades you take, you’re paid for how well you manage risk.
🧠 Weekly FRGNT Insight
"Trade what the market gives, not what your ego wants."
Stay mechanical. Stay focused. Let the probabilities work.
FX:EURGBP

ENTRY EURGBPDisclaimer:
This is merely a chart-based analytical trading idea and is not considered investment advice. Please manage your risks carefully and conduct your own research before making any trading decisions.
