Technical outlook for the EUR/GBP pair!The EUR/GBP pair had been trading in a general uptrend on the 4-hour chart, forming higher highs and higher lows, until the recent pullback on June 24, 2025. During this decline, the price broke below the last higher low located at the 0.85257 level and recorded a lower low.
This recent drop suggests the end of the uptrend on the 4-hour chart and a shift toward a downtrend.
What is the next possible move?
A rise in price toward the 0.85607 level would be considered a corrective move before another potential drop targeting the 0.85241 level.
A rise above the 0.85749 level followed by a 4-hour candle closing above it would indicate a return to the uptrend and invalidate the negative scenario mentioned above.
EURGBP trade ideas

Bearish drop?EUR/GBP is rising towards the pivot that aligns with the 38.2% Fibonacci retracement and could drop to the 1st support.
Pivot: 0.8530
1st Support: 0.8482
1st Resistance: 0.8569
Risk Warning:
Trading Forex and CFDs carries a high level of risk to your capital and you should only trade with money you can afford to lose. Trading Forex and CFDs may not be suitable for all investors, so please ensure that you fully understand the risks involved and seek independent advice if necessary.
Disclaimer:
The above opinions given constitute general market commentary, and do not constitute the opinion or advice of IC Markets or any form of personal or investment advice.
Any opinions, news, research, analyses, prices, other information, or links to third-party sites contained on this website are provided on an "as-is" basis, are intended only to be informative, is not an advice nor a recommendation, nor research, or a record of our trading prices, or an offer of, or solicitation for a transaction in any financial instrument and thus should not be treated as such. The information provided does not involve any specific investment objectives, financial situation and needs of any specific person who may receive it. Please be aware, that past performance is not a reliable indicator of future performance and/or results. Past Performance or Forward-looking scenarios based upon the reasonable beliefs of the third-party provider are not a guarantee of future performance. Actual results may differ materially from those anticipated in forward-looking or past performance statements. IC Markets makes no representation or warranty and assumes no liability as to the accuracy or completeness of the information provided, nor any loss arising from any investment based on a recommendation, forecast or any information supplied by any third-party.

EURGBP SHORT FORECAST Q2 W26 D27 Y25EURGBP SHORT FORECAST Q2 W26 D27 Y25
Professional Risk Managers👋
Welcome back to another FRGNT chart update📈
Diving into some Forex setups using predominantly higher time frame order blocks alongside confirmation breaks of structure.
Let’s see what price action is telling us today! 👀
💡Here are some trade confluences📝
✅Weekly Order block rejection
✅15' Order block to be confirmed
✅4H Order block identification
✅HTF 50 EMA support
🔑 Remember, to participate in trading comes always with a degree of risk, therefore as professional risk managers it remains vital that we stick to our risk management plan as well as our trading strategies.
📈The rest, we leave to the balance of probabilities.
💡Fail to plan. Plan to fail.
🏆It has always been that simple.
❤️Good luck with your trading journey, I shall see you at the very top.
🎯Trade consistent, FRGNT X

EURGBP Bullish continuation breakout supported at 0.8510Trend Overview:
EURGBP remains in a bullish trend, characterised by higher highs and higher lows. The recent intraday price action is forming a continuation consolidation pattern, suggesting a potential pause before a renewed move higher.
Key Technical Levels:
Support: 0.8510 (primary pivot), followed by 0.8490 and 0.8470
Resistance: 0.8570 (initial), then 0.8590 and 0.8620
Technical Outlook:
A pullback to the 0.8510 level, which aligns with the previous consolidation zone, could act as a platform for renewed buying interest. A confirmed bounce from this support may trigger a continuation toward the next resistance levels at 0.8570, 0.8590, and ultimately 0.8620.
Conversely, a daily close below 0.8510 would suggest weakening bullish momentum. This scenario would shift the bias to bearish in the short term, potentially targeting 0.8490 and 0.8470 as downside levels.
Conclusion:
EURGBP maintains a bullish structure while trading above the 0.8510 support. A bounce from this level would validate the consolidation as a continuation pattern, with upside potential toward the 08570 area. A breakdown below 0.8510, however, would invalidate this view and suggest deeper corrective risk.
This communication is for informational purposes only and should not be viewed as any form of recommendation as to a particular course of action or as investment advice. It is not intended as an offer or solicitation for the purchase or sale of any financial instrument or as an official confirmation of any transaction. Opinions, estimates and assumptions expressed herein are made as of the date of this communication and are subject to change without notice. This communication has been prepared based upon information, including market prices, data and other information, believed to be reliable; however, Trade Nation does not warrant its completeness or accuracy. All market prices and market data contained in or attached to this communication are indicative and subject to change without notice.

EURGBP SHORT FORECAST Q2 W26 D26 Y25EURGBP SHORT FORECAST Q2 W26 D26 Y25
Professional Risk Managers👋
Welcome back to another FRGNT chart update📈
Diving into some Forex setups using predominantly higher time frame order blocks alongside confirmation breaks of structure.
Let’s see what price action is telling us today! 👀
💡Here are some trade confluences📝
✅Weekly Order block rejection
✅15' Order block to be confirmed
✅4H Order block identification
✅HTF 50 EMA support
🔑 Remember, to participate in trading comes always with a degree of risk, therefore as professional risk managers it remains vital that we stick to our risk management plan as well as our trading strategies.
📈The rest, we leave to the balance of probabilities.
💡Fail to plan. Plan to fail.
🏆It has always been that simple.
❤️Good luck with your trading journey, I shall see you at the very top.
🎯Trade consistent, FRGNT X

EURGBP LONG FORECAST Q2 W26 D26 Y25EURGBP LONG FORECAST Q2 W26 D26 Y25
Professional Risk Managers👋
Welcome back to another FRGNT chart update📈
Diving into some Forex setups using predominantly higher time frame order blocks alongside confirmation breaks of structure.
Let’s see what price action is telling us today! 👀
💡Here are some trade confluences📝
✅Weekly Order block rejection
✅15' Order block to be confirmed
✅4H Order block identification
✅HTF 50 EMA support
🔑 Remember, to participate in trading comes always with a degree of risk, therefore as professional risk managers it remains vital that we stick to our risk management plan as well as our trading strategies.
📈The rest, we leave to the balance of probabilities.
💡Fail to plan. Plan to fail.
🏆It has always been that simple.
❤️Good luck with your trading journey, I shall see you at the very top.
🎯Trade consistent, FRGNT X

Bullish bounce off overlap support?EUR/GBP is reacting off the support level which is an overlap support that lines up with the 23.6% Fibonacci retracement and could rise from this level to our take profit.
Entry: 0.8515
Why we like it:
There is an overlap support level that aligns with the 23.6% Fibonacci retracement.
Stop loss: 0.8482
Why we like it:
There is a pullback support level that is slightly below the 38.2% Fibonacci retracement.
Take profit: 0.8575
Why we like it:
There is a pullback resistance level.
Enjoying your TradingView experience? Review us!
Please be advised that the information presented on TradingView is provided to Vantage (‘Vantage Global Limited’, ‘we’) by a third-party provider (‘Everest Fortune Group’). Please be reminded that you are solely responsible for the trading decisions on your account. There is a very high degree of risk involved in trading. Any information and/or content is intended entirely for research, educational and informational purposes only and does not constitute investment or consultation advice or investment strategy. The information is not tailored to the investment needs of any specific person and therefore does not involve a consideration of any of the investment objectives, financial situation or needs of any viewer that may receive it. Kindly also note that past performance is not a reliable indicator of future results. Actual results may differ materially from those anticipated in forward-looking or past performance statements. We assume no liability as to the accuracy or completeness of any of the information and/or content provided herein and the Company cannot be held responsible for any omission, mistake nor for any loss or damage including without limitation to any loss of profit which may arise from reliance on any information supplied by Everest Fortune Group.

EURGBP MARKET ANALYSIS AND PRICE PREDICTION EURGBP , has finished consolidating at the institutional renegotiation zone. Decision has been taken already in favor of the Bears because price has broken the Renegotiation Block and Trend line, meaning the renegotiation has failed and there is an order for trend continuation. The renegotiation support is the target to seep the Sell side liquidities. Enter now and hold till Friday.
Entry, stop loss and take profit are clearly stated on the chat!
GOOD LUCK GUYS!
DISCLAIMER
Any analysis might fail due to market uncertainties. Take full responsivity of your capital and manage your risk!

The Day AheadMacro Data Highlights:
US May New Home Sales
Expectations: Potential rebound after recent housing softness.
Market Impact: A strong print may bolster the view that the housing market is stabilizing despite elevated mortgage rates. Weakness could reinforce recessionary concerns and increase calls for Fed easing later in the year.
Asset sensitivity: USD, US Treasuries, homebuilder stocks (e.g., DHI, LEN).
Japan May PPI Services
Focus: Cost pressures in the service sector.
Market Impact: A rise in service PPI would support the BoJ’s inflation persistence narrative, adding weight to the case for policy normalization.
Asset sensitivity: JPY, JGB yields, Japanese equities.
France June Consumer Confidence
Focus: Consumer resilience in the face of political uncertainty and inflation.
Market Impact: With France facing election-driven volatility, a sharp drop could signal consumption headwinds for the eurozone’s second-largest economy.
Asset sensitivity: EUR, CAC 40, French bond spreads.
EU27 May New Car Registrations
Focus: Gauge of consumer durable goods demand and manufacturing health.
Market Impact: Could affect sentiment toward auto-sector equities and EU industrial momentum.
Asset sensitivity: EUR, auto stocks (VW, Stellantis), DAX.
Australia May CPI
Critical Watch: This is the main event for the AUD and RBA rate outlook.
Market Impact: A hotter-than-expected reading would raise RBA rate hike odds and could trigger AUD upside and bond sell-off. A soft print would ease policy pressure.
Asset sensitivity: AUD, ASX, Australian government bonds.
Central Bank Watch:
Fed Chair Powell Testimony (Senate Banking Committee)
Theme: Economic outlook, inflation, and the policy path.
Market Impact: Markets will scrutinize language for any shift in tone regarding rate cuts. With data cooling but inflation still sticky, Powell’s balance between patience and flexibility is key.
Asset sensitivity: USD, S&P 500, Fed rate futures.
BoJ June Meeting Summary & Tamura Speech
Focus: Clarity on BoJ's policy tightening roadmap.
Market Impact: Look for signals on timing of next rate hike and QT strategy. Tamura is considered hawkish, and any comments on rate paths could strengthen JPY.
Asset sensitivity: JPY crosses, Nikkei, JGBs.
BoE’s Lombardelli Speech
Relevance: Comes amid UK stagflation fears.
Market Impact: Insight into how the BoE sees services inflation persistence and wage dynamics. Market remains torn between one last hike or holding steady.
Asset sensitivity: GBP, Gilt yields, FTSE.
Earnings:
Micron Technology (MU)
Focus: AI-driven memory chip demand, China exposure, forward guidance.
Market Impact: As a bellwether for semis and AI-linked cyclicals, MU's results can sway broader tech sentiment.
Asset sensitivity: NASDAQ, SOX index, NVDA/AMD peers.
US Treasury Auctions:
2-Year FRN & 5-Year Note Auctions
Importance: Critical given recent curve steepening and softening inflation.
Market Impact: Weak demand could lift yields and support USD; strong bid-to-cover may indicate confidence in disinflation trend and support risk assets.
Asset sensitivity: US Treasuries, DXY, equity risk sentiment.
Overall Outlook:
June 25 shapes up as a high-stakes day, especially for the USD, AUD, and JPY, with potential for meaningful moves in rates and risk assets. Powell’s tone and Australian inflation are key pivot points, while Micron’s earnings will offer a litmus test for AI/tech exuberance. Keep an eye on European political sentiment as well, especially tied to French consumer mood.
This communication is for informational purposes only and should not be viewed as any form of recommendation as to a particular course of action or as investment advice. It is not intended as an offer or solicitation for the purchase or sale of any financial instrument or as an official confirmation of any transaction. Opinions, estimates and assumptions expressed herein are made as of the date of this communication and are subject to change without notice. This communication has been prepared based upon information, including market prices, data and other information, believed to be reliable; however, Trade Nation does not warrant its completeness or accuracy. All market prices and market data contained in or attached to this communication are indicative and subject to change without notice.


Sell EURGBPI'm analyzing EURGBP, and on the 4-hour timeframe, the overall market is in an uptrend. I can see the market has broken that uptrend and currently retesting. If the market melt down from retest then I’ll look look for entry i.e SELL.

EURGBP TRADE IDEA and UPDATE This seems like it's going to be a long swing trades for us
EURGBP seems to be clear to the UPSIDE
Let's see what the market is going to do

EURGBP - BEARISH SWING TRADE SETUP
📊 *EURGBP 15M — Short Opportunity*
🔍 *Market Structure:*
✅ Trend: Strong downtrend — series of Lower Highs (LH) and Lower Lows (LL) intact.
✅ Price just rejected a key supply zone (~0.85307), forming a new LH.
🎯 *Trade Setup:*
👉 Entry: 0.85296
🛑 Stop Loss: 0.85524 (above last LH/supply zone)
🏆 Take Profit: 0.84818 (next swing low target)
⚠ *Why Short?*
- Bearish structure with no signs of reversal.
- Price retested the broken level and failed to reclaim.
- Favorable risk-reward (~1:2.5).

EURGBP: Bullish Continuation is Highly Probable! Here is Why:
It is essential that we apply multitimeframe technical analysis and there is no better example of why that is the case than the current EURGBP chart which, if analyzed properly, clearly points in the upward direction.
Disclosure: I am part of Trade Nation's Influencer program and receive a monthly fee for using their TradingView charts in my analysis.
❤️ Please, support our work with like & comment! ❤️

Buying the Top Was the TrapEURGBP has just broken structure on the 1H chart and is showing strong momentum to the downside. After taking out a key low, price is now sitting in a vulnerable spot, with a potential push even lower on the table .
A fair value gap sits just above, and price might return there before continuing its move down. If that happens, it could set up a clean lower high and another leg into the previous low.
This setup looks promising, but as always, wait for a shift in character on the lower timeframe before making any decisions . If that shift doesn't happen, price could still run deeper before any reaction.

EURGBP - Bullish No More!Hello TradingView Family / Fellow Traders. This is Richard, also known as theSignalyst.
📈 EURGBP has been overall bullish trading within the rising channel marked in blue. And it is currently retesting the upper bound of the channel.
Moreover, the orange zone is a strong weekly resistance.
🏹 Thus, the highlighted red circle is a strong area to look for sell setups as it is the intersection of the upper blue trendline and resistance.
📚 As per my trading style:
As #EURGBP is around the red circle zone, I will be looking for bearish reversal setups (like a double top pattern, trendline break , and so on...)
📚 Always follow your trading plan regarding entry, risk management, and trade management.
Good luck!
All Strategies Are Good; If Managed Properly!
~Rich
Disclosure: I am part of Trade Nation's Influencer program and receive a monthly fee for using their TradingView charts in my analysis.

EURGBP Bearish SetupHi there
EURGBP looks bearish on the M30 chart, with one price target at 0.85320 for the bearish bias. If the price reverses and breaks above 0.85707, the setup will be invalidated.
Happy trading,
K,
Not trading advice

EURGBP Sell- Go for short term sell then manage your trade
- potentially go lower
- Refine entry with smaller SL for better RR, if your strategy allow
A Message To Traders:
I’ll be sharing high-quality trade setups for a period time. No bullshit, no fluff, no complicated nonsense — just real, actionable forecast the algorithm is executing. If you’re struggling with trading and desperate for better results, follow my posts closely.
Check out my previously posted setups and forecasts — you’ll be amazed by the high accuracy of the results.
"I Found the Code. I Trust the Algo. Believe Me, That’s It."

EG asia filled, sells nowEG has filled the asian range and broke 15m structure downside. My entry from structure break and retest at 0.8566. Looking for sells into last low at 0.85275 and lower towards 0.8500.
This setup gives me 1:3.7 RR with the potential of hitting 1:8 if held down to 0.8500 should price go that low. Im happy taking profits at 1:3 RR.

EURGBP INTRADAY Bullish breakout supported at 0.8510Trend Overview:
EURGBP remains in a bullish trend, characterised by higher highs and higher lows. The recent intraday price action is forming a continuation consolidation pattern, suggesting a potential pause before a renewed move higher.
Key Technical Levels:
Support: 0.8510 (primary pivot), followed by 0.8490 and 0.8470
Resistance: 0.8570 (initial), then 0.8590 and 0.8620
Technical Outlook:
A pullback to the 0.8510 level, which aligns with the previous consolidation zone, could act as a platform for renewed buying interest. A confirmed bounce from this support may trigger a continuation toward the next resistance levels at 0.8570, 0.8590, and ultimately 0.8620.
Conversely, a daily close below 0.8510 would suggest weakening bullish momentum. This scenario would shift the bias to bearish in the short term, potentially targeting 0.8490 and 0.8470 as downside levels.
Conclusion:
WTI Crude Oil maintains a bullish structure while trading above the 0.8510 support. A bounce from this level would validate the consolidation as a continuation pattern, with upside potential toward the 08570 area. A breakdown below 0.8510, however, would invalidate this view and suggest deeper corrective risk.
This communication is for informational purposes only and should not be viewed as any form of recommendation as to a particular course of action or as investment advice. It is not intended as an offer or solicitation for the purchase or sale of any financial instrument or as an official confirmation of any transaction. Opinions, estimates and assumptions expressed herein are made as of the date of this communication and are subject to change without notice. This communication has been prepared based upon information, including market prices, data and other information, believed to be reliable; however, Trade Nation does not warrant its completeness or accuracy. All market prices and market data contained in or attached to this communication are indicative and subject to change without notice

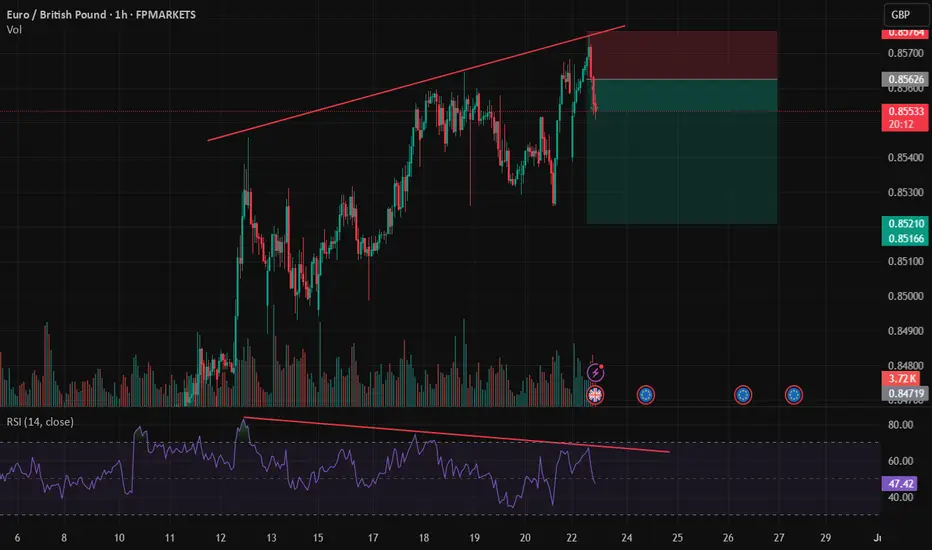
Double topA long and extended double top on this pair. Its an unusual double top figure but combining with the RSI it ticks the box.

EurgbpI miss my first entry that i posted so am expecting price to do a little retracment to the zone then I will enter the buy
