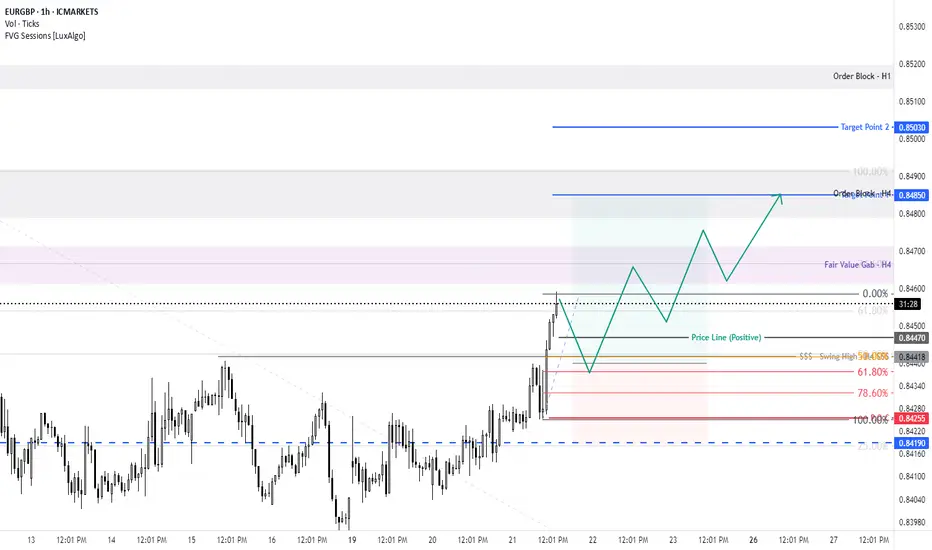
check the trendThe current support level is expected to change and the uptrend will begin. A break of the green resistance level will confirm the uptrend.
EURGBP trade ideas

EUR/GBP🔹Symbol: EUR/GBP
🔹Price: 0.84374
🔹Stop loss: 0.84693
🔹Take profit 1: 0.84055
🔹Take profit 2: 0.83742
🔹Take profit 3: 83262
📊Check your chart before entering.
♦️Check before use to make sure there is no important news.

GBPEUR Bullish - £1.00/1.19 and aboveSimple chart based on candle recovery. Pound looks bullish if no negative economic news emerge or Trump does something unexpected "hehe" I am confident that the pair will attack 1.20 and recover/test the 1.21 range and might go sideways from there fluctuating between 1.18 to 1.21 for the mid term.

EURGBP new fall expecting
OANDA:EURGBP whats next, we are have break of DESCENDING TRIANGL, then its be created DESCENDING CHANNEL, which also is be breaked, now we have breaked and trend line.
Price currently is in zone. Expectations are to see break of zone and higher bearish fall.
SUP zone: 0.84600
RES zone: 0.83500, 0.83200


EURGBP INTRADAY downtrend continuaation Trend Overview:
EUR/GBP remains in a longer-term bearish trend, with recent price action aligning with the prevailing downward momentum.
Key Resistance Level:
0.8440 – Recent swing high and critical resistance. A pivotal level to watch for near-term direction.
Key Support Levels:
0.8390 – Initial support target on bearish rejection.
0.8375 – Secondary support, aligning with previous consolidation zone.
0.8350 – Longer-term support and potential bearish extension target.
Scenario 1: Bearish Rejection at 0.8440
An oversold rally into the 0.8440 resistance level followed by bearish rejection would likely confirm the continuation of the broader downtrend. In this case, sellers may target:
First support: 0.8390
Then: 0.8375
Ultimately: 0.8350 over the longer timeframe.
Scenario 2: Bullish Breakout Above 0.8440
A confirmed breakout and daily close above 0.8440 would invalidate the bearish bias. This would shift sentiment toward a more bullish short-term outlook, opening the path for:
Immediate resistance: 0.8460
Followed by: 0.8480
Conclusion:
The bias remains bearish as long as EUR/GBP trades below the key resistance at 0.8440. A rejection from this level would reinforce the downtrend and bring 0.8390–0.8350 into focus as downside targets. However, a daily close above 0.8440 would be a technical reversal signal, with scope for a bullish extension toward 0.8480.
This communication is for informational purposes only and should not be viewed as any form of recommendation as to a particular course of action or as investment advice. It is not intended as an offer or solicitation for the purchase or sale of any financial instrument or as an official confirmation of any transaction. Opinions, estimates and assumptions expressed herein are made as of the date of this communication and are subject to change without notice. This communication has been prepared based upon information, including market prices, data and other information, believed to be reliable; however, Trade Nation does not warrant its completeness or accuracy. All market prices and market data contained in or attached to this communication are indicative and subject to change without notice.

The Day AheadThursday May 22
Data: US, UK, Japan, Germany, France and the Eurozone May flash PMIs, US April Chicago Fed national activity index, existing home sales, May Kansas City Fed manufacturing activity, initial jobless claims, UK April public finances, Japan March core machine orders, Germany May Ifo survey, France May business confidence, April retail sales, Canada April industrial product price index, raw materials price index
Central banks: Fed's Williams speaks, ECB account of the April meeting, Holzmann, Vujcic, Elderson, Guindos, Escriva and Nagel speak, BoJ's Noguchi speaks, BoE's Pill, Breeden and Dhingra speak
Earnings: Intuit, Analog Devices, Workday, Generali, Lenovo
Auctions: US 10yr TIPS
This communication is for informational purposes only and should not be viewed as any form of recommendation as to a particular course of action or as investment advice. It is not intended as an offer or solicitation for the purchase or sale of any financial instrument or as an official confirmation of any transaction. Opinions, estimates and assumptions expressed herein are made as of the date of this communication and are subject to change without notice. This communication has been prepared based upon information, including market prices, data and other information, believed to be reliable; however, Trade Nation does not warrant its completeness or accuracy. All market prices and market data contained in or attached to this communication are indicative and subject to change without notice.

APPLY CAUTION EURGBP SHORT FORECAST Q2 W21 D22 Y25EURGBP SHORT FORECAST Q2 W21 D22 Y25
Professional Risk Managers👋
Welcome back to another FRGNT chart update📈
Diving into some Forex setups using predominantly higher time frame order blocks alongside confirmation breaks of structure.
Let’s see what price action is telling us today!
💡Here are some trade confluences📝
✅Weekly order block
✅15' order block
✅Intraday bearish breaks of structure
✅Tokyo ranges to be filled
🔑 Remember, to participate in trading comes always with a degree of risk, therefore as professional risk managers it remains vital that we stick to our risk management plan as well as our trading strategies.
📈The rest, we leave to the balance of probabilities.
💡Fail to plan. Plan to fail.
🏆It has always been that simple.
❤️Good luck with your trading journey, I shall see you at the very top.
🎯Trade consistent, FRGNT X

EURGBP Technical & Order Flow AnalysisOur analysis is based on multi-timeframe top-down analysis & fundamental analysis.
Based on our view the price will fall to the monthly level.
DISCLAIMER: This analysis can change anytime without notice and is only for assisting traders in making independent investment decisions. Please note that this is a prediction, and I have no reason to act on it, and neither should you.
Please support our analysis with a boost or comment!

EURGBP: Bearish Forecast & Bearish Scenario
Looking at the chart of EURGBP right now we are seeing some interesting price action on the lower timeframes. Thus a local move down seems to be quite likely.
Disclosure: I am part of Trade Nation's Influencer program and receive a monthly fee for using their TradingView charts in my analysis.
❤️ Please, support our work with like & comment! ❤️

EURGBP BULLISH OR BEARISH DETAILED ANALYSISEURGBP is currently respecting a well-defined rising channel structure on the daily timeframe, and the pair has just delivered a strong bounce off the lower trendline support. This fresh reaction suggests renewed bullish momentum from the bulls stepping in at a key zone. The current price is hovering around 0.84–0.8450, and I’m targeting a move towards the 0.87 area, aligning perfectly with the upper boundary of the channel and a clean resistance level from previous market structure.
From a fundamental standpoint, euro sentiment is being supported by sticky inflation across the Eurozone. The ECB remains cautious with any premature easing, with policymakers signaling a data-dependent approach to rate cuts. Meanwhile, the UK economy is under pressure after the latest GDP figures confirmed weak growth, adding weight to the Bank of England’s dovish leanings. Traders are now increasingly pricing in rate cuts from the BOE in the coming quarter, creating a clear divergence in monetary policy outlooks — a bullish driver for EURGBP.
This technical setup is further reinforced by bullish candlestick formations on the daily chart, signaling a potential reversal from recent weakness. RSI is bouncing off mid-levels, and there's early crossover potential in MACD favoring upward momentum. Price has also reclaimed key support near 0.8400, now likely to act as a floor going forward. As long as price remains above this zone, the path of least resistance remains to the upside.
With this combination of a rising channel pattern, supportive euro fundamentals, and GBP macro weakness, EURGBP presents a high-probability long opportunity. I remain bullish on this pair with a clean 0.87 target in view. Momentum is building, and this setup fits perfectly into a swing trading model with trend continuation potential.

EUR/GBP For Bullish as pull-backwait for pull-back near by entry point and then go long
general trend is down trend
current phase is pull-back
have fun :)
EURGBP BUY ( pending order at 0.8401)After a strong downtrend the price maybe find support approximately at level 0.8401 where we have a 100 DMA , as well as internal trendline.
entry: Buy limit at 0.8401
TP 0.8462
SL 0.8364
(** Trading involve risk. Everyone is responsible for his/her decision).

EURGBP: Potential sell setup towards 0.8500?OANDA:EURGBP has reached a notable resistance level, an area that has been a clear turning point in the past, leading to some notable reversals. Given this, there is once again potential for a bearish reaction if price action confirms rejection, such as a bearish engulfing candle, long upper wicks or increased selling volume.
If the resistance level holds, I anticipate a downward move toward 0.8500 , which for me is quite an achievable target now.
But if the price breaks above this zone and sustains above it, the bearish outlook may be invalidated, leading to further upside.
Just my take on support and resistance zones, not financial advice. Always confirm your setups and trade with solid risk management.

EURGBP directional bias: BuyFollowing today's Pound CPI news, we have broken out of a big range that began last week. Expecting a small pullback followed by a strong buy.

EURGBP SHORT FORECAST Q2 W21 D21 Y25EURGBP SHORT FORECAST Q2 W21 D21 Y25
Professional Risk Managers👋
Welcome back to another FRGNT chart update📈
Diving into some Forex setups using predominantly higher time frame order blocks alongside confirmation breaks of structure.
Let’s see what price action is telling us today!
💡Here are some trade confluences📝
✅Weekly order block
✅15' order block
✅Intraday bearish breaks of structure
✅Tokyo ranges to be filled
🔑 Remember, to participate in trading comes always with a degree of risk, therefore as professional risk managers it remains vital that we stick to our risk management plan as well as our trading strategies.
📈The rest, we leave to the balance of probabilities.
💡Fail to plan. Plan to fail.
🏆It has always been that simple.
❤️Good luck with your trading journey, I shall see you at the very top.
🎯Trade consistent, FRGNT X

check the trendThe price is expected to break through the resistance trend line and continue to the red resistance zone. Then there is a possibility of a correction.
If the price consolidates above the green resistance zone, the continuation of the upward trend is likely.

NNFX EURGBP Short Baseline CrossSignal: NNFX Baseline Cross Short
Context: Baseline Cross on Monday, Pulled back intraday and continued trajectory.
Probability: Low - Long Volume opposing Short Momentum. Exhaustion close.
Risk: Base 1% -> Full Baseline Cross trade within 7 candles of original full signal, on a clean trend
R:R Plan: 1R, 75% scale-out at TP for low probability & drawdown management.
---
Notes:
Apart from GDP News within the day, there is a clear fundamental path to reach TP
Probability is still classified as low due to Long Volume still outpacing Short Volume but this is waning - but the 1R setup makes up for this. There is also scope in this trade to secure this trade at in 1-2 days into a 1.5-2R position.
75% Scale Out at TP is set up due to order block sitting approx 1.5x ATR from entry, presenting possible barriers to trend beyond.

EUR/GBP Breakout Alert – 4H Chart Analysis🔍 Pattern: Falling Wedge
⏱️ Timeframe: 4-Hour
📈 Potential Move: +4.9% upside (~413 pips)
After a long consolidation phase within a falling wedge, EUR/GBP is showing signs of a potential breakout to the upside. Historically, this pattern tends to resolve with a bullish breakout.
💡 Trade Setup (Bullish Bias):
Entry: ~0.8424
Stop Loss: Below 0.8295
Take Profits:
TP1: 0.84791
TP2: 0.85299
TP3: 0.85779
TP4: 0.86502
Final TP: 0.87360
📊 Volume is beginning to build up, supporting the potential breakout scenario. If the wedge breaks upwards, we might see a similar move to the last bullish breakout (~4.9%).
🧠 Risk Management is Key!
Always trade with a solid plan and defined risk parameters.
#EURGBP #ForexTrading #TechnicalAnalysis #PriceAction #TradingSetup #BreakoutTrading #ForexSignals #FallingWedge

EUR/GBP – Bearish Breakout Expected & Triangle Pattern + TargetThe EUR/GBP pair is currently consolidating within a well-defined symmetrical triangle pattern on the 1-hour timeframe, often considered a neutral pattern that precedes a breakout in either direction. However, when placed in context with the prevailing downtrend, surrounding key support/resistance zones, and price action behavior, this pattern strongly hints at a bearish continuation.
This is a textbook setup where market compression within a triangle leads to a volatility expansion, offering traders a clear breakout structure with manageable risk and high reward potential.
🔺 Chart Pattern: Symmetrical Triangle
A symmetrical triangle forms when the price creates lower highs and higher lows, converging toward an apex. This indicates market indecision or consolidation. The price is being squeezed between buyers and sellers, leading to reduced volatility.
In the current EUR/GBP chart:
The triangle is forming after a strong bearish impulse, which suggests the probability favors a breakout to the downside (trend continuation).
The triangle’s boundaries are respected with multiple touches, increasing the reliability of the pattern.
🧭 Key Technical Levels:
🔴 Resistance Zone:
The 0.84290 level has acted as strong resistance, capping bullish attempts multiple times. This zone aligns with the upper boundary of the triangle and the prior rejection point.
🟢 Support Zone:
The 0.83915 - 0.83710 zone is a previous support structure that saw multiple reactions. This is the projected take-profit region if the breakdown follows through.
🔵 Breakout Retest Area:
If price breaks the lower triangle trendline (~0.84100), a retest of the broken line may offer a high-probability short entry. This is a common occurrence in technical setups — former support becomes new resistance.
🧠 Market Psychology Insight:
Triangle patterns often reflect a period of balance — bulls and bears are temporarily equal in strength. However, when the price is compressing inside a triangle after a strong directional move (in this case, downward), the market is typically building pressure to continue in the same direction.
The inability of bulls to push past the resistance and the repeated rejection at lower highs is a psychological signal that buyers are weakening, and a bearish breakout is imminent.
📋 Bearish Trade Plan:
Entry:
After price breaks below the lower triangle boundary (~0.84100) and retests it.
Enter on confirmation of bearish candle rejection or strong volume.
Stop Loss (SL):
Above resistance and triangle top: ~0.84290
This invalidates the setup if breached.
Take Profits:
TP1: 0.83915 — minor support zone and realistic first target.
Final TP: 0.83710 — major support and historical price reaction level.
Risk-Reward Ratio:
With SL around 20 pips and TP1 around 30 pips, and TP2 near 50 pips, this setup offers an excellent risk-reward profile (>1.5 to 2.5 R:R).
📅 Upcoming Events & Volatility Watch:
There are multiple economic events shown on the chart (Euro and UK flags). These could impact price action significantly:
Eurozone announcements
UK economic data releases
Ensure you monitor the economic calendar and avoid entering just before high-impact events unless you're managing your trade closely.
📝 Final Thoughts:
This is a high-probability breakout setup for swing or intraday traders who favor trading patterns with clear structure and back-tested success. The market is compressing, and the squeeze is tightening. Volume is likely to surge on breakout, especially during London or early US sessions.
Keep in mind:
Confirmation is crucial — wait for a decisive breakout and retest before committing capital.
Risk management is non-negotiable — place SL logically beyond structure and respect it.
📌 If the breakout happens to the upside, reevaluate the bias and wait for fresh confirmation. The structure itself remains valid either way — it’s how price reacts at those boundary levels that will dictate the move.

Retest of support - Bullish move expectedOn weekly charts prices made a sharp upward move and breaking trend line support. Now retesting the same spot.
On 4 Hour chart prices are consolidating with imminent pattern of Inverse H&S creating confluence of support.
A move taking price above 0.85 is expected in short term.

EURGBP SHORT FORECAST Q2 W21 D20 Y25EURGBP SHORT FORECAST Q2 W21 D20 Y25
OK, LONG TERM BULLISH,
BUT BUT BUT, LET COLLECT SOME MONEY BEFORE THE LONG MOVE!
ITS THERE FOR THE TAKING !!!!!!!
Professional Risk Managers👋
Welcome back to another FRGNT chart update📈
Diving into some Forex setups using predominantly higher time frame order blocks alongside confirmation breaks of structure.
Let’s see what price action is telling us today!
💡Here are some trade confluences📝
✅Weekly order block
✅15' order block
✅Intraday bearish breaks of structure
✅Tokyo ranges to be filled
🔑 Remember, to participate in trading comes always with a degree of risk, therefore as professional risk managers it remains vital that we stick to our risk management plan as well as our trading strategies.
📈The rest, we leave to the balance of probabilities.
💡Fail to plan. Plan to fail.
🏆It has always been that simple.
❤️Good luck with your trading journey, I shall see you at the very top.
🎯Trade consistent, FRGNT X

EUR/GBP - Blue Box is Strong SupportIn our recent EUR / GBP analysis we observed a substantial 226‑pip decline from the peak.() Price has now settled into the blue‑boxed support area, a level at which previous pullbacks found buyers and genuine value emerged.
It follows, then, that if price can break above the nearby red‑boxed resistance on lower‑time‑frame charts, with clear follow‑through rather than a fleeting spike, a long position would be entirely reasonable. Such a breakout would signal that demand has overcome supply pressure, restoring the upward trend in a disciplined, verifiable way.
Throughout our work, we have never relied on guesswork or emotion. Every level is chosen through careful study of price behavior and hard data, and our methodology has consistently delivered high accuracy as a result. In the spirit of prudent analysis, we ask only for confirmation of these key levels before committing capital, an approach that has served us well and should serve our followers equally.
📌I keep my charts clean and simple because I believe clarity leads to better decisions.
📌My approach is built on years of experience and a solid track record. I don’t claim to know it all but I’m confident in my ability to spot high-probability setups.
📌If you would like to learn how to use the heatmap, cumulative volume delta and volume footprint techniques that I use below to determine very accurate demand regions, you can send me a private message. I help anyone who wants it completely free of charge.
🔑I have a long list of my proven technique below:
🎯 ZENUSDT.P: Patience & Profitability | %230 Reaction from the Sniper Entry
🐶 DOGEUSDT.P: Next Move
🎨 RENDERUSDT.P: Opportunity of the Month
💎 ETHUSDT.P: Where to Retrace
🟢 BNBUSDT.P: Potential Surge
📊 BTC Dominance: Reaction Zone
🌊 WAVESUSDT.P: Demand Zone Potential
🟣 UNIUSDT.P: Long-Term Trade
🔵 XRPUSDT.P: Entry Zones
🔗 LINKUSDT.P: Follow The River
📈 BTCUSDT.P: Two Key Demand Zones
🟩 POLUSDT: Bullish Momentum
🌟 PENDLEUSDT.P: Where Opportunity Meets Precision
🔥 BTCUSDT.P: Liquidation of Highly Leveraged Longs
🌊 SOLUSDT.P: SOL's Dip - Your Opportunity
🐸 1000PEPEUSDT.P: Prime Bounce Zone Unlocked
🚀 ETHUSDT.P: Set to Explode - Don't Miss This Game Changer
🤖 IQUSDT: Smart Plan
⚡️ PONDUSDT: A Trade Not Taken Is Better Than a Losing One
💼 STMXUSDT: 2 Buying Areas
🐢 TURBOUSDT: Buy Zones and Buyer Presence
🌍 ICPUSDT.P: Massive Upside Potential | Check the Trade Update For Seeing Results
🟠 IDEXUSDT: Spot Buy Area | %26 Profit if You Trade with MSB
📌 USUALUSDT: Buyers Are Active + %70 Profit in Total
🌟 FORTHUSDT: Sniper Entry +%26 Reaction
🐳 QKCUSDT: Sniper Entry +%57 Reaction
📊 BTC.D: Retest of Key Area Highly Likely
📊 XNOUSDT %80 Reaction with a Simple Blue Box!
📊 BELUSDT Amazing %120 Reaction!
📊 Simple Red Box, Extraordinary Results
I stopped adding to the list because it's kinda tiring to add 5-10 charts in every move but you can check my profile and see that it goes on..
