ENTRY EURGBPDisclaimer:
This is merely a chart-based analytical trading idea and is not considered investment advice. Please manage your risks carefully and conduct your own research before making any trading decisions.
EURGBP trade ideas

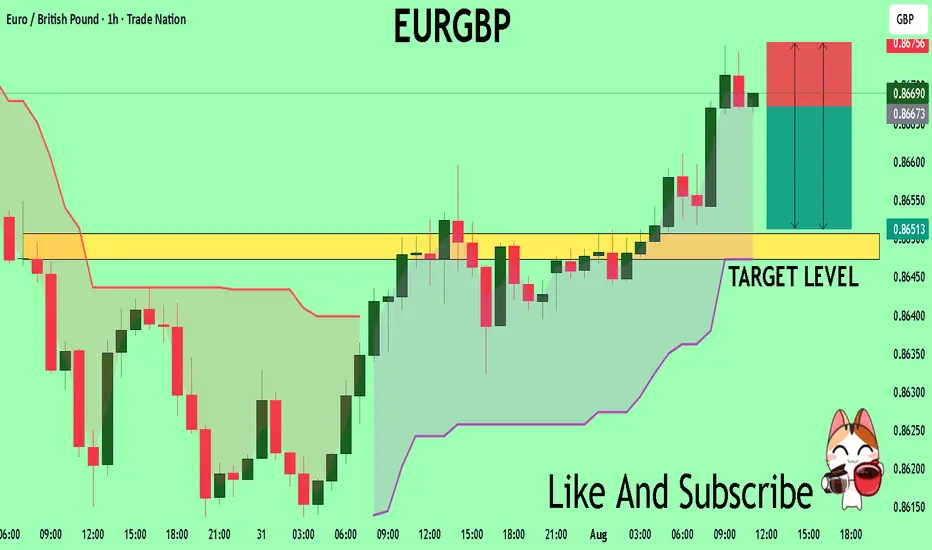
EURGBP | Ready to Ride Again – Just Say the WordI’ve got a lovely 1H bullish range from 0.8632 to 0.8730 — full of promise and potential.
Then came a little 40-pip pullback to 0.8687 — just a small mood swing, nothing serious. 😒
WHAT AM I GOING TO TO DO NOW?
If a bullish candle closes above my 50EMA,
I’m not overthinking — I’m riding the bull like we never broke up! 🐂💥
SL? Depends on the candle’s vibe:
If it’s a strong Marubozu, I’ll trust it like a loyal partner — SL goes just below it.
If stopped out ......!!!
TP? Straight to 0.8930 — no detours, no drama. 🎯
Wish me luck… and a bullish candle that finally knows what it wants.

EURGBP long ideeaso far the price respected the uptrend channel, i try it with a minimum risk and very tight sl.

EurGbp Buy signalEurGbp displaying a buy signal. Currently reacting on the FVG area after clearing liquidity.

EUR-GBP Potential Long! Buy!
Hello,Traders!
EUR-GBP keeps falling down
Towards the horizontal support
Level of 0.8650 and after the
Retest we will be expecting
A local bullish rebound
Buy!
Comment and subscribe to help us grow!
Check out other forecasts below too!
Disclosure: I am part of Trade Nation's Influencer program and receive a monthly fee for using their TradingView charts in my analysis.


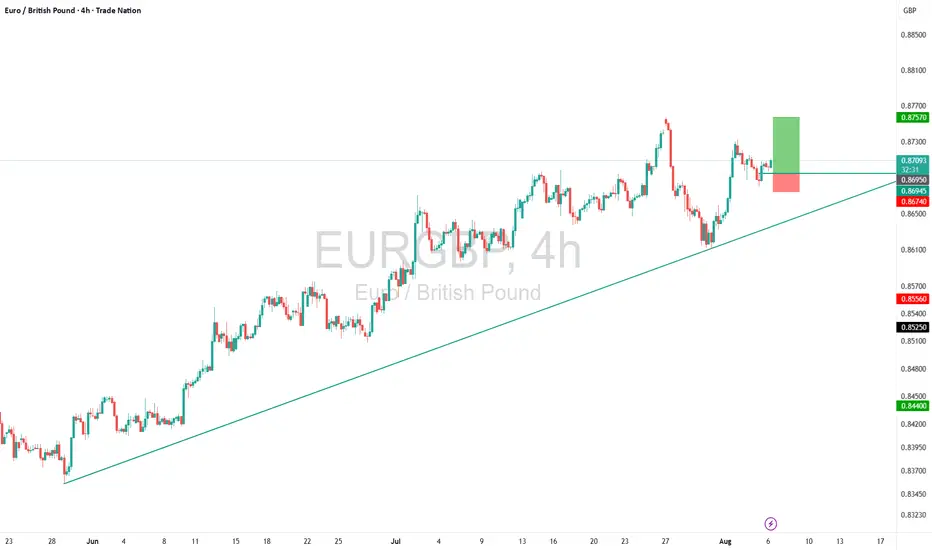
EURGBP – Buy the Dip from Morning Doji Star BaseTrade Idea
Type: Buy Limit
Entry: 0.8695
Target: 0.8757
Stop Loss: 0.8674
Duration: Intraday
Expires: 07/08/2025 06:00
Technical Overview
Morning Doji Star printed at the lows, signalling potential bullish reversal.
Previous resistance at 0.8690 now acts as support; confluence with 20-period 4H EMA at 0.8694.
Short-term bias remains positive; daily signals are bullish.
Structure offers ample risk/reward to buy on a modest pullback toward support.
Key Technical Levels
Resistance: 0.8709 / 0.8731 / 0.8757
Support: 0.8697 / 0.8680 / 0.8660
Disclosure: I am part of Trade Nation's Influencer program and receive a monthly fee for using their TradingView charts in my analysis.
EURGBP: Bearish Continuation from Reclaimed Order Block!Greetings Traders,
In today’s analysis of EURGBP, we observe that institutional order flow on the H4 timeframe has recently shifted bearish. This provides us with a clear directional bias to look for shorting opportunities in line with the prevailing higher timeframe trend.
Higher Timeframe Context:
On the weekly timeframe, price action is currently drawing towards a Weekly Fair Value Gap (FVG). This bearish draw on liquidity confirms the macro-level bearish sentiment. With the recent bearish market structure shift (MSS) on the H4, we now have strong confluence between the weekly and intraday order flow, favoring continued downside.
Key Observations on H4:
Reclaimed Bearish Order Block: After shifting structure to the downside, price has retraced into a bearish reclaimed order block—a region previously marked by institutional selling. This return to the origin of prior sell-side imbalance offers institutions the opportunity to mitigate earlier positions and reinitiate shorts. The failure of price to break higher confirms bearish intent.
Confluence with Weekly Draw: The reclaimed order block aligns with the broader draw towards the weekly FVG, providing an optimal zone for bearish confirmation entries.
Trading Plan:
Entry Strategy: Look for lower timeframe confirmation entries within the H4 reclaimed order block.
Target: The short-term target remains the Weekly Fair Value Gap, supporting a discount-side delivery.
As always, remain disciplined in execution. Let the market confirm your bias before entering, and manage risk according to your rules.
For a detailed market walkthrough and in-depth execution zones, be sure to watch this week’s Forex Market Breakdown:
Kind Regards,
The Architect 🏛️📉

EURGBP-SELL strategy 3D chart GANNThe pair is slightly overbought, and judging the indicators, we may have corrections in the near future, is my personal viewpoint.
Strategy SELL @ 0.8700-0.8740 and take profit near 0.8607 for now.

EURGBP Trend Line SupportEURGBP is Bullish and currently at trend line support we can expect a buy movement in EURGBP.
The pair is bullish and also sentiments are suggesting to go long as retails are short heavily short so we can target their SL at top.
Keep GBP Bank Rates are also upcoming and we can expect a 25 bps cuts to 4% from 4.25% which can make EURGBP fall so keep SL tight.

EURGBP Bullish Momentum Trade PlanWatching EUR/GBP closely 🔍 — after an extended bullish trend 🐂 and a sharp corrective pullback 📉, we’re now seeing renewed upside momentum and signs of bullish continuation 📈. My current bias is long ✅. Price has retraced back into equilibrium, and with movement beginning to pick up, I’m actively hunting for an entry 🎯 — aiming for a retest of the previous high, with stops tucked below the most recent low 🛡️. Everything is broken down in the video and should not be taken as financial advice ⚠️.


EUR/GBP Thief Trade: Swipe Profits Before Overbought Trap!🦹♂️ EUR/GBP "THE CHUNNEL HEIST" – BULLISH LOOT IN PROGRESS! 🚨💰
(Thief Trading Strategy – Escape Before the Cops Arrive!)
🎯 DEAR MARKET PIRATES & PROFIT SNATCHERS,
Based on our 🔥Thief Trading Style Analysis🔥, we’re executing a bullish heist on EUR/GBP ("The Chunnel"). The vault is wide open—time to swipe the loot before the high-risk resistance police barricade (aka overbought trap) shuts us down!
📜 THE MASTER PLAN:
✔ Entry (📈): "The Bullish Vault is Unlocked!"
Buy Limit Orders (15-30min TF) near recent swing lows/highs.
Thief’s DCA Trick: Layer entries like a pro robber—multiple limit orders for max loot.
✔ Stop Loss (🛑): "Hide Your Stash Wisely!"
SL at nearest 4H candle wick (0.86000)—adjust based on your risk appetite & lot size.
Remember: A good thief always has an escape route!
✔ Target (🎯): 0.88000 (or escape earlier if the cops get suspicious!)
🔎 SCALPERS & SWING BANDITS – LISTEN UP!
Scalpers: Stick to LONG-ONLY heists! Use trailing SL to protect profits.
Swing Thieves: If you’re low on cash, join the slow robbery—DCA & hold!
📡 WHY THIS HEIST IS HOT:
Bullish momentum in play (but BEWARE of overbought traps!).
Fundamental Drivers: Check COT Reports, Macro Data, & Sentiment.
🚨 TRADING ALERT: NEWS = POLICE RAID RISK!
Avoid new trades during high-impact news.
Trailing SL = Your Getaway Car! Lock profits before volatility strikes.
💥 BOOST THIS HEIST – STRENGTHEN THE GANG!
👉 Smash the LIKE & BOOST button to fuel our next market robbery!
👉 Follow for more heists—profit awaits! 🚀💰
🦹♂️ Stay Sharp, Stay Ruthless… See You on the Next Heist!

EURGBPMajor Break of Structure (BoS) confirmed on the daily, with a clear rejection from recent highs. Price has aggressively sold off and is now preparing for a retracement into a key supply zone.
🔸 Plan:
Waiting for a pullback toward the 0.8715–0.8740 supply zone (area of interest) to look for signs of bearish continuation.
🔸 BoS confirms shift in trend structure
🔸 STOP: Above the previous high ~0.8825
🔸 Target: Lower lows toward ~0.8500 short term — possible extension toward 0.84xx zone
🧠 RSI shows strong bearish divergence and confirms trend shift.
📌 Setup in progress — will monitor lower timeframes (1H/4H) for entry trigger within zone.

EURGBP Long Swing Trade OANDA:EURGBP Long trade, with my back testing of this strategy, it hits multiple possible take profits, manage your position accordingly.
This is good trade, don't overload your risk like greedy, be disciplined trader, this is good trade.
Use proper risk management
Looks like good trade.
Lets monitor.
Use proper risk management.
Disclaimer: only idea, not advice

EURGBP Will Collapse! SELL!
My dear subscribers,
EURGBP looks like it will make a good move, and here are the details:
The market is trading on 0.8667 pivot level.
Bias - Bearish
My Stop Loss - 0.8675
Technical Indicators: Both Super Trend & Pivot HL indicate a highly probable Bearish continuation.
Target - 0.8650
About Used Indicators:
The average true range (ATR) plays an important role in 'Supertrend' as the indicator uses ATR to calculate its value. The ATR indicator signals the degree of price volatility.
Disclosure: I am part of Trade Nation's Influencer program and receive a monthly fee for using their TradingView charts in my analysis.
———————————
WISH YOU ALL LUCK
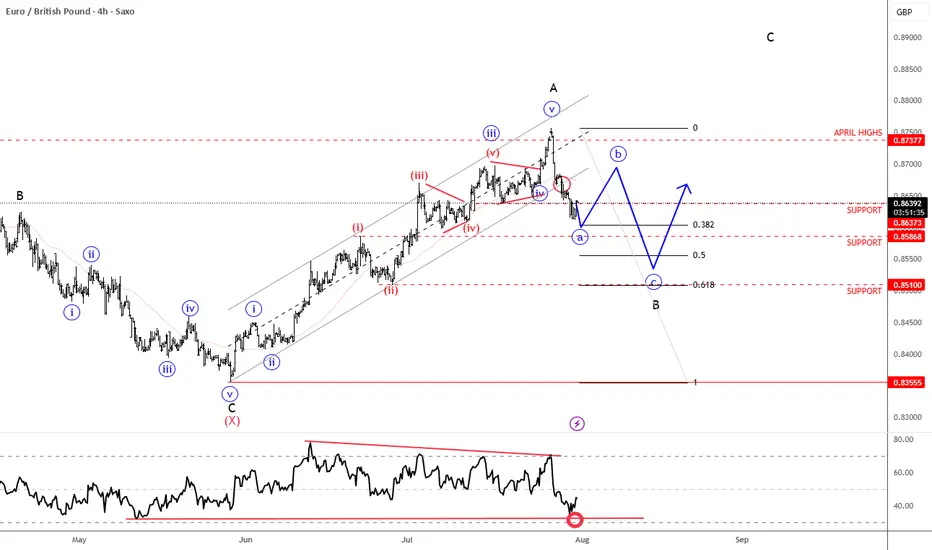
EURGBP Steps Into A Correction Within Ongoing RecoveryEURGBP is sharply down after reaching April highs for wave »v« of an impulse into wave A. As expected, the pair is now unfolding a three-wave abc corrective setback within higher-degree wave B. Currently, EURGBP is breaking below the channel support line in a sharp and impulsive projected wave »a«. A corrective recovery in wave »b« may follow, considering that RSI is already at the lower side of its range. Overall, we are still tracking this correction toward the 0.85x support area, which could act as a base before a potential bullish continuation higher into wave C.
EURGBP, Bullish Breakout!!!EURGBP after getting rejected from the support we can expect again a upside movement.
I am expecting a movement from 0.86500 to 0.8700 at least, we can plan sl below 0.86300.
Safe Player wait for proper breakout and wait for retest of 0.8650 area.

EURGBP CONTINUING BULLISH TREND STRUCTUREEURGBP CONTINUING BULLISH TREND STRUCTURE IN 4H TIME FRAME.
Price is currently in a secondary trend.
Price is expected to end the secondary trend and start primary trend again.
On higher side market may hit the targets of 0.87400
On lower side 0.85950 may act as a key support level.

EURGBP SELL OPPORTUNITY In today’s trading session we’re considering shorting EURGBP from the current market price as we see price rejecting a bearish trendline in H1 timeframe and also making series of lower highs and lower lows. A sell opportunity is envisaged from the current market price.

29.07.25 Morning ForecastPairs on Watch -
FX:EURGBP
FX:AUDUSD
FX:NZDUSD
A short overview of the instruments I am looking at for today, multi-timeframe analysis down to what I will be looking at for an entry. Enjoy!

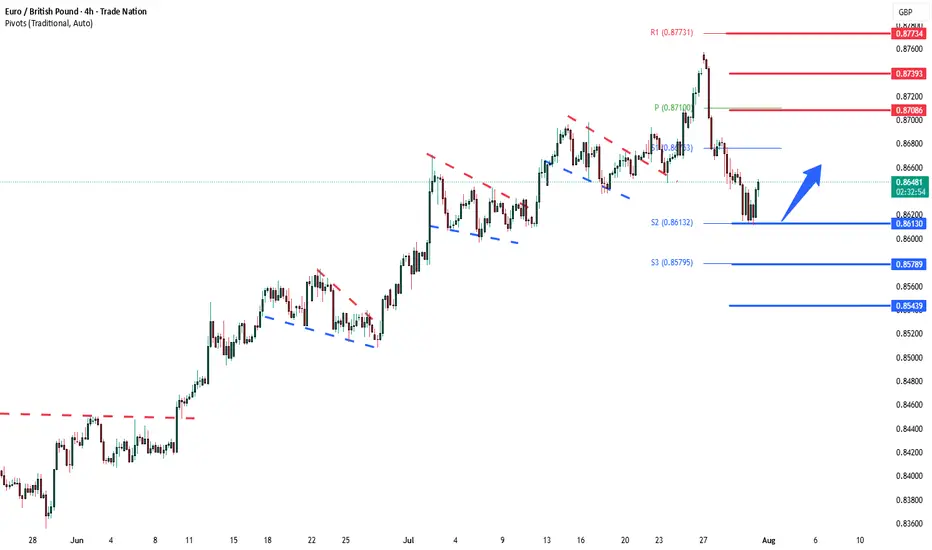
EURGBP key support at 0.8613The EURGBP remains in a bullish trend, with recent price action showing signs of a corrective pullback within the broader uptrend.
Support Zone: 0.8613 – a key level from previous consolidation. Price is currently testing or approaching this level.
A bullish rebound from 0.8613 would confirm ongoing upside momentum, with potential targets at:
0.8708 – initial resistance
0.8740 – psychological and structural level
0.8770 – extended resistance on the longer-term chart
Bearish Scenario:
A confirmed break and daily close below 0.8613 would weaken the bullish outlook and suggest deeper downside risk toward:
0.8580 – minor support
0.8544 – stronger support and potential demand zone
Outlook:
Bullish bias remains intact while the EURGBP holds above 0.8613 A sustained break below this level could shift momentum to the downside in the short term.
This communication is for informational purposes only and should not be viewed as any form of recommendation as to a particular course of action or as investment advice. It is not intended as an offer or solicitation for the purchase or sale of any financial instrument or as an official confirmation of any transaction. Opinions, estimates and assumptions expressed herein are made as of the date of this communication and are subject to change without notice. This communication has been prepared based upon information, including market prices, data and other information, believed to be reliable; however, Trade Nation does not warrant its completeness or accuracy. All market prices and market data contained in or attached to this communication are indicative and subject to change without notice.