EURGBP Analysis : Bearish Leg Nearing Completion + Target Zone📍 Overview:
The EURGBP pair has recently provided significant price action signals that suggest a high-probability reversal setup is unfolding. This analysis dives deep into market structure, supply and demand dynamics, and institutional price behavior using MMC principles.
The current focus lies in identifying a potential trend reversal opportunity after a sharp decline from a key supply level, as price nears a well-marked Reversal Zone. This detailed breakdown covers each phase to provide clarity and trade planning.
🧩 Phase 1: Consolidation Phase (Accumulation)
From July 11th to July 24th, EURGBP moved sideways within a clearly defined range-bound structure (highlighted in green).
This consolidation indicates a battle of control between bulls and bears, typically signaling accumulation or distribution depending on breakout direction.
The tight price action and wicks on both sides suggest market makers accumulating positions before a breakout.
Price eventually broke out to the upside, confirming bullish accumulation rather than distribution.
🚀 Phase 2: Impulse Move & 2x Supply Rejection
Following the breakout from the consolidation, price experienced a strong impulsive rally, catching breakout traders and pushing into a major supply zone.
The area where price reversed is marked as a 2x supply rejection zone, suggesting heavy institutional sell orders were triggered.
This zone aligns with a historical resistance level and is critical in the current structure.
Price failed to sustain the bullish momentum, forming a sharp drop right after tapping into supply, indicating strong selling pressure.
🔄 Phase 3: Market Structure Shift via QFL (Quick Flip Levels)
As the price dropped from the supply zone, two significant QFL levels were printed in quick succession.
QFL (Quick Flip Levels) represent a break in internal structure, showing that buyers were no longer defending the previous support zones.
These quick flips signal an aggressive shift in momentum from buyers to sellers.
Each QFL breakdown was followed by a new lower low, confirming the start of a bearish sequence or trend leg.
📉 Phase 4: Descending Trendline & Dynamic Resistance
After the QFL shifts, a clear downtrend channel formed, respected by multiple lower highs.
The descending trendline drawn from the supply zone peak has acted as dynamic resistance, rejecting every bullish pullback attempt.
This trendline provides technical confluence for intraday traders to manage risk and timing entries.
🟠 Current Market Context: Entering the Reversal Zone
Price is now approaching a marked Reversal Zone (highlighted in orange).
This zone represents a high-probability demand area, previously respected as a base before the rally to supply.
If price reaches this area and shows signs of exhaustion (e.g., bullish engulfing, long wick rejection, volume divergence), it may serve as a reversal point.
This zone aligns with MMC logic — market makers tend to react at zones of trapped liquidity, especially after stop hunts.
📈 Projected Scenario & Trade Setup:
Price drops into the Reversal Zone
A bullish rejection pattern appears (e.g., pin bar, engulfing candle)
Price retests and breaks the descending trendline to confirm a momentum shift
Entry can be taken post-breakout or with aggressive confirmation inside the zone
Stops placed below the zone; targets aligned with the previous QFL or trendline retest
⚠️ Key Notes for Traders:
Don't chase the move. Wait for reversal confirmation before entering.
QFLs offer strong structure-based levels to identify where the market flipped.
Use trendline confluence and volume confirmation for precise entries.
Monitor price action in the Reversal Zone — if invalidated, the downtrend may extend toward the next macro support.
Apply proper risk management and stay patient for the setup to fully develop.
📊 Summary:
🧭 Bias: Short-term bearish → possible reversal bullish
🎯 Entry Area: Reversal Zone (0.85800 – 0.86000 approx.)
⛔ Invalidation: Clean break and close below 0.85700
🏁 Potential Target: First TP near 0.86750; extended TP near 0.87050 (previous QFL level)
🔄 MMC Approach Recap:
This analysis follows the Market Maker Cycle (MMC) method, which involves:
Consolidation (Accumulation)
Manipulation (False Breakouts or Stop Hunts)
Distribution (Rapid Expansion & Flip Levels)
Re-Accumulation or Reversal
Each step is clearly defined in this chart, offering a blueprint for both trend traders and reversal specialists.
💬 Let's Talk:
What do you think about this setup? Are you seeing similar MMC patterns on other EUR or GBP crosses?
Drop your thoughts, charts, and questions below!
EURGBP trade ideas

Sell EURGBP now for a quick scalping Sell EURGBP now for a quick scalping ...... looking for 20 pips plus on profit target here
EURGBP Bearish Breakout!
HI,Traders !
#EURGBP broke the rising
Support line and the breakout
Is confirmed so we are
Bearish biased and we
Will be expecting a
Further move down !
Comment and subscribe to help us grow !

EURGBP Wave Analysis – 29 July 2025- EURGBP reversed from the resistance zone
- Likely fall to support level 0.8635
EURGBP currency pair recently reversed down from the resistance zone between the multi-month resistance level 0.8735 (which stopped sharp wave (A) in April) and the upper daily Bollinger Band.
The downward reversal from this resistance zone created the daily Japanese candlesticks reversal pattern Dark Cloud Cover.
Given the strength of the resistance level 0.8735, EURGBP currency pair can be expected to fall to the next support level 0.8635 (low of the previous minor correction ii).


Sell eurgbpStrong sell expected as euro ready to weak across all cross pairs
Weekly daily overbought pair
Ready for the bearish correction

EUR/GBP OUTLOOK ON THE DAILYOn the daily timeframe, price retested a key resistance zone on Friday, which was previously tapped in April. This level originally acted as a demand area back in November 2023.
After the April rejection, price dropped approximately 381 pips before beginning its current bullish incline. As of now, price is retesting this resistance area, which is expected to flip into support to allow for continued upward momentum.
My bias remains bullish as long as this support holds, with a target toward the next demand area from March 2023.
However, a break below the daily swing low at 0.85963 would invalidate this scenario and shift the structure.
⚠️ As always, trade responsibly — risk only 1–2% of your capital per day and stay alert, especially around volatile sessions.
Stay sharp and trade safe!

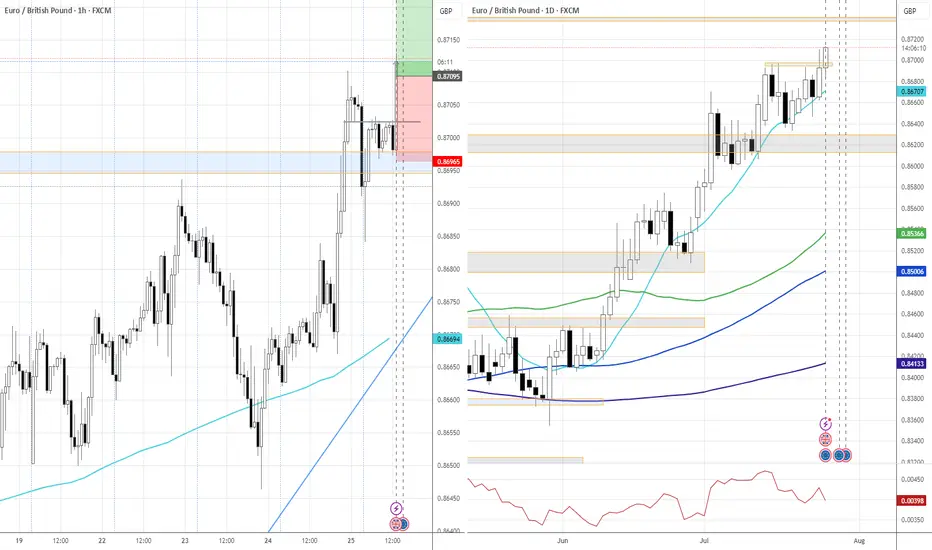
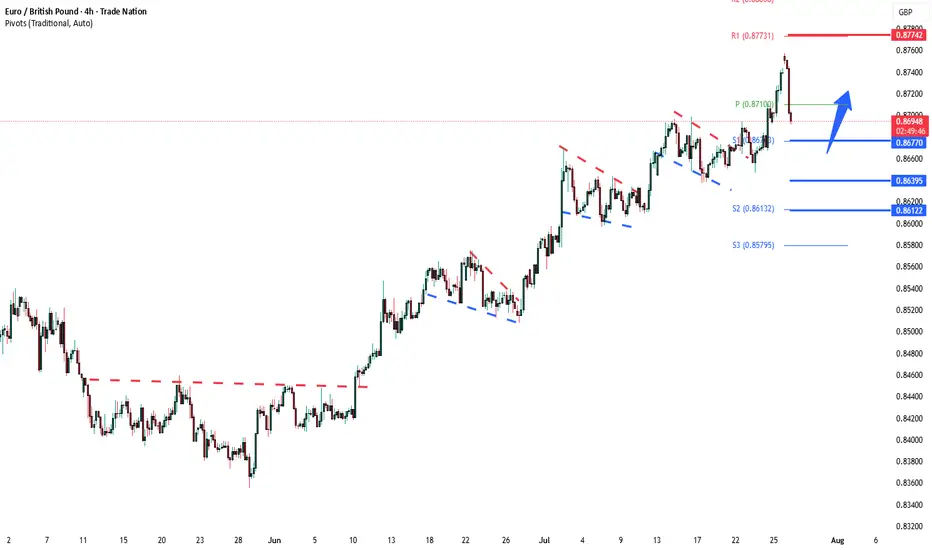
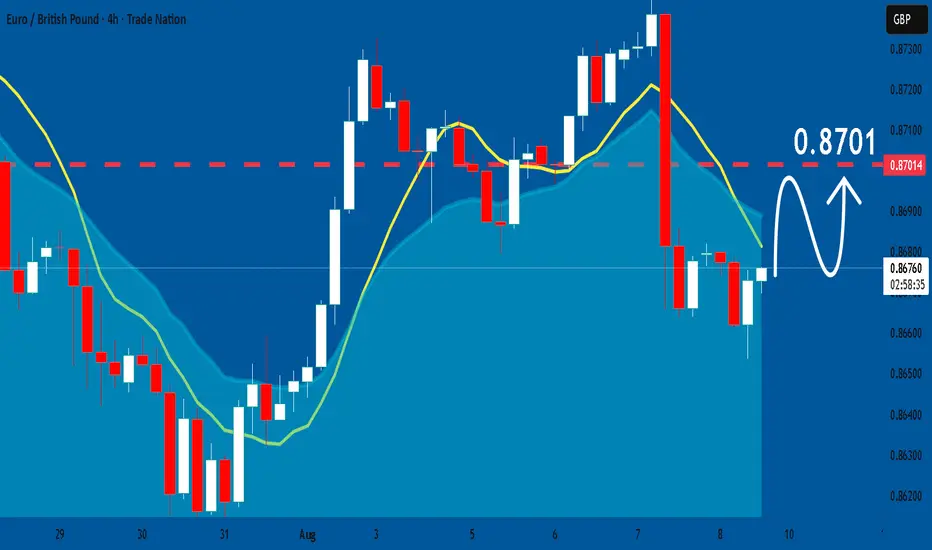
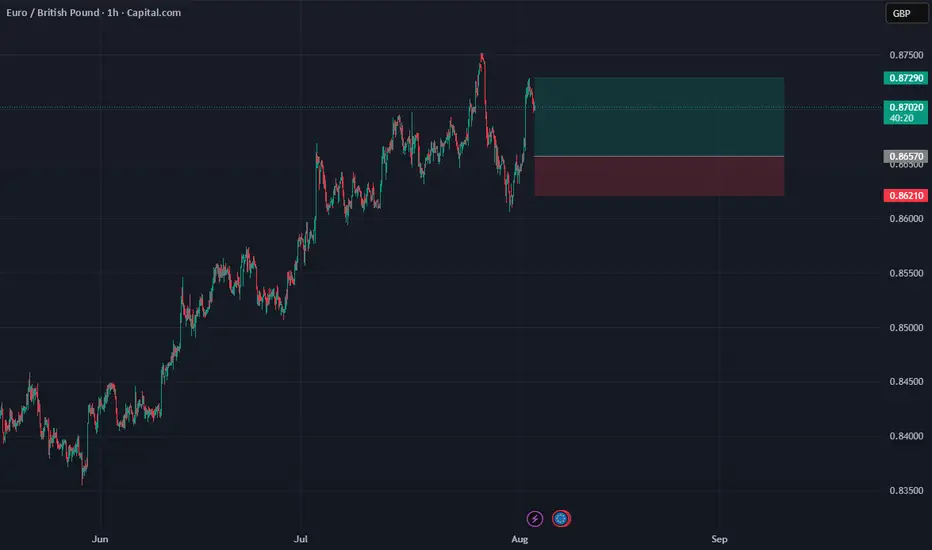
EURGBP overbought pullback support at 0.8677The EURGBP remains in a bullish trend, with recent price action showing signs of a corrective pullback within the broader uptrend.
Support Zone: 0.8677 – a key level from previous consolidation. Price is currently testing or approaching this level.
A bullish rebound from 0.8677 would confirm ongoing upside momentum, with potential targets at:
0.8775 – initial resistance
0.8807 – psychological and structural level
0.8845 – extended resistance on the longer-term chart
Bearish Scenario:
A confirmed break and daily close below 0.8677 would weaken the bullish outlook and suggest deeper downside risk toward:
0.8640 – minor support
0.8612 – stronger support and potential demand zone
Outlook:
Bullish bias remains intact while the GBPUSD holds above 0.8677 A sustained break below this level could shift momentum to the downside in the short term.
This communication is for informational purposes only and should not be viewed as any form of recommendation as to a particular course of action or as investment advice. It is not intended as an offer or solicitation for the purchase or sale of any financial instrument or as an official confirmation of any transaction. Opinions, estimates and assumptions expressed herein are made as of the date of this communication and are subject to change without notice. This communication has been prepared based upon information, including market prices, data and other information, believed to be reliable; however, Trade Nation does not warrant its completeness or accuracy. All market prices and market data contained in or attached to this communication are indicative and subject to change without notice.
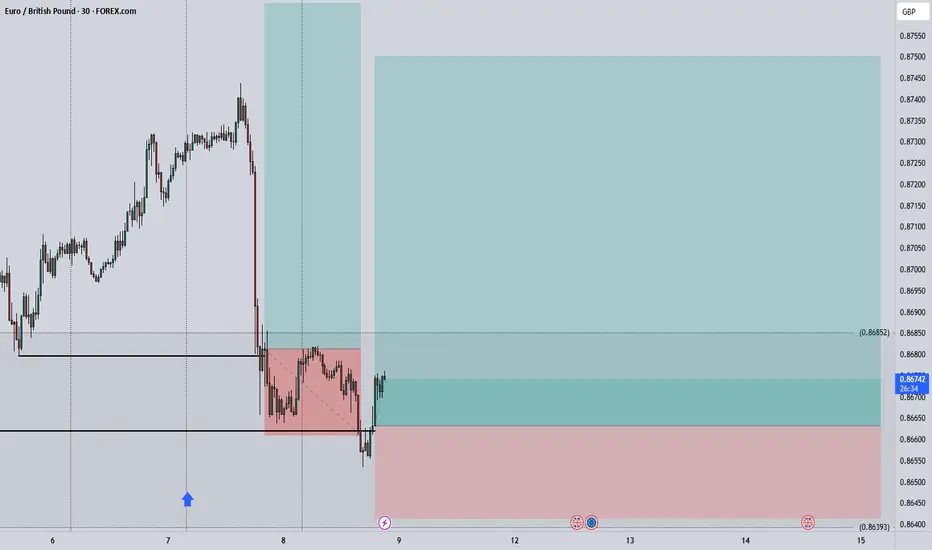
DeGRAM | EURGBP exited the channel📊 Technical Analysis
● Breakout: price burst from the July descending wedge, reclaimed 0.8695 former cap, and is now riding a steep intraday channel of higher-highs; the channel mid-line aligns with the broken wedge roof, adding fresh support.
● A pennant is consolidating just above 0.8695; its measured pole and the outer channel top converge at the next horizontal barrier 0.8739.
💡 Fundamental Analysis
● Softer UK July composite-PMI (47.9 vs 50.2 prior) revived BoE cut bets, while ECB speakers flagged “premature to talk easing,” narrowing the rate gap in the euro’s favour.
✨ Summary
Long 0.8695-0.8705; pennant break targets 0.8739. Bias void on a 30 m close below 0.8648.
-------------------
Share your opinion in the comments and support the idea with like. Thanks for your support!


EURGBP Long ProjectHi guys...😎
It's time to do a Long Project on EURGBP with 3 key reasons:
1. Price Drivers: Daily Demand
2. Trend: up
3. Momentum: bullish
Action: waiting for entry on the intraday timeframe (entry will be published further)

EURGBP 2nd Buy EntryEntry: 0.86633
Take Profit (4R): 0.87501
Stop Loss (R): 0.86416
*Sorry, I'm late to post due to being out of the computer
EURGBP 1 H longOnly chart I'm interested in next week, IF the price falls down like I want. otherwise I happy to skip this setup :)
What do I want to see? Like the start of the downtrend long red candles rushing to the support line. No consolidation. When that happens my buy orders are waiting at he the support line all the way down till the trend starts bullish again.

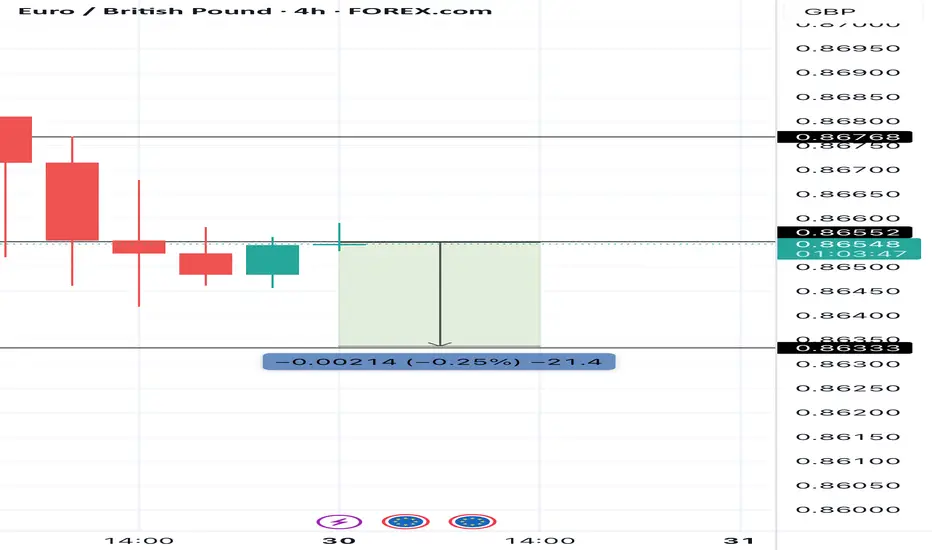
EUR/GBP Daily AnalysisPrice has rejected the 0.8730 zone after a couple of failed attempts from the buyers.
After 2 solid days of selling, we may see a temporary correction where there could be opportunities to sell at a higher price.
Support at 0.8610 may be a target aim for.
Look for a trade setup that meets your rules if you agree with this analysis.

EURGBP: Bullish Forecast & Bullish Scenario
The analysis of the EURGBP chart clearly shows us that the pair is finally about to go up due to the rising pressure from the buyers.
Disclosure: I am part of Trade Nation's Influencer program and receive a monthly fee for using their TradingView charts in my analysis.
❤️ Please, support our work with like & comment! ❤️
EURGBP Setup So Clear It Feels IllegalHey, it’s Skeptic.
Spotted a super clean breakout forming on EURGBP — and it lines up across multiple tools (RSI, 7SMA, momentum candles).
In this video, I’ll walk you through the daily trend, explain why I’m only looking for longs, and show the exact 15m trigger I’m watching.
No hype, no FOMO, just reason.
If it helps, boost it. Appreciate you 🫡
Disclaimer: This is not financial advice. Do your own research, manage your risk, and stay sharp out there.

The Day AheadFriday, August 8 – Summary
Data Highlights:
China: Released Q2 Balance of Payments (BoP) data for the current account, providing insight into trade and capital flows.
Japan: A data-heavy day with the July Economy Watchers Survey, bank lending figures, June household spending, and BoP data (both trade and current account balances), offering a comprehensive view of economic momentum and consumer behavior.
Canada: Published its July jobs report, closely watched for signs of labor market strength and implications for monetary policy.
Central Banks:
Federal Reserve: St. Louis Fed President Musalem delivered remarks, potentially offering forward guidance on rate paths or economic risks.
Bank of Japan: Released the Summary of Opinions from the July policy meeting, shedding light on internal policy debates and inflation outlooks.
Earnings:
Munich Re: Reported quarterly results, providing insight into the state of the reinsurance sector amid global catastrophe exposure.
Wendy’s: Posted earnings, reflecting consumer demand trends and cost pressures in the fast food sector.
This communication is for informational purposes only and should not be viewed as any form of recommendation as to a particular course of action or as investment advice. It is not intended as an offer or solicitation for the purchase or sale of any financial instrument or as an official confirmation of any transaction. Opinions, estimates and assumptions expressed herein are made as of the date of this communication and are subject to change without notice. This communication has been prepared based upon information, including market prices, data and other information, believed to be reliable; however, Trade Nation does not warrant its completeness or accuracy. All market prices and market data contained in or attached to this communication are indicative and subject to change without notice.

ENTRY EURGBPDisclaimer:
This is merely a chart-based analytical trading idea and is not considered investment advice. Please manage your risks carefully and conduct your own research before making any trading decisions.

EURGBP Short – Liquidity Grab & CHoCH at SupplyIf we go on tha W1 TF we see a significant price action From the Smart Money Concepts (SMC) perspective, this candlestick formation shows a classic example of how institutional traders manipulate liquidity to shift market direction. The strong bullish candle represents an inducement phase, where retail traders are encouraged to go long as price pushes higher. This creates buy-side liquidity above the recent high.
Following that, the next candle sharply wicks below the previous bullish candle’s low. This is a liquidity grab—smart money is targeting the sell-side liquidity (stop-losses of buyers) resting just below that low. Even though price briefly breaks down, it closes higher, signaling that the move down was not genuine but rather a manipulation to trap retail traders.
The third candle then confirms a change in momentum. It fails to make a new high and closes bearish, indicating a possible shift in market structure. At this point, the bullish trend has likely been broken, and smart money is now preparing to sell after accumulating positions from retail traders. This change of character marks the beginning of a potential bearish move.

EURGBP EURGBP- 2 main roadmaps. ABC and abc structures could be complete. decision can be made on a high probability entry signal at zone.

EUR/GBP SHORT - SELL IDEAWe took advantage of the long position shared earlier on EUR/GBP 💰, and now the trend has shifted — we're currently shorting 📉.
🗞 Yesterday, the Bank of England cut interest rates from 4.25% to 4.00% 🇬🇧.
The decision wasn’t unanimous among the 9 members of the Monetary Policy Committee (MPC): 5 voted in favor of the cut and 4 against, whereas markets had expected a much stronger majority of 8 to 1.
