EURGBP INTRADAY consolidation around 0.8300The EURGBP currency pair price action sentiment appears bearish, supported by the longer-term prevailing downtrend.
The key trading level is at 0.8320. An oversold rally from the current levels and a bearish rejection from the 0.8320 level could target the downside support at 0.8260 followed by the 0.8250 and 0.8220 levels over the longer timeframe.
Alternatively, a confirmed breakout above the 0.8320 resistance and a daily close above that level could trigger further rallies higher and a retest of the 0.8350 resistance level followed by 0.8367.
This communication is for informational purposes only and should not be viewed as any form of recommendation as to a particular course of action or as investment advice. It is not intended as an offer or solicitation for the purchase or sale of any financial instrument or as an official confirmation of any transaction. Opinions, estimates and assumptions expressed herein are made as of the date of this communication and are subject to change without notice. This communication has been prepared based upon information, including market prices, data and other information, believed to be reliable; however, Trade Nation does not warrant its completeness or accuracy. All market prices and market data contained in or attached to this communication are indicative and subject to change without notice.
EURGBP trade ideas

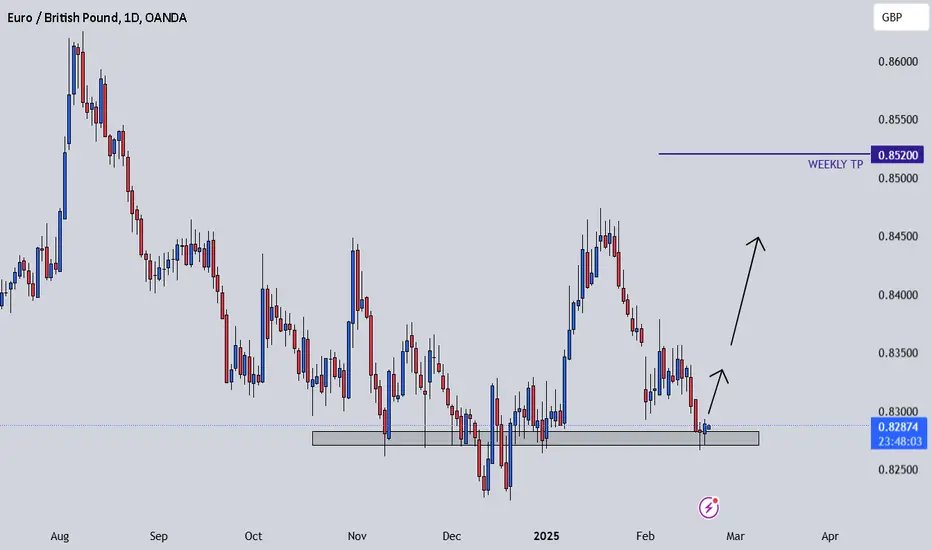
EUR/GBP "The Chunnel" Forex Market Bullish Heist Plan🌟Hi! Hola! Ola! Bonjour! Hallo!🌟
Dear Money Makers & Thieves, 🤑 💰🐱👤🐱🏍
Based on 🔥Thief Trading style technical and fundamental analysis🔥, here is our master plan to heist the EUR/GBP "The Chunnel" Forex market. Please adhere to the strategy I've outlined in the chart, which emphasizes long entry. Our aim is the high-risk Red Zone. Risky level, overbought market, consolidation, trend reversal, trap at the level where traders and bearish robbers are stronger. 🏆💸Book Profits, Be wealthy and safe trade.💪🏆🎉
Entry 📈 : "The heist is on! Wait for the MA breakout (0.83700) then make your move - Bullish profits await!"
however I advise to placing the Buy Stop Orders above the breakout MA or placing the Buy limit orders within a 15 or 30 minute timeframe. Entry from the most recent or closest low or high level should be in retest.
Stop Loss 🛑: Thief SL placed at 0.83200 (swing Trade Basis) Using the 4H period, the recent / Swing Low or High level.
SL is based on your risk of the trade, lot size and how many multiple orders you have to take.
Target 🎯: 0.85100 (or) Escape Before the Target
🧲Scalpers, take note 👀 : only scalp on the Long side. If you have a lot of money, you can go straight away; if not, you can join swing traders and carry out the robbery plan. Use trailing SL to safeguard your money 💰.
📰🗞️Fundamental, Macro, COT, Sentimental Outlook:
EUR/GBP "The Chunnel" Forex Market market is currently experiencing a bullish trend,., driven by several key factors.
🎇Fundamental Analysis
The EUR/GBP pair is influenced by the interest rate differential between the European Central Bank (ECB) and the Bank of England (BoE). The ECB's main refinancing rate remains at 0.0%, while the BoE's base rate stands at 3.5%. Recent economic indicators show Eurozone Q2 GDP growth rate slowing to 0.2% quarterly and 1.1% annualized, while UK Q2 GDP growth rate remains at 0.4% quarterly and 2.1% annualized.
🎇Macroeconomic Analysis
GDP Growth Rate: Eurozone Q2 GDP growth rate slowed to 0.2% quarterly, 1.1% annualized; UK Q2 GDP growth rate at 0.4% quarterly, 2.1% annualized.
Inflation Rate: Eurozone July inflation rate at 1.0% annualized; UK July inflation rate at 1.5% annualized.
Unemployment Rate: Eurozone unemployment rate at 7.5%; UK unemployment rate at 3.9%.
Trade Balance: Eurozone trade surplus at €24.6 billion; UK trade deficit at £-14.8 billion.
🎇COT Data Analysis
Institutional Traders: 55% long, 45% short.
Retail Traders: 52% short, 48% long.
Large Banks: 57% long, 43% short.
Hedge Funds: 50% long, 50% short.
🎇Market Sentimental Analysis
Market Sentiment: 40% bullish, 60% bearish.
Trader Sentiment: 29% long, 71% short.
Option Skew: 25-delta put option skew at 10.5.
🎇Positioning Data Analysis
Bullish Trend: 45% likely.
Bearish Trend: 55% likely.
Neutral Trend: 10% likely.
🎇Technical Analysis
Moving Averages: 50-day MA indicating 45% bearish trend.
Relative Strength Index (RSI): 40, signaling 60% oversold conditions.
Bollinger Bands: Lower band breakout.
🎇Overall Outlook
The EUR/GBP pair is experiencing a bearish trend, with potential buying opportunities at 0.83700. However, some analysts predict a bullish continuation, targeting 0.85100. The pair's technical outlook points to a buildup of bearish momentum as markets turn cautious ahead of US President Donald Trump's trade policy and Federal Reserve Chairman Jerome Powell's testimony.
⚠️Trading Alert : News Releases and Position Management 📰 🗞️ 🚫🚏
As a reminder, news releases can have a significant impact on market prices and volatility. To minimize potential losses and protect your running positions,
we recommend the following:
Avoid taking new trades during news releases
Use trailing stop-loss orders to protect your running positions and lock in profits
📌Please note that this is a general analysis and not personalized investment advice. It's essential to consider your own risk tolerance and market analysis before making any investment decisions.
📌Keep in mind that these factors can change rapidly, and it's essential to stay up-to-date with market developments and adjust your analysis accordingly.
💖Supporting our robbery plan will enable us to effortlessly make and steal money 💰💵 Tell your friends, Colleagues and family to follow, like, and share. Boost the strength of our robbery team. Every day in this market make money with ease by using the Thief Trading Style.🏆💪🤝❤️🎉🚀
I'll see you soon with another heist plan, so stay tuned 🤑🐱👤🤗🤩

EUR/GBP: Key Support Test Amid Bearish PressureThe analysis of EUR/GBP as of February 24, 2025, presents an interesting technical outlook. The price is testing a key support area around 0.8297 after a modest recovery from the 0.8271 lows. The current setup suggests a potential reaction in this zone, with the possibility of a technical rebound towards higher levels or a more significant bearish breakdown.
From a technical perspective, several key areas stand out: the upper resistance in the 0.8440-0.8460 range represents a critical level for a bullish recovery, while the lower support around 0.8265-0.8240 could act as a catalyst for further downside momentum if broken. Moving average analysis indicates persistent bearish pressure, with both the 50 and 200-period moving averages sloping downward. This reinforces the idea that, despite recent rebounds, the dominant trend remains bearish in the medium term.
From a macroeconomic standpoint, expectations regarding the UK and Eurozone economic outlook are shaping the pair's direction. UK inflation is showing signs of recovery, providing some support for the pound, but uncertainties related to economic growth and Bank of England policies could hinder a sustained strengthening of the British currency. On the other hand, the Eurozone is facing challenges linked to growth stagnation, and the ECB may maintain an accommodative policy to stimulate the economy. These factors create an unstable balance that could lead to heightened volatility in the coming days.
Technical forecasts suggest two possible scenarios: a temporary rebound towards 0.8340-0.8360 before another test of the lows or a direct break below 0.8265, which could open the door for a decline towards 0.8240-0.8220.

EURGBP: Time For Correction?!After a significant downward movement, EURGBP traded in a tight range on the 4-hour chart for some time.
Earlier today, the pair broke above the upper boundary of the range.
I believe that a corrective move could be on the horizon now.
The nearest resistance level is at 0.8319.

Buy EURGBP now!!!!!Price broke out of consolidation with strong bullish momentum. I expect price to continue to the upside. Might get a slight pulback close to entry within the next 12hours, but ultimately price will continue being bullish and head to the upside

EURGBP - 23/02/25EURGBP - 23/02/25 Ideas for the coming week. Will update the comments if any trades come in to play.

EURGBP Short SetupEURGBP Analysis
The EUR/GBP pair is exhibiting a bearish trend on the higher time frames, which is favorable for our analysis. The market has formed a series of lower highs and lower lows, confirming the downward momentum. Currently, the price is testing a strong resistance level that has been retested, presenting a critical juncture. At this point, it is prudent to adopt a wait-and-see approach to observe how the market interacts with this level. A break above the resistance could invalidate our bearish setup, while a rejection and consolidation below this level would reinforce the likelihood of the bearish trend continuing.
We will monitor the market's behavior closely. I hope you all had a profitable trading week, and I wish you a pleasant and restful weekend ahead.
Cheers!

My EURGBP Short idea 21/2/2025EURGBP is bearish on Edgefinder and the fundamental economic data all point out to a bearish momentum for the EURGBP. The pound has been strengthening and a modest amount of volume is present to short this trade.
I am having tight loss on this but optimistic on this trade so far. ECB is looking forward to cut more rates, cautiously though. Meanwhile BOE are taking an easing approach which may strengthen the Pound.

EURGBP 4H Channel Down topped. Drop expected.The EURGBP pair has been trading within a Channel Down pattern below its 4H MA50 (blue trend-line) since the February 12 High. Technically that pattern is similar to the Channel Down of late January, which saw an accelerated decline after it failed to break above the 4H MA50.
We expect the pattern to complete a similar -2.18% decline and target 0.81750.
-------------------------------------------------------------------------------
** Please LIKE 👍, FOLLOW ✅, SHARE 🙌 and COMMENT ✍ if you enjoy this idea! Also share your ideas and charts in the comments section below! This is best way to keep it relevant, support us, keep the content here free and allow the idea to reach as many people as possible. **
-------------------------------------------------------------------------------
Disclosure: I am part of Trade Nation's Influencer program and receive a monthly fee for using their TradingView charts in my analysis.
💸💸💸💸💸💸
👇 👇 👇 👇 👇 👇

$EURGBP Bearish Breakdown or Bullish Reversal in the Making?PEPPERSTONE:EURGBP
The pair is showing signs of weakness, with price action flirting with a potential break below 0.8265. If this level gives way , the pair could retest mid-December lows and the weekly fractal support at 0.8222.
We may see the formation of a bullish Crab pattern, projecting a reaction near 0.8237, just above key support. Should this harmonic setup play out, a bullish rebound could target the previous support at 0.8291, now acting as resistance after the recent fractal formation.
📌 Key Levels to Watch:
🔻 Break below 0.8265 could open the door to further downside.
🦀 Potential Bullish Crab pattern forming near 0.8237.
📈 Upside reaction could aim for 0.8291 (previous support turned resistance).
⚠️ Confirmation required—price action at these key levels will be critical.
📢 Final Note: At this stage, I remain neutral on PEPPERSTONE:EURGBP
A confirmed break below 0.8265 could shift the bias to bearish, while the formation of the bullish Crab pattern should be monitored with caution.🚦
Happy Trading,
André cardoso
Risk Warning: Trading financial assets carries a high level of risk and may result in the loss of all your capital. Make sure to fully understand the risks involved before you start trading and carefully consider your investment objectives, level of experience, and risk tolerance. The data and information provided in this content do not constitute financial or investment advice and should not be considered as such. Only invest what you can afford to lose, and be aware of the risks associated with trading financial assets.

The Day Ahead 21st Feb '25 Friday February 21
Data: US, UK, Japan, Germany, France and the Eurozone February PMIs, US January existing home sales, UK February GfK consumer confidence, January public finances, retail sales, France February manufacturing confidence, Canada December retail sales
Central banks: Fed's Jefferson speaks, ECB's Lane speaks
Earnings: Air Liquide, Sika, Standard Chartered
This communication is for informational purposes only and should not be viewed as any form of recommendation as to a particular course of action or as investment advice. It is not intended as an offer or solicitation for the purchase or sale of any financial instrument or as an official confirmation of any transaction. Opinions, estimates and assumptions expressed herein are made as of the date of this communication and are subject to change without notice. This communication has been prepared based upon information, including market prices, data and other information, believed to be reliable; however, Trade Nation does not warrant its completeness or accuracy. All market prices and market data contained in or attached to this communication are indicative and subject to change without notice.

Long positions for next 3 weeksUse proper risk management
Looks like good trade.
Lets monitor.
Use proper risk management.
Disclaimer: only idea, not advice.

possibility of uptrendIt is expected that the correction will continue and then we will see the start of the upward trend.
If the price crosses the 100% level, the continuation of the downward trend will be likely.

ABOUT EURGBPMy option about EURGBP Is more bearish so that zone is good and strong restanice if the price comes to that zone it can pullback

EURGBP LONGDAILY
- big inv hs
- shoulder 2 region
- bullish candle close
- big BM
4 HOUR
- inv hs
WEEKLY
- buy zone
BULLSpreviously it was buying, it is now going the strong demand zone that there is bullish orderblock. we wait if it will tap the zone and wait for reversal signals.

SellPrice is approaching qml at our demand zone we will buy there according to smc and rebuy after breakout as falcon

Inverted head and shoulders pattern Hi traders, I am pretty new in the grand scheme of trading experience but, super quick to learn.
this bull-pin at the bottom of a down trend, signaling possible reversal. with now a conformation of inverted HNS pattern to the upside. Its testing the next line now... What do yall think? This is my first post.

EUR/GBP: Key Support at 0.8230 Could Trigger UptrendThe EUR/GBP pair has been falling steadily and recently reached 0.8230, its lowest point in over 3 years. The last time the price touched this level was in March 2022, which marked the start of a strong upward trend. This makes 0.8230 an important support level where the price could bounce back.
We believe this could be the beginning of a uptrend, and we're aiming for two key targets:
1. First Target (TP1) : 0.8445
This is the first resistance level where the price might pause.
2. Second Target (TP2) : 0.8610
If the first resistance is broken, this is the next level we expect the price to reach.
Watch the price closely around 0.8230. If it starts moving up, that could confirm the trend change. Consider setting a stop loss below 0.8230 to manage risk while targeting the levels mentioned above.

EUR/GBP Technical Analysis: Bullish Rebound from Key Support!!Key Observations:
1. Support Zone & Trendline:
A support zone (marked in red) is visible, which aligns with a rising trendline. The price has tested this area and bounced upwards, suggesting demand at this level.
2. Bullish Rejection & Confirmation:
The recent price action shows rejection of lower prices within the support zone.
A bullish candle has emerged after the price tested this zone, hinting at potential upside momentum.
3. Moving Average Resistance:
The 200-day EMA (Exponential Moving Average) at 0.84058 acts as a significant resistance level.
If the price sustains above the trendline and support zone, a potential retest of the 200 EMA is likely.
4. Price Target & Direction:
The blue arrow suggests an expected bullish move.
The immediate target is around 0.8400 - 0.8450, where the 200 EMA and previous price action resistance exist.
Conclusion & Trading Plan:
Bullish Bias: As long as the price holds above the trendline and support zone, further upside is favored.
Breakout Confirmation: A daily close above 0.8350 could further confirm bullish momentum.
Bearish Scenario: If the price breaks below the trendline and support zone, it could trigger a bearish move toward 0.8250.

eurgbp|foxforexEURGBP broke its rising trend on its 4-hour chart. Its currently about to retest this breakout. I made a short with the breakout and will increase my lots after the retest.

EURGBP Pair Breakdown 18/2/2025Hello this is my EURGBP Pair Breakdown 18/2/2025. Curious for your feedback

EUR/GBP BUYERS WILL DOMINATE THE MARKET|LONG
Hello, Friends!
EUR/GBP is making a bearish pullback on the 6H TF and is nearing the support line below while we are generally bullish biased on the pair due to our previous 1W candle analysis, thus making a trend-following long a good option for us with the target being the 0.835 level.
✅LIKE AND COMMENT MY IDEAS✅
