EURGBP trade ideas

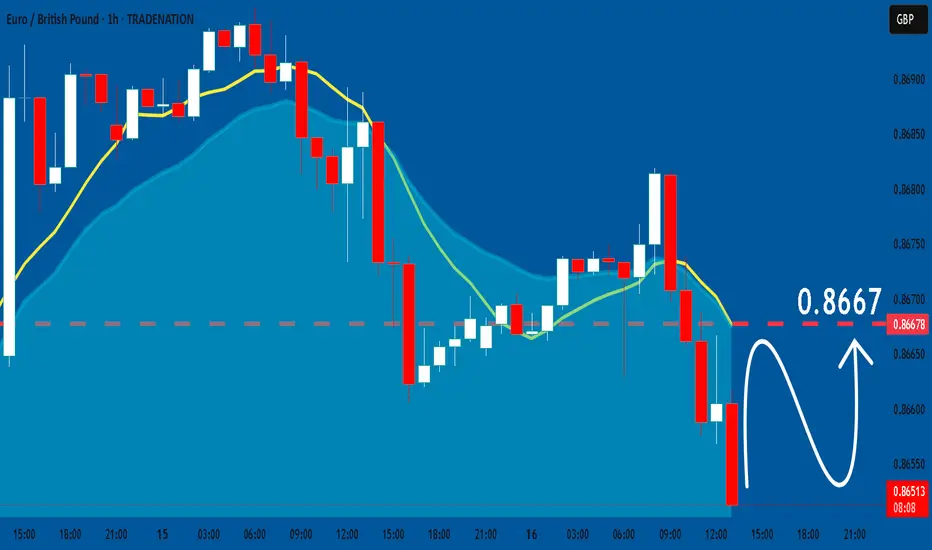
EURGBP 1st Buy EntryEntry: 0.86651
Stop Loss (R): 0.86497
Take Profit (4R): 0.87267
*Disclaimer: I will not accept liability for any loss or damage, including without limitation to any loss of profit, which may arise directly or indirectly from use of or reliance on such information.

Possibility of uptrend It is expected that a trend change will take place within the current support area and we will witness the start of an uptrend. Then, the uptrend will continue to the identified resistance area.

EURGBP bullish flag developing The EURGBP remains in a bullish trend, with recent price action showing signs of a corrective pullback within the broader uptrend.
Support Zone: 0.8620 – a key level from previous consolidation. Price is currently testing or approaching this level.
A bullish rebound from 0.8620 would confirm ongoing upside momentum, with potential targets at:
0.8700 – initial resistance
0.8715 – psychological and structural level
0.8740 – extended resistance on the longer-term chart
Bearish Scenario:
A confirmed break and daily close below 0.8620 would weaken the bullish outlook and suggest deeper downside risk toward:
0.8600 – minor support
0.8590 – stronger support and potential demand zone
Outlook:
Bullish bias remains intact while the EURGBP holds above 0.8620. A sustained break below this level could shift momentum to the downside in the short term.
This communication is for informational purposes only and should not be viewed as any form of recommendation as to a particular course of action or as investment advice. It is not intended as an offer or solicitation for the purchase or sale of any financial instrument or as an official confirmation of any transaction. Opinions, estimates and assumptions expressed herein are made as of the date of this communication and are subject to change without notice. This communication has been prepared based upon information, including market prices, data and other information, believed to be reliable; however, Trade Nation does not warrant its completeness or accuracy. All market prices and market data contained in or attached to this communication are indicative and subject to change without notice.

I'm currently long on EUR/GBPPrice is currently reacting to a retest of an order block located within the discount zone, following a Shift in Market Structure (SMS).
Additionally, on the weekly timeframe, price is also positioned in the discount zone, aligning with a weekly order block at the same level.
Disclaimer: This is not financial advice—just my personal analysis.

EUR/GBP Maintains Bullish Structure – Key Levels to WatchEUR/GBP Maintains Bullish Structure on 4H Chart – Key Levels to Watch
The EUR/GBP pair continues to exhibit a bullish trend structure on the 4-hour timeframe, with price action currently consolidating in a secondary trend. After a strong upward impulse, the pair has entered a corrective phase, which is expected to conclude before resuming its primary bullish trend.
Key Resistance & Upside Potential
The market remains well-supported, and a breakout above the current consolidation could see prices rally toward the next major target at 0.87400. A sustained move above this level would confirm a continuation of the bullish momentum, potentially opening the door for further upside. Traders should watch for bullish reversal patterns or a strong breakout candle to confirm the resumption of the uptrend.
Critical Support Zone
On the downside, 0.85950 stands as a crucial support level. If the secondary correction extends deeper, this zone could act as a springboard for buyers to re-enter the market. A breakdown below this level, however, could signal a deeper retracement, potentially invalidating the near-term bullish bias.
Market Outlook
Given the prevailing bullish structure, traders should monitor price action around the mentioned levels for potential trading opportunities. A rebound from 0.85950 with strong bullish confirmation (such as a pin bar or engulfing pattern) could present a buying opportunity targeting 0.87400. Conversely, a decisive break below support may require a reassessment of the bullish outlook.
In summary, while the EUR/GBP pair is currently in a corrective phase, the broader trend remains upward. A breakout above resistance or a hold at key support could reignite bullish momentum, making these levels critical for short-to-medium-term trading decisions.

EURGBP Q3 | D21 | W30 | Y25📊EURGBP Q3 | D21 | W30 | Y25
Daily Forecast 🔍📅
Here’s a short diagnosis of the current chart setup 🧠📈
Higher time frame order blocks have been identified — these are our patient points of interest 🎯🧭.
It’s crucial to wait for a confirmed break of structure 🧱✅ before forming a directional bias.
This keeps us disciplined and aligned with what price action is truly telling us.
📈 Risk Management Protocols
🔑 Core principles:
Max 1% risk per trade
Only execute at pre-identified levels
Use alerts, not emotion
Stick to your RR plan — minimum 1:2
🧠 You’re not paid for how many trades you take, you’re paid for how well you manage risk.
🧠 Weekly FRGNT Insight
"Trade what the market gives, not what your ego wants."
Stay mechanical. Stay focused. Let the probabilities work.
FRGNT 📊

EURFBP still bullish The pair is currently maintaining a bullish structure after breaking above the descending trendline. Price is approaching a Fair Value Gap (FVG) zone, which acts as a short-term resistance.
We are anticipating a bullish continuation, but confirmation is needed. A 4H candle close above the FVG zone will validate the breakout, turning this FVG into an Imbalance Fair Value Gap (IFVG) — indicating strong bullish intent and potential continuation toward the 0.87385 resistance level.
Until then, we remain cautiously bullish, awaiting that decisive breakout confirmation.

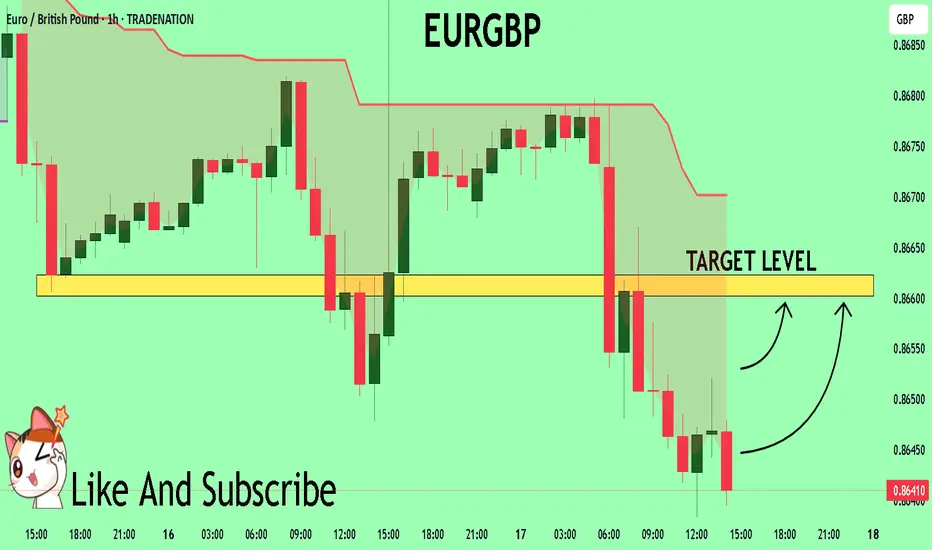
EURGBP Sell IdeaA very common bearish pattern is displayed on EURGBP H1 chart. This trade idea is based on the bearish flag structure outlined. Final target would be at 0,86390.

EURGBP – WEEKLY FORECAST Q3 | W30 | Y25📊 EURGBP – WEEKLY FORECAST
Q3 | W30 | Y25
Weekly Forecast 🔍📅
Here’s a short diagnosis of the current chart setup 🧠📈
Higher time frame order blocks have been identified — these are our patient points of interest 🎯🧭.
It’s crucial to wait for a confirmed break of structure 🧱✅ before forming a directional bias.
This keeps us disciplined and aligned with what price action is truly telling us.
📈 Risk Management Protocols
🔑 Core principles:
Max 1% risk per trade
Only execute at pre-identified levels
Use alerts, not emotion
Stick to your RR plan — minimum 1:2
🧠 You’re not paid for how many trades you take, you’re paid for how well you manage risk.
🧠 Weekly FRGNT Insight
"Trade what the market gives, not what your ego wants."
Stay mechanical. Stay focused. Let the probabilities work.
FRGNT FOREX ANALYSIS 📊


EURGBP Short SwingOANDA:EURGBP Short trade, with my back testing of this strategy, it hits multiple possible take profits, manage your position accordingly.
Note: After TP-1, we will relook at daily closing of price, it must not go bullish, its important, otherwise we need to BE early.
This is good trade, don't overload your risk like greedy, be disciplined trader, this is good trade.
Use proper risk management
Looks like good trade.
Lets monitor.
Use proper risk management.
Disclaimer: only idea, not advice

EUR-GBP Long From Rising Support! Buy!
Hello,Traders!
EUR-GBP is trading in an
Uptrend along the rising
Support line and the pair
Is going down now so after
The retest we will be
Expecting a bullish rebound
And a move up
Buy!
Comment and subscribe to help us grow!
Check out other forecasts below too!
Disclosure: I am part of Trade Nation's Influencer program and receive a monthly fee for using their TradingView charts in my analysis.

EURGBP INSTANT SHORT trend : bearish
divergence : n/a
continuation : lh & lls
reversal : n/a
harmonics : n/a
sentiments : 90 % short

EURGBP SHORT – DAILY FORECAST Q3 | D17/18 | W29 | Y25💼 EURGBP SHORT – DAILY FORECAST
Q3 | D17/18 | W29 | Y25
FUN COUPON FRIDAY INCOMING !
📊 MARKET STRUCTURE SNAPSHOT
EURGBP is currently reacting from a key higher time frame supply zone, with price action showing weakness at premium levels. Momentum has slowed, and early signs of distribution are appearing. With structure aligning bearishly across multiple timeframes, the pair presents a short bias opportunity.
🔍 Confluences to Watch 📝
✅ Daily Order Block (OB)
Price reacted from a high-probability bearish OB.
Rejection wicks and a shift in candle body control point to supply dominance.
Momentum is fading, confirming the presence of smart money sellers.
✅ 4H Order Block
Clear mitigation of 4H OB followed by an internal break of structure (iBoS).
Price is respecting the OB zone, printing lower highs beneath key supply.
Perfect mid-timeframe confirmation of trend transition.
✅ 1H Order Block
1H structure shifted bearish, validating LTF trend alignment.
Price building supply chain with continued lower highs and bearish engulfing patterns.
Ideal zone for entry on pullback or liquidity sweep.
📈 Risk Management Protocols
🔑 Core Principles:
💰 Max 1% risk per trade
📍 Only execute at pre-identified zones
⏰ Set alerts — avoid impulsive trades
📉 Respect RR — minimum 1:2 per position
🧠 You're not paid for frequency. You're paid for discipline and execution quality.
🧠 Weekly FRGNT Insight
“Trade what the market gives, not what your ego wants.”
Stay mechanical, stay focused, and allow the probabilities to play out. Your job is to control risk — not the outcome.
🏁 Final Thoughts from FRGNT
📌 The structure is clear.
📌 The confluences are stacked.
📌 The bias is confirmed.
Let your execution reflect your discipline, not your emotions.
❤️ Good luck this week, and as always – I’ll see you at the very top.

EURGBP Trading Opportunity! BUY!
My dear friends,
My technical analysis for EURGBP is below:
The market is trading on 0.8645 pivot level.
Bias - Bullish
Technical Indicators: Both Super Trend & Pivot HL indicate a highly probable Bullish continuation.
Target - 0.8660
About Used Indicators:
A pivot point is a technical analysis indicator, or calculations, used to determine the overall trend of the market over different time frames.
Disclosure: I am part of Trade Nation's Influencer program and receive a monthly fee for using their TradingView charts in my analysis.
———————————
WISH YOU ALL LUCK
EURGBP Bear To Bullish Outlook.Hi there,
EURGBP looks bearish at the M30, aiming toward the weekly trendline support targeting the 0.86322 zone area, and we might see a reversal back to the weekly resistance trendline, passing two price targets on the way for a bias of 0.87211 sustained by the overall bullish momentum in the weekly.
Happy Trading,
K.

EURGBP Bullish Setup Analysis – MMC + Volume Absorption + TargetIn today's EUR/GBP 30-minute chart, we can clearly observe a well-structured Market Maker Cycle (MMC) in play, accompanied by Smart Money concepts such as volume absorption, minor BOS (Break of Structure), and reversal zone identification. Let’s walk through the technical story unfolding:
🧠 Step-by-Step Breakdown:
🟣 1. Reversal Zone & QFL (Quasimodo Failed Level) Formation
The price made a sharp decline, which trapped retail sellers chasing the breakout to the downside.
This drop landed into a key reversal zone — a price pocket where Smart Money often steps in for accumulation.
The QFL structure is evident here, showing a previous demand zone break and then recovery — classic stop-loss hunting behavior followed by institutional positioning.
This is often considered the “Spring” or “Manipulation” phase in Wyckoff or MMC theory.
🟩 2. Volume Absorption & Compression Phase
After tapping into the reversal zone, price action entered a tight compression range, forming a wedge/triangle.
During this phase, volume absorption is clearly visible — large players are absorbing selling pressure without letting price drop further.
This is a signal of re-accumulation. Buyers are loading up while keeping the price suppressed to mislead retail traders.
You’ve rightly labeled this phase as “Structure Mapping + Volume Absorption” — a textbook Smart Money behavior prior to breakout.
🔓 3. Minor Breaks of Structure (BOS)
As price consolidates, we begin to see Minor BOS— subtle shifts in structure where previous highs are taken out.
These BOS levels are confirmation that demand is outweighing supply.
Once we break multiple minor highs, it shows that buyers are now in control — hinting at the transition from Accumulation → Expansion.
📈 4. Projected Next Reversal + Breakout Scenario
The marked Next Reversal Zone above (around 0.8680–0.8695) is where we can expect the first true breakout and major expansion.
If price enters this area with increased volume, it validates that Smart Money is pushing into the Markup Phase of the MMC.
After the breakout, we could see price push toward 0.8710 and above.
📊 5. Market Maker Cycle (MMC) Summary
What we’re seeing here is a full-scale MMC pattern unfolding:
Manipulation (QFL trap ) → Accumulation (Volume absorption) → Structure Shift (Minor BOS) → Expansion (Reversal breakout)
This is the kind of setup that offers high-probability entries for those who understand Smart Money dynamics and wait for confirmation.
🎯 Key Levels to Watch:
Reversal Support Zone: 0.86450 – 0.86500
Breakout Target Zone: 0.86800 – 0.86950
Final Target (Swing): 0.87100+
🧠 Final Thoughts:
This EUR/GBP setup shows everything we love to see:
Liquidity taken ✅
Structure forming ✅
Volume building ✅
BOS confirming ✅
Expansion pending 🔜
Be patient. Let Smart Money reveal their hand through price action and volume confirmation.


EUR GBP longpossible scenario for eur gbp, there is a protentional for further going down but i think its worth risking it...
Please note: This is for educational purposes only and not a trading signal. These ideas are shared purely for back testing and to exchange views. The goal is to inspire ideas and encourage discussion. If you notice anything wrong, feel free to share your thoughts. In the end, to learn is to share !

7.16 WATCHING EUR/GBP 4H CHARTThis market made a recent new high to confirm the uptrend, now we want to see it pullback into the S/R, make an engulfing candle up, momentum to be low pointing up and volume to be strong up..........also, all of this MUST happen in the morning sessions. We are watching this one.

EURGBP: Expecting Bullish Movement! Here is Why:
The charts are full of distraction, disturbance and are a graveyard of fear and greed which shall not cloud our judgement on the current state of affairs in the EURGBP pair price action which suggests a high likelihood of a coming move up.
Disclosure: I am part of Trade Nation's Influencer program and receive a monthly fee for using their TradingView charts in my analysis.
❤️ Please, support our work with like & comment! ❤️