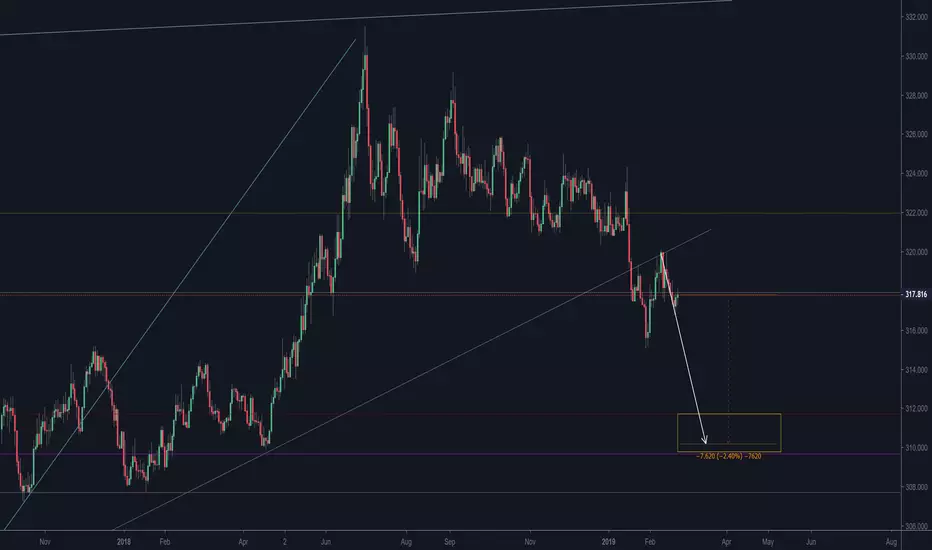
EURHUF Long-term Sell SignalPattern: 1W Channel Down.
Signal: Bearish as the price is entering the Lower High zone.
Target: TP(1) 317.650, TP(2) 312.000.
EURHUF trade ideas

EURHUFThere is no European city that offers the lowest cost of living and a modern lifestyle in a beautiful environment with historical monuments as uniquely as Budapest. A weak Forint supports tourism, although maybe the less sustainable cheap-tourism, and with an all-time EURHUF-high of 331,78 in summer 2018 it may have reached a point for a retrace. Although Hungary´s economy looks as if it is growing stable (increase in GDP, less unemployment, rising building costs) poverty in rural areas is rising faster than ten years ago, and people are not only moving to the capital but are also leaving the country for higher income. Companys that came to Hungary because of low taxes and wages now see more and more strikes and depressed work mentality. At a certain point, a low wage cannot compensate the productivity and it weakens the country in the long term. To find a balance for this "buy out" economists forecast the EURHUF to go back to an average of around 280. From the technical point of few, this may come in the next years. In the 10y supercycle, we still see an uptrend with lows getting weaker since 2015. There is potential for a breakout to cross 333 in the next month, or, and this more likely in my opinion, we will see a retrace to 305 after short-period highs around 324. For the summer I have chosen to go short. Stop 333, Target 300-305, timing: End of September 2019. This is not a forecast, it is just an idea for further happy little accidents :) Cheers

EURHUF H4 Double Top EURHUF in downtrend since June 2018
Double top forming on the H4
Wait for price action to go short


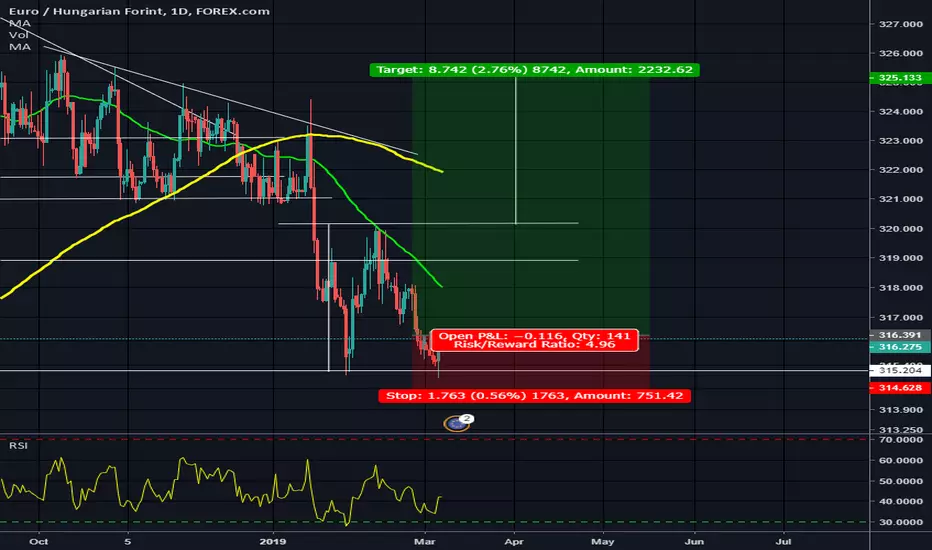
EURHUF: Sell opportunity on 1D.The pair is trading on a long term 1W Channel Down (RSI = 35.120, MACD = -1.016, Highs/Lows = -3.0639, B/BP = -4.7280). A recurring sequence inside this pattern indicates that the current bearish leg still has some downside left before making a Lower Low. Our TP is 312.700.
** If you like our free content follow our profile (www.tradingview.com) to get more daily ideas. **
Comments and likes are greatly appreciated.

The EURHUF exchange rate is further reduced by 2.4%... In the long run, the Hungarian Forint moves on a weakening path. However, I expect further strengthening over a couple of months. Strengthening up to 310HUF can stand against the euro. This is an additional 2.4% increase from the current level.
EURHUF - strong Hun eco data + carry effectFundamentals
- Hun core inflation above MNB target -> rate increase probably in March
- wage growth steadily above 10%
- GDP growth above expectation, 5% yoy
The eco picture resembles scenario the Czech case from 2017 where the central bank started raising rates (wage pressure, inflation, housing prices) and the korona strengthened 6-7%.
Technical
- EURHUF short trend
- 318 resistance tested, move above rejected -> next support weekly 200 DMA @ 313
Trade plan
- EURHUF short opened, carry in favor
- Be patient, next rate decision 26th Feb

EURHUF it is time to short as per longbuylongsellindicatorLong Blues are about to over.
Right time to short

EURHUF 9 RRR long on dailyTrading Methodology:
1. An asymmetric bullish/bearish pennant is drawn using ascending and descending curved trend lines with a minimum of three price action touche points per line. The direction is determined by the previous trend.
2. The angle tool is applied from the earliest two trend touch points, beginning at the earliest touch point.
3. A trend-based Fibonacci retracement triangle is drawn starting from the earliest trend touch point and ending at the earliest touch point of the opposite trend line .
4. Based on the degree, of the earlier defined angle, the appropriate (and secret) levels are selected for the fibonacci retracement ; two levels for stop-loss and two levels for take-profit. The closest stop-loss level to the current price level is the top priority stop-loss. Though the secondary stop-loss level is often chosen for some markets such as FX and some equities in order to account for seldom unexpected resistance breaks. The greater target level is the top priority, and where majority of the shares are sold, though some may choose to close part of the position at the first target level or set it to be the stop-loss once price exceeds it. Entries should be laddered in around the levels closest of the yellow line.
This trading strategy can be applied to any market and time frame, and positions most often garner the greatest risk-to-reward ratio with the highest success rate. What more can you ask for? I will only be posting my unique trading strategy until EOY. I work solely with price action to identify pennants and apply unique trend-based fibonacci retracement levels for SL and TP levels. Reach out to me if you have any questions.


EURHUF: Opportunity to sell higher.This pair has been trading inside a very long term Channel Down on 1W (RSI = 37.951, MACD = -0.084, Highs/Lows = -2.8661, B/BP = -5.8570) and has just touched the inner supporting trend line. As indicated by the July - August 2018 fractal, this trend line can provide the necessary support for a bounce towards the inner resisting trend line (321 - 322). This is an ideal short entry for the next Lower Low of the Channel near 314.00. Attention is required as 315.00 is a long term monthly support so as we approach this level make sure you secure the largest portion of your profit.
** If you like our free content follow our profile (www.tradingview.com) to get more daily ideas. **
Comments and likes are greatly appreciated.


EURHUF: 1D Channel Down aiming at 320.250.EURHUF is trading within a 1D Channel Down (STOCH = 44.456, MACD = -0.045) and 325.00 is its technical Lower High. However we cannot ignore the possibility of a less aggressive Channel Down that may be developed, so the shorts target should be placed accordingly. TP = 320.250.

EURHUF - 240 - Could be an ideaTrade Alert
Let's see if this idea works out.
EURHUF is currently balancing below the short-term downside resistance line, but if the pair breaks that line, we could get some increased buying activity, where the pair may go to the 13th of November high, near the 323.55 barrier.
Don't forget your SL

EURHUF channel developed?I want to hope this low timeframe bull channel will work correctly
need some upward movement
tight stop
comments welcome

The EURHUF exchange rate is 6.5% ahead...That Hungarian forint weakens. According to the technical picture, the exchange rate consists of the last two major D1 fractal points. If you cross this shaft, a larger space will open for further reinforcement. Strength can be created in a dual ascending wave structure. The target price for the first rising structure is 332HUF. Then correction follows. Then the second rising wave structure can develop, the target price reaches the 342HUF level. The current level is 6.5% stronger than the forint.


EUR/HUF LONG opportunityThe Hungarian national bank will not change its current interest rate, and inflationary pressures will further push the HUF into a higher zone.

EUR/HUF 1H Chart: Previous forecast at workThe previous forecast worked, however, the EUR/HUF exchange rate has not reached the Fibonacci 50.00% retracement at 320.26.
Given that the currency pair is being pressured by the 55-, 100– and 200-hour SMAs, it is expected that the pair targets the lower boundary of a short-term descending channel located circa 319.90/320.00. Technical indicators for the short run also demonstrate that there is still some downside potential in the market.
If given channel holds, a reverse north will occur and the pair will target the upper channel line located in the 321.00/321.50 range.

This is likely a bullish flagAnd you can always trust a super dovish Central Bank :-)
In case of a bullish flag breakout, EURHUF Will target 345-350 zone.

EUR/HUF 1H Chart: Slight downside potentialThe Hungarian Forint has been appreciating against the Euro after the currency pair reversed from the upper boundary of a medium-term descending channel at 328.40. This movement has been bounded in a short-term ascending channel.
Given that technical indicators still remain bearish in the short run, it is likely that a breakout from the junior channel occurs during the following days. A possible target is the Fibonacci 50.00% retracement at 320.21. This decline, however, should be short-lived, as the pair is located near the oversold territory.
By the large, it is expected that the exchange rate continues its decline until the bottom of the senior-channel line is reached in the 315.00/317.00 area.

EURHUF still pointing downward, now with h&s formingA sloppy, but valid h&s is in the making. Short target is a key level, which is also reinforced by the 200 EMA.
