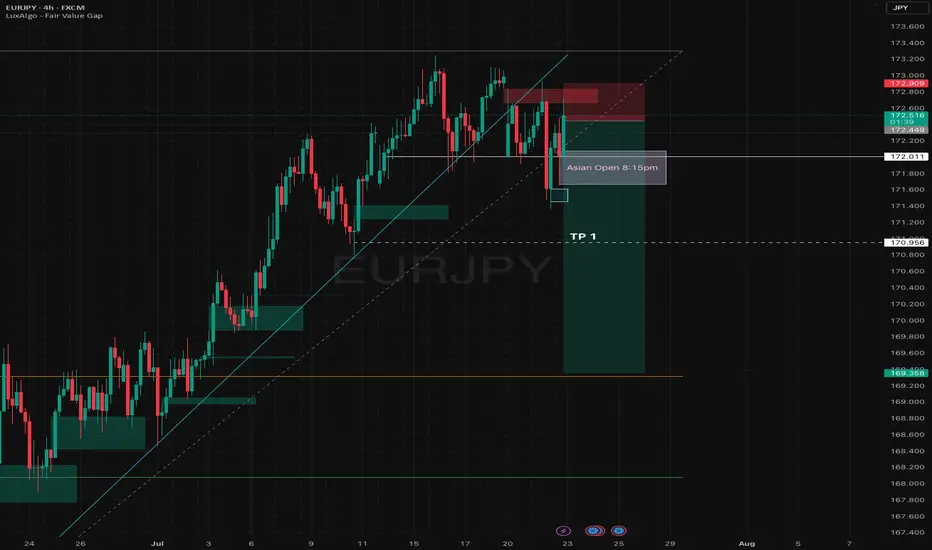
EURJPY: Bullish Move After Liquidity Grab📈EURJPY created a bearish high-range candle beneath a crucial support level in a horizontal trading range on the 4-hour chart.
However, a subsequent recovery and a bullish opening in the Asian session indicate a strong likelihood of an upward movement today, targeting 173.00.
EURJPY trade ideas
EURJPY - Still Over-Bought!Hello TradingView Family / Fellow Traders. This is Richard, also known as theSignalyst.
📈EURJPY has been overall bullish trading within the rising channel marked in blue. However, it is currently retesting the upper bound of the channel.
Moreover, the green zone is a major weekly supply.
🏹 Thus, the highlighted red circle is a strong area to look for sell setups as it is the intersection of the upper blue trendline and weekly supply.
📚 As per my trading style:
As #EURJPY approaches the red circle zone, I will be looking for bearish reversal setups (like a double top pattern, trendline break , and so on...)
📚 Always follow your trading plan regarding entry, risk management, and trade management.
Good luck!
All Strategies Are Good; If Managed Properly!
~Richard Nasr
Disclosure: I am part of Trade Nation's Influencer program and receive a monthly fee for using their TradingView charts in my analysis.

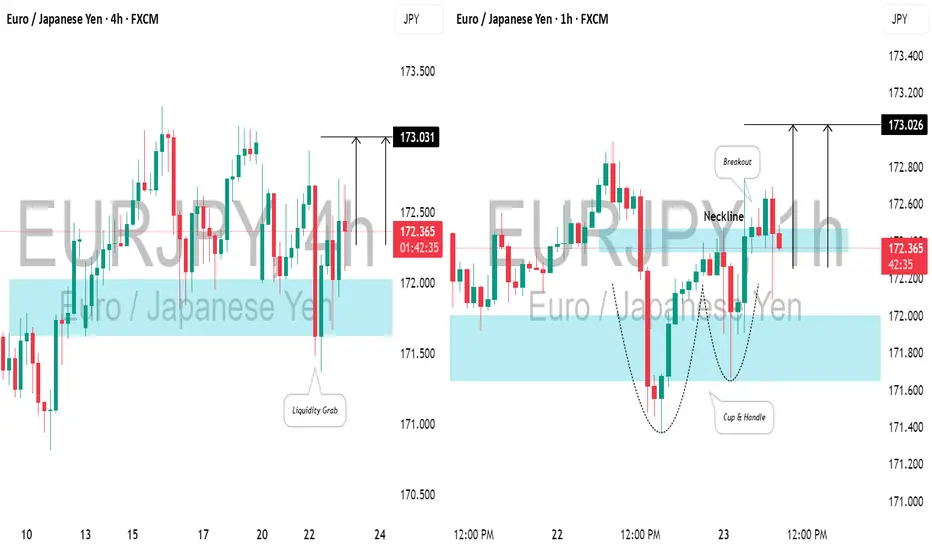
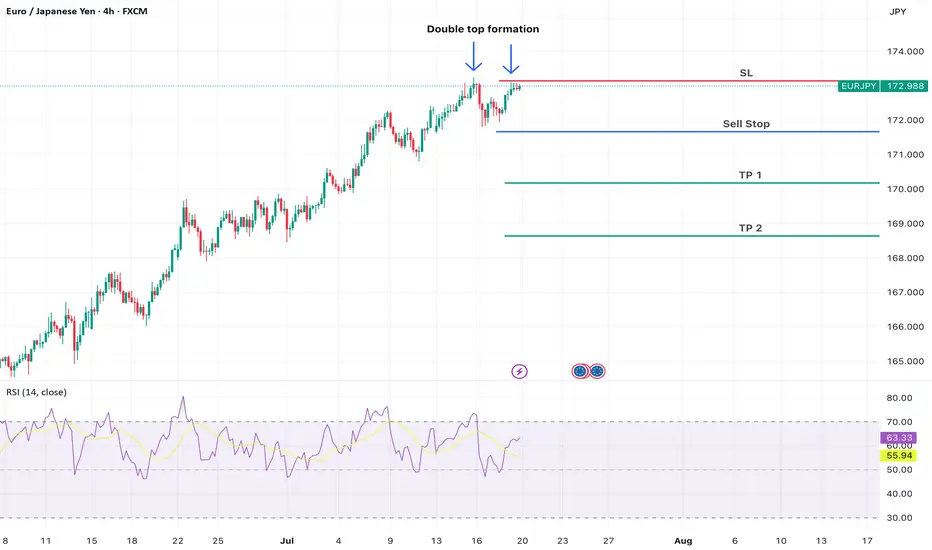
EUR/JPY – Double Top with RSI Divergence (Bearish Setup)Technical Analysis (Short Trade Idea)
EUR/JPY is forming a textbook double top pattern with notable bearish signals:
First top: 173.242
S econd top: 173.111 (lower high, indicating weakening bullish pressure)
Neckline: 171.650 – key support level, potential breakdown trigger
RSI divergence: Bearish divergence observed as RSI prints lower highs while price forms nearly equal tops, signaling momentum loss
This structure suggests a potential reversal from recent highs. A short opportunity may arise if price breaks below the neckline at 171.650 with confirmation.
Trade Setup
Sell Stop: 171.650
Stop Loss: 173.148
Take Profit 1: 170.180
Take Profit 2: 168.642
EURJPY 4Hour TF - July 20th, 2025EURJPY 7/20/2025
EURJPY 4hour Bullish Idea
Monthly - Bullish
Weekly - Bullish
Daily - Bullish
4hour - Bullish
Bullish Continuation - This is the most likely scenario for EJ this week as nothing suggests anything other than Bullish activity.
EJ could take off right at market open and start pushing up without giving us a retest to enter on. If we do get some sort of retest or pullback, look for rejection as close to 172.400 as possible before looking long.
If this does execute it looks like it will be a very small window of opportunity to enter. Trade cautiously with EJ in this bullish scenario.
Bearish Reversal - This scenario is less likely but is much more favorable in my opinion.
For us to consider EJ bearish we would need to see a clear break below 172.400 with a lower high below. This would give us enough confidence to consider short scenarios and start looking lower toward major support levels like 170.750.

EURJPY BUYSI'm still strongly bullish on the Euro, and this current pullback on EURJPY appears to be a healthy retracement within the larger uptrend. It offers a good opportunity to enter long positions with the expectation of a move back to retest the highs reached in July 2024.

EURJPY: MSS on H4 Signals Bearish Shift Toward Weekly FVGGreetings Traders,
In today’s analysis of EURJPY, we observe that a Market Structure Shift (MSS) has recently occurred on the H4 timeframe, indicating a potential change in directional bias. This suggests that price may begin to draw toward the Weekly Fair Value Gap (FVG), presenting a favorable opportunity to align with bearish order flow.
Higher Timeframe Context:
The weekly timeframe currently shows an unfilled Fair Value Gap (FVG) to the downside, acting as the primary draw on liquidity. This macro bearish draw adds weight to the idea of shorting the pair from premium levels. On the H4—our intermediate timeframe—we now have structural confirmation via a bearish MSS, aligning the two timeframes toward downside targets.
Key Observations on H4:
Bearish Order Block in Premium: Price has recently retraced into an H4 bearish order block situated within premium pricing. This zone acts as institutional resistance and is currently showing signs of rejection.
Confirmation Zone: This H4 bearish order block is being monitored for M15 confirmation entries, as we look for price to break lower from this key institutional level.
Engineered Support & Resting Liquidity: Just above the weekly FVG lies an engineered support zone—characterized by equal lows—suggesting that liquidity has been pooled there. This area serves as a high-probability draw for institutional price delivery.
Trading Plan:
Entry Strategy: Seek lower timeframe (M15) confirmation around the H4 bearish order block before initiating short positions.
Targets: The first target lies at the H4 internal liquidity pool within discounted pricing. The longer-term objective is the weekly FVG, where liquidity is likely to be delivered next.
For a detailed analysis, please watch this weeks Forex Outlook:https://www.tradingview.com/chart/EURNZD/BZC9xW1L-July-21-Forex-Outlook-Don-t-Miss-These-High-Reward-Setups/
Maintain patience, follow your confirmation rules, and always adhere to sound risk management principles.
Kind Regards,
The_Architect 🏛️📉

EURJPY Bearish Bat PatternOn the weekly chart, EURJPY has currently formed a bearish bat pattern, and short selling can be considered at present. The downside target is around 166.8. After breaking through, the support below is around 162.2.

BUY LIMIT EURJPYi expect EURJPY to fall basing on ongoing bearish channel it forms , with respect to this move wednesday liquidity left overs has to swaped with efficiency fill of FVG , where we will activate our entries at 50 % FBnaccic retracement level in our POI
GOODLUCK
always use proper risk management , never riskmore than what u can afford to loose ....
Sell EURJPYIntraday trade on EURJPY. Bearish flag pattern is on display here. Let us see how price reacts after liquidity collection on the H1 timeframe chart.

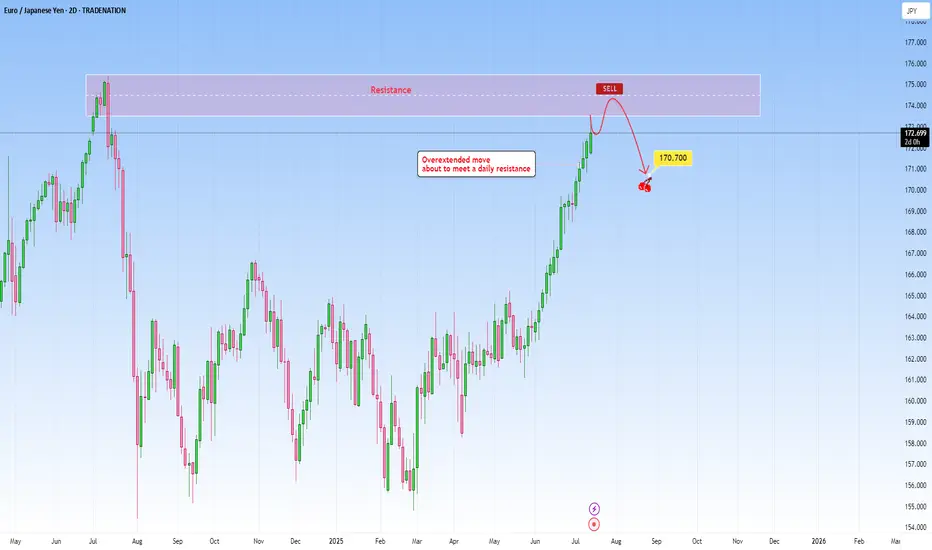
EURJPY: Overextended move to meet daily resistanceThe current market context on EURJPY shows an overextended move that has been pushing higher as price is about to reach a well-established daily resistance. The rally into this resistance lacks healthy retracements, and momentum is likely unsustainable without a deeper correction. The probability of a pause or reversal here under this circumstances increases substantially.
This extension exaggerates this imbalance making it a high probability setup. Volume and price action near this level becomes critical in this case. Signs such as long upper wicks, bearish engulfing patterns will hint that the move may be running out of steam.
I would be targeting a decent pullback towards 170.700.
Just sharing my thoughts for the charts, this isn’t financial advice. Always confirm your setups and manage your risk properly.
Disclosure: I am part of Trade Nation's Influencer program and receive a monthly fee for using their TradingView charts in my analysis.
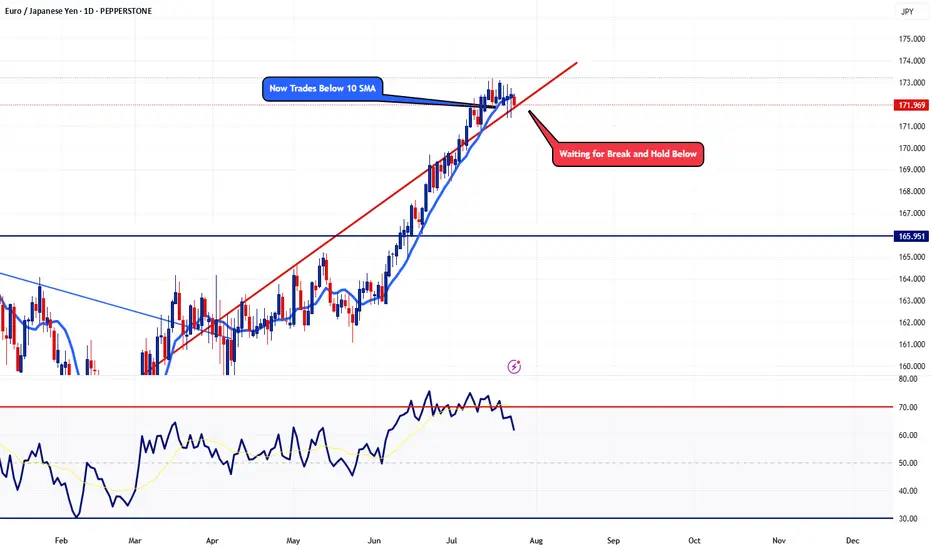
EURJPY - Potential Topping ActionTaking a look at the daily timeframe, price action is now trading below the 10 SMA. This pair has not traded below the 10 SMA since May 26. Now I'm just waiting for a few more confirmation before I'm fully confident. For now, adding a few small sells won't hurt.
Trade Safe - Trade Well
Symmetry Bearish Setup Targeting PCZ Liquidity Zone 1HELLO awesome traders, I hope y'all have had a great weekend!! What a beginning of trading week, ha? lets crack on by droping some chart here for yall.
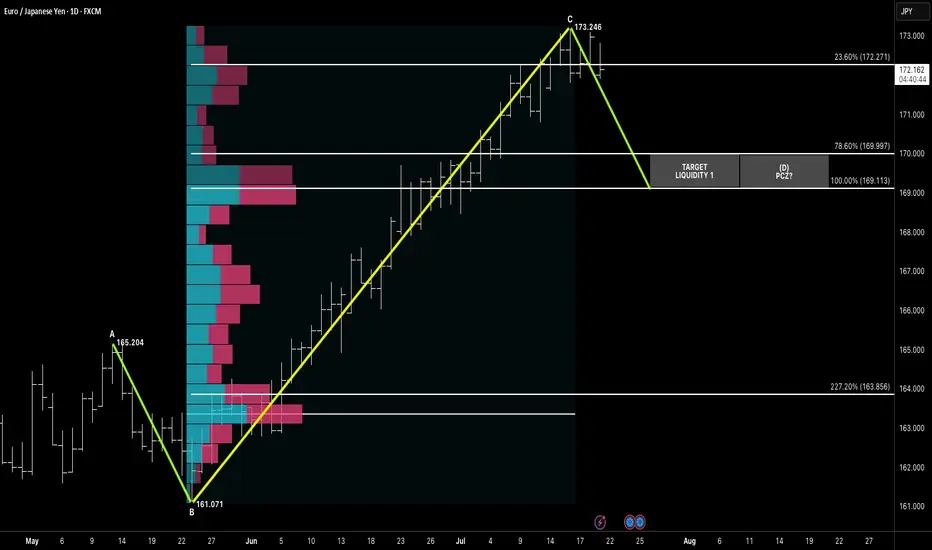
After completing a clean ABC symmetry leg, EURJPY is now showing signs of exhaustion just below 173.250, with price stalling at the high-volume node. The projected Potential Completion Zone (PCZ) aligns at 169.997 (78.6%) and 169.113 (100%), backed by volume profile voids and confluence from prior structure.
This symmetrical move offers a classic liquidity sweep play, with target zones sitting below price in thin auction areas.
📌 Pattern Structure:
A: 165.204
B: 161.071
C: 173.246
D Target = 1:1 Symmetry → PCZ = 169.997–169.113
🔻 Bearish Trigger:
Break below 23.6% retracement (172.271) = early momentum shift
Liquidity likely rests between 170.00–169.00
🎯 Targets:
T1: 169.997
T2: 169.113 (let's do T1, Them will see)
🧠 Context:
JPY strength resurfaces amid macro uncertainty. Volume profile suggests fast price drop once liquidity is triggered below 171.00. Watching for confirmation candle or rejection below 172.20 zone.
“Symmetry leads the setup, but liquidity confirms the move.”
Potential BEARSOn a 1D TF, looks like we having a wedge/ending diagonal after a long bullish trade. On a 1H TF, we're having a bearish BAT Pattern which On completion will result into breaking out of the wedge. So we're looking to go down for more oil 🛢 .
EUR/JPY: The Yen Begins to Gain GroundOver the past three trading sessions, the EUR/JPY pair has declined by up to 0.8%, as the yen has steadily gained strength, preventing the euro from maintaining its momentum in the short term. Selling pressure has held firm, especially after news that Japan finalized a new trade agreement with the United States, which lowered the initially proposed 25% tariff to 15%. This development has been perceived as a positive outcome for Japan and has supported strong demand for the yen in the latest trading session.
Uptrend Remains Intact
Despite the yen’s recent strength, it is important to note that the EUR/JPY pair remains in a well-defined uptrend, with sustained bullish momentum continuing to dominate the long-term outlook. Although some short-term selling corrections have emerged, they remain insufficient to break the current bullish structure. For now, the uptrend remains the most relevant technical formation in the chart and should continue to be monitored unless selling pressure becomes significantly stronger.
RSI
The RSI indicator has started to show lower highs, while price action continues to register higher highs. This event suggests the potential formation of a bearish divergence, which may indicate that the current selling correction could gain more traction in the coming sessions.
MACD
The MACD histogram remains close to the neutral zero line, indicating that no clear direction has formed in short-term moving average momentum. If this neutral setting continues, the chart could enter a more defined consolidation phase in the near term.
Key Levels to Watch:
172.896 – Resistance Level: This level corresponds to the recent high, and any buying momentum strong enough to break it could confirm a bullish continuation, supporting the long-standing uptrend currently in place.
170.231 – Nearby Support: This level aligns with a short-term neutral zone and may act as a temporary barrier, limiting any bearish corrections that may arise in the sessions ahead.
166.930 – Key Support: This is a critical level not seen since June of this year. If bearish pressure intensifies and the price falls to this point, it could seriously jeopardize the bullish structure that has been holding so far.
Written by Julian Pineda, CFA – Market Analyst

EURJPY Short at current market priceH4 Price action showing support has been broken.
Seller started to stepping in.
Now support become resistant.
calculate your own risk & reward.
Good Luck

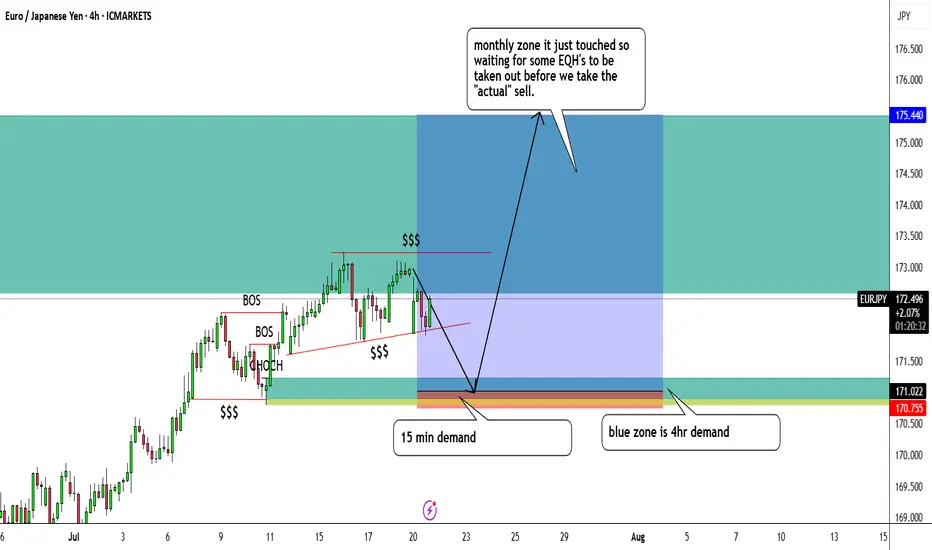
EURJPY buysHello everyone,
I am looking for eurjpy buys only because on the 15 min chart, price decided to take out EQL's to go long thus creating a big bullish move which has been marked in yellow and annotated.
Price than made this wedge liquidity zone where both EQL's and EQH's are present so we believe outside of this range is where the liquidity actually is.
4hr and 15 min demand zone is still untouched so we're looking for the buy around the 171.185 area to be precise.
I will be putting up screenshots as well so that it makes sense.
EURJPY break of strong support , at fib 0.5 short EURJPY was trending in uptrend but recently a strong support was broken and Big Sell candle is formed and currently price has pulled back to fib 0.5 and soon may price go down.

EURJPY Short Swing TradeOANDA:EURJPY Short trade, with my back testing of this strategy, it hits multiple possible take profits, manage your position accordingly.
This is good trade, don't overload your risk like greedy, be disciplined trader, this is good trade.
Use proper risk management
Looks like good trade.
Lets monitor.
Use proper risk management.
Disclaimer: only idea, not advice

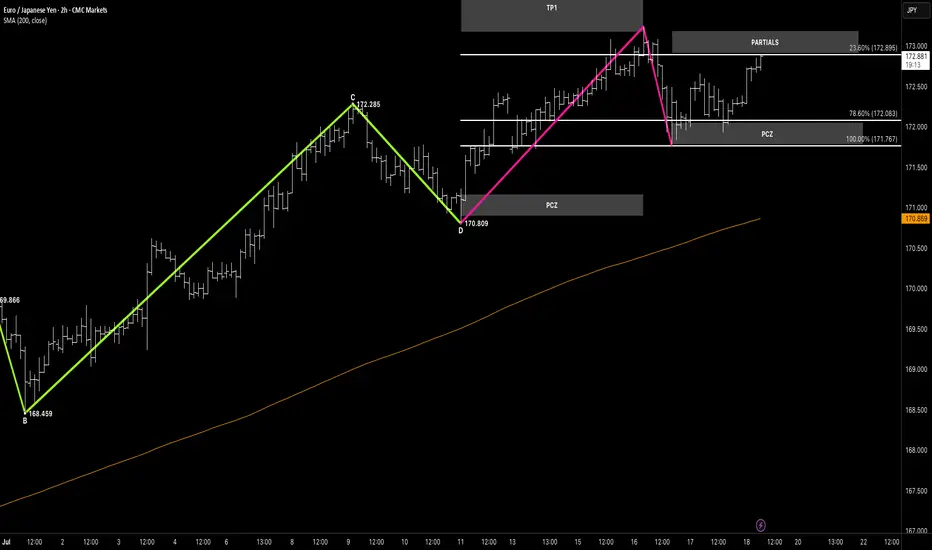
EURJPY / Euro – Japanese Yen (2H) – Bullish Structure Rebuilding
Hello awesome traders! 👋
Wrapping up the week with one more setup review — this one’s moving step by step, and now testing a critical level. Let's break it down.
📌 Pattern Breakdown
We had a clean multi-leg impulse and harmonic rotation:
🔹 D-leg reversal formed at 170.809, right inside the PCZ
🔹 Strong rally into the 23.6% fib zone (172.895)
🔹 Partial profits were taken at that first resistance
🔹 Price is now testing that same level as resistance turned support (R→S)
This is the decision point — a confirmed hold above 172.89 signals potential continuation toward TP1.
🎯 Targets Ahead
📍 TP1 Zone:
• 78.6% = 173.694
• 100% = 174.215
💡 But first — 23.6% is the gate. If it holds as new support, momentum should carry this back into the higher fibs.
🧠 What to Watch
✅ Structure respected from PCZ
✅ Partial taken on first reaction
🟡 Now watching reaction at 23% for direction:
• 🔼 Break + hold → continuation toward TP1
• 🔽 Failure + breakdown → reversion back into PCZ
🗝 Final Thoughts
This is how measured setups evolve — from structure → to reaction → to resolution.
You’ve got the edge — now it’s about letting price show the hand.
“The 23% isn’t just a pullback — it’s a pressure point. Hold it, and the next move builds.”
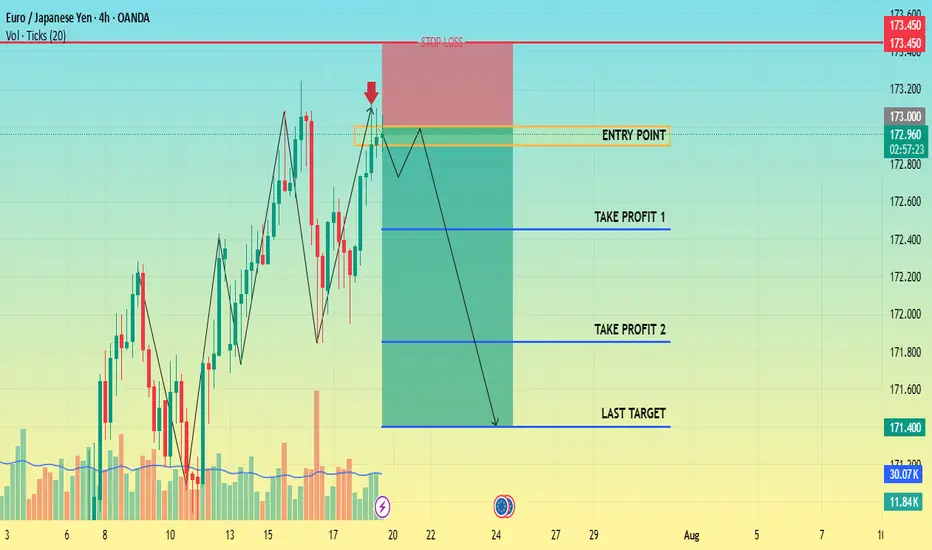
CHECK EURJPY SIGNAL READ CAPTAINShort (sell)
Entry Point: Around 173.000 172.900
Stop Loss: Around 173.450
🎯 Target Levels
Take Profit 1:
172.450
Take Profit 2:
171.850
Last Target:
171.400
EURJPY Q3 | D21 | W30 | Y25📊EURJPY Q3 | D21 | W30 | Y25
Daily Forecast 🔍📅
Here’s a short diagnosis of the current chart setup 🧠📈
Higher time frame order blocks have been identified — these are our patient points of interest 🎯🧭.
It’s crucial to wait for a confirmed break of structure 🧱✅ before forming a directional bias.
This keeps us disciplined and aligned with what price action is truly telling us.
📈 Risk Management Protocols
🔑 Core principles:
Max 1% risk per trade
Only execute at pre-identified levels
Use alerts, not emotion
Stick to your RR plan — minimum 1:2
🧠 You’re not paid for how many trades you take, you’re paid for how well you manage risk.
🧠 Weekly FRGNT Insight
"Trade what the market gives, not what your ego wants."
Stay mechanical. Stay focused. Let the probabilities work.
FRGNT 📊

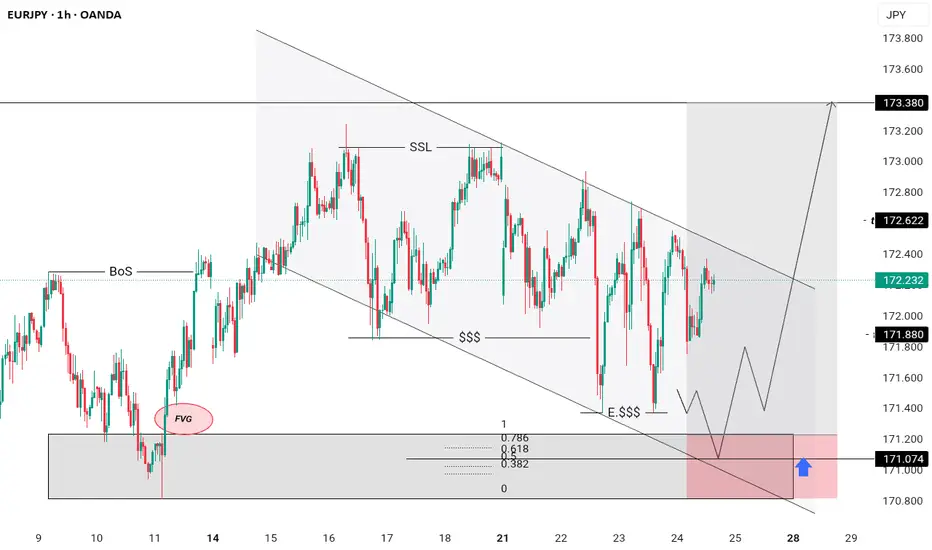
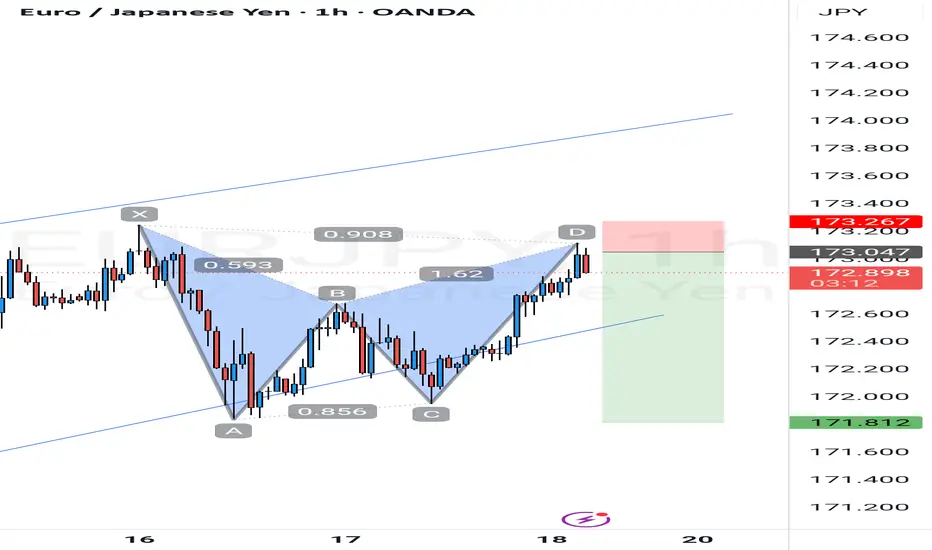
"Three Drives" And EURJPY Bulls Could Be Out!!OANDA:EURJPY has potentially been forming quite a rare Reversal Pattern, the Three Drives Pattern, after making a Bullish Breakout of the Triangle, lets break it down!
Three Drive Patterns are very similar to ABCD patterns except for one thing, a Retracement instead of a Reversal after the CD Leg is finished!
In the CD Leg, Price creates quite a Trading Volume Gap between 172.1 - 171.8 and after Price declines from Point D (normally a Short Opportunity on an ABCD Pattern), Price actually makes a 61.8% Retracement of CD, creating Point E in that very Price Range and moves up, which "drives" a strong case that we potentially could be looking at a Three Drive Pattern!
Now that we have Point E, we can use the Fibonacci Retracement Tool to help give us an idea on where the Extension of the EF Leg could potentially end and the Fibonacci Levels suspected are:
123.6% --> 173.585
138.2% --> 173.795
161.8% --> 174.134
Once Price has made an Extension, shows Reaction, and moves Down from these levels; this could generate a great Short Opportunity!

My outlook on EJJust my outlook so I can come back to this trade and see, I broke one rule here, so lets see if it plays out
Rule broken, didnt wait for Trend confirmation from London