EURJPY Poised to test the top after the BOJ Rate DecisionEURJPY Poised to test the top after the BOJ Rate Decision
EURJPY broke out of a descending type of channel pattern or something similar.
The last two candles confirmed the bullish movement in a clear way and the odds are that EURJPY may rise further during the coming hours.
However this movement is also supported by BOJ Interst Rate decision.
BOJ kept rates unchanged at 0.5% as expected and they didn't change anything at all in their comments.
News - reported by forexlive
The Japanese Yen weakened across the board throughout BoJ Governor Ueda press conference. He sounded like someone who's not in a rush to hike rates at all. The two key lines were "monetary tightening effectively works on demand-driven inflation, but current inflation is largely supply-driven" and "current FX rate not diverging far from our assumptions".
He's basically saying that the current inflation is likely to be a one-off event and we all know how much weight they place on sustained inflation to durably hit their 2% target. And the comment about FX suggests that the depreciation in the JPY does not concern them at all, which gives the market the green light for further depreciation (all else being equal).
You may find more details in the chart!
Thank you and Good Luck!
PS: Please support with a like or comment if you find this analysis useful for your trading day
Disclosure: I am part of Trade Nation's Influencer program and receive a monthly fee for using their TradingView charts in my analysis.
EURJPY trade ideas

EUR/JPY Channel Formation (6.08.2025) The EUR/JPY Pair on the M30 timeframe presents a Potential Selling Opportunity due to a recent Formation of a Channel Pattern. This suggests a shift in momentum towards the downside in the coming hours.
Possible Short Trade:
Entry: Consider Entering A Short Position around Trendline Of The Pattern.
Target Levels:
1st Support – 169.74
2nd Support – 169.25
🎁 Please hit the like button and
🎁 Leave a comment to support for My Post !
Your likes and comments are incredibly motivating and will encourage me to share more analysis with you.
Best Regards, KABHI_TA_TRADING
Thank you.
Disclosure: I am part of Trade Nation's Influencer program and receive a monthly fee for using their TradingView charts in my analysis.

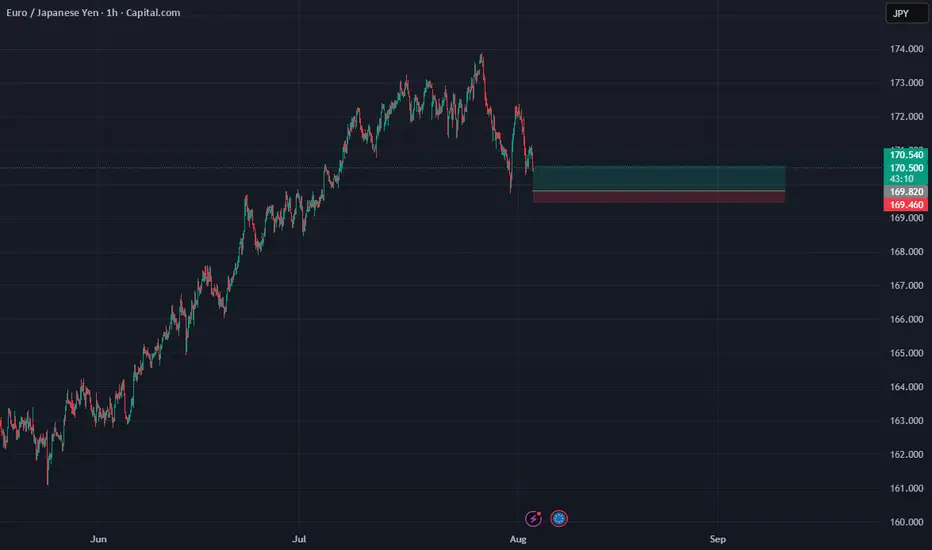
EURJPY: Bullish Rebound from Key Demand ZoneEURJPY has bounced off a critical demand zone and is showing signs of a bullish recovery. Despite the recent pullback, the pair’s structure remains fundamentally and technically bullish, driven by JPY weakness and EUR resilience.
Technical Analysis (4H Chart)
Pattern: Price tested a strong demand zone near 170.35–170.50 and rejected it aggressively.
Current Level: 170.77, starting a potential bullish leg toward higher resistance levels.
Key Support Levels:
170.35 – key demand zone and invalidation level for bulls.
169.90 – deeper support if demand zone breaks.
Resistance Levels:
172.17 – first bullish target and interim resistance.
173.64 – major target if bullish continuation sustains.
Projection: A successful rebound from 170.35 could drive price toward 172.17 initially, then 173.64 if momentum holds.
Fundamental Analysis
Bias: Bullish.
Key Fundamentals:
EUR: ECB’s slower path toward easing supports EUR stability relative to JPY.
JPY: Weakness persists as BoJ maintains dovish bias, though FX intervention risk limits JPY downside speed.
Global Sentiment: Mild risk-on mood supports EUR strength against JPY.
Risks:
BoJ verbal intervention or actual FX intervention could trigger temporary JPY strength.
Sharp reversal in global risk sentiment could weaken EUR/JPY.
Key Events:
ECB speeches and data (CPI, growth updates).
BoJ FX comments and broader market risk appetite.
Leader/Lagger Dynamics
EUR/JPY is a leader among JPY pairs, often moving in sync with GBP/JPY and CHF/JPY. Its movement also tends to precede confirmation in risk-sensitive JPY crosses.
Summary: Bias and Watchpoints
EUR/JPY is bullish from the 170.35 demand zone, with a potential move toward 172.17 and 173.64. Key watchpoints include ECB communication, BoJ stance, and market risk sentiment. As long as 170.35 holds, bulls remain in control.
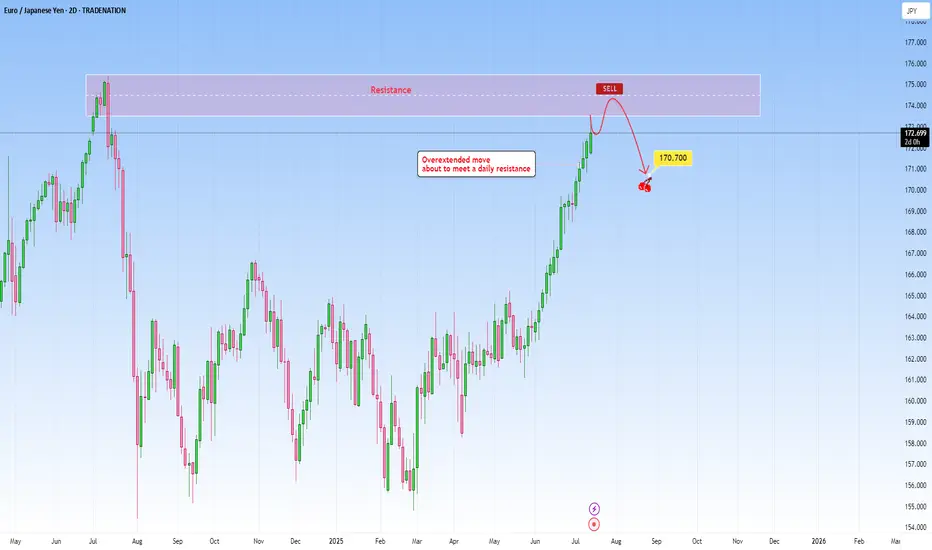
EURJPY: Overextended move to meet daily resistanceThe current market context on EURJPY shows an overextended move that has been pushing higher as price is about to reach a well-established daily resistance. The rally into this resistance lacks healthy retracements, and momentum is likely unsustainable without a deeper correction. The probability of a pause or reversal here under this circumstances increases substantially.
This extension exaggerates this imbalance making it a high probability setup. Volume and price action near this level becomes critical in this case. Signs such as long upper wicks, bearish engulfing patterns will hint that the move may be running out of steam.
I would be targeting a decent pullback towards 170.700.
Just sharing my thoughts for the charts, this isn’t financial advice. Always confirm your setups and manage your risk properly.
Disclosure: I am part of Trade Nation's Influencer program and receive a monthly fee for using their TradingView charts in my analysis.
EURJPY - BEARISH MOVE!Hello Traders !
The EURJPY formed an ascending channel.
The price broke the support line!
So, I expect a bearish move📉
_____________
TARGET: 169.365🎯

01.08.25 Morning ForecastPairs on Watch -
FX:EURJPY
FX:EURGBP
A short overview of the instruments I am looking at for today, multi-timeframe analysis down to what I will be looking at for an entry. Enjoy!

Sell eurjpy More selling expected
Still valid for sellers
Respecting its weekly supply level
Targat still 161.000

EURJPY → Retest support before growthFX:EURJPY has been correcting since the opening of the European session. The movement was triggered by yesterday's news related to the trade deal between the US and Europe...
EURJPY is reacting to news related to the deal between the US and Europe. A correction is forming amid the fall of the euro, but against the backdrop of the dollar's growth, the currency pair has a chance to rise if the bulls keep the price in the buying zone relative to the support level of 173.08.
The dollar is rising, and against this backdrop, the Japanese yen is falling. Bulls have every chance of holding their ground above the previously broken resistance. If the market confirms support, we will have chances for growth.
Resistance levels: 173.87
Support levels: 173.082, 172.47
The currency pair may form a liquidity trap relative to the previously broken consolidation resistance. A false breakdown of support and price consolidation in the buying zone (above 173.1) could trigger further growth.
Best regards, R. Linda!

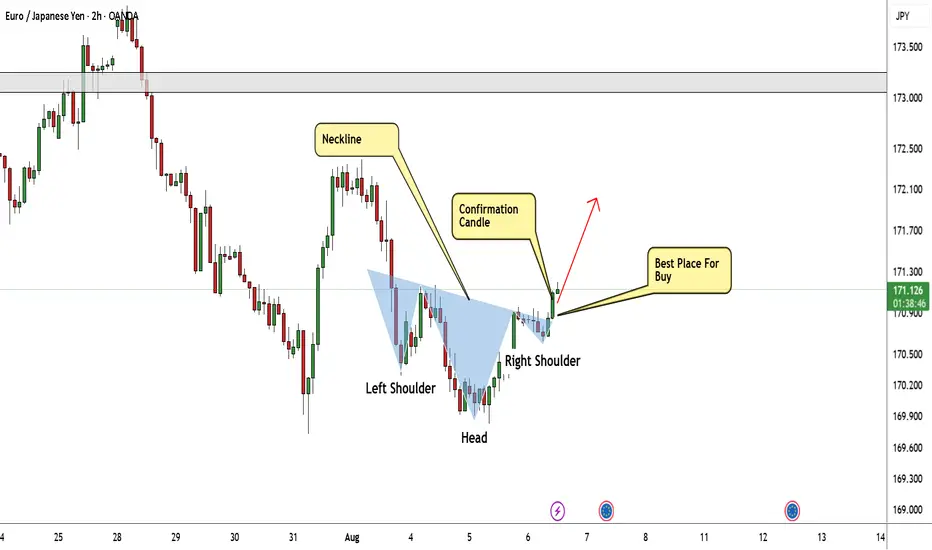
EUR/JPY Made Inverted H&S Pattern , Time To Buy And Get 150 PipsHere is my 2H Chart On EUR/JPY , The price created a very clear reversal pattern ( inverted head and shoulders pattern ) and the price closed above neckline so the pattern confirmed and we can buy it and targeting from 100: 200 pips , if we have a daily closure above 171.000 it will be a great confirmation telling us the price will continue to upside .
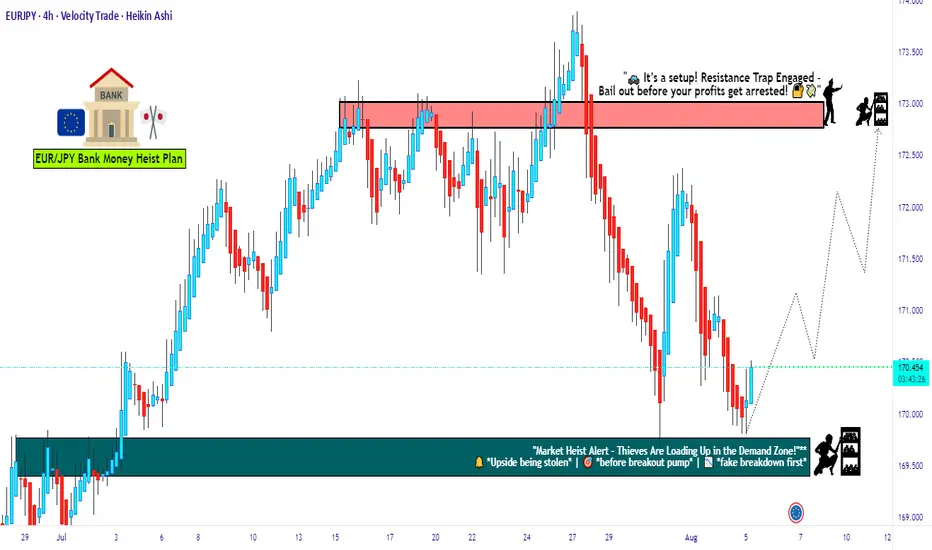
EUR/JPY Setup: Thief Trader's Stealth Bull Run to 173.000🔥💶 EUR/JPY Bullish Heist Plan 💶🔥
🧠 New Plan Unlocked – The EUR/JPY Bullish Mission is LIVE!
Thief Trader style means: No noise, no fluff — just pure sniper precision with layered limit orders. 🧤🔫
This isn’t trading… it’s a planned market robbery 💼💣
🧩 Asset: EUR/JPY
📊 Strategy: Bullish Bias with Stealth Layered Entries (Limit Order Gameplan)
🎯 Target: 173.000 — That’s the vault we’re cracking!
🛑 Stop Loss: 169.100 — Tight security, keep your escape route clean.
📍 Entry: No fixed door — we’re setting traps (limit orders) across key levels. Patience pays thieves.
Watch for pullbacks on lower timeframes: 15m, 30m, or even 1H — strike near support bounces & fakeout wicks. 🐍💥
🔍 Thief Logic:
This ain’t random — price is setting up for a high-stakes move north with JPY weakness fueling the getaway car.
Think smart, layer deep — sniper entries, not shotgun chaos. 🎯🔍
📌 Notes from the Safe House:
Trade with position sizing discipline – the market doesn’t owe you.
News events are motion sensors — avoid them or stay light! 🕵️♂️📉
Use trailing SLs once in profit — secure the bag and vanish. 💼💨
💣 Ready to steal pips, not hope? Hit that 👍, drop a 💬, and join the crew.
This is Thief Trading — we don’t follow markets, we outsmart them. 🧠💵
Stay sharp, stay silent… profit loud. 🐱👤📈💸
🔥 Tap Boost. Support the Heist. Run the Charts. #ThiefTrader 🧤💰
EURJPY: Rejection Block Support Fuels Bullish momentum!Greetings Traders,
In today’s analysis of EURJPY, recent price action confirms the presence of bullish institutional order flow. As a result, we aim to align ourselves with this directional bias by seeking high-probability buying opportunities that target the long-term highs, where a significant liquidity pool resides.
Key Observations:
Weekly Timeframe Insight:
Last week, price retraced into a weekly bullish Fair Value Gap (FVG), which has acted as a strong support zone. This reaction has initiated a bullish response across lower timeframes, validating the weekly FVG as a meaningful area of institutional demand.
H4 Bullish Market Structure Shift:
Following the weekly bounce, the H4 chart presented a clear bullish Market Structure Shift (MSS), signaling the onset of upward momentum. Price then retraced into an extreme discount, where it found support at a well-defined Rejection Block—an institutional array we expect to hold as a launchpad for further bullish continuation.
Trading Plan:
Entry Strategy:
Monitor the Rejection Block zone for bullish confirmation setups on lower timeframes (M15 and below) to validate potential long entries.
Target Objective:
The draw on liquidity remains at higher premium levels, with the liquidity pool above the long-term highs serving as our primary objective.
For a detailed market walkthrough and in-depth execution zones, be sure to watch this week’s Forex Market Breakdown:
As always, exercise patience, wait for confirmation, and maintain strict risk management.
Kind regards,
The Architect 🏛️📈

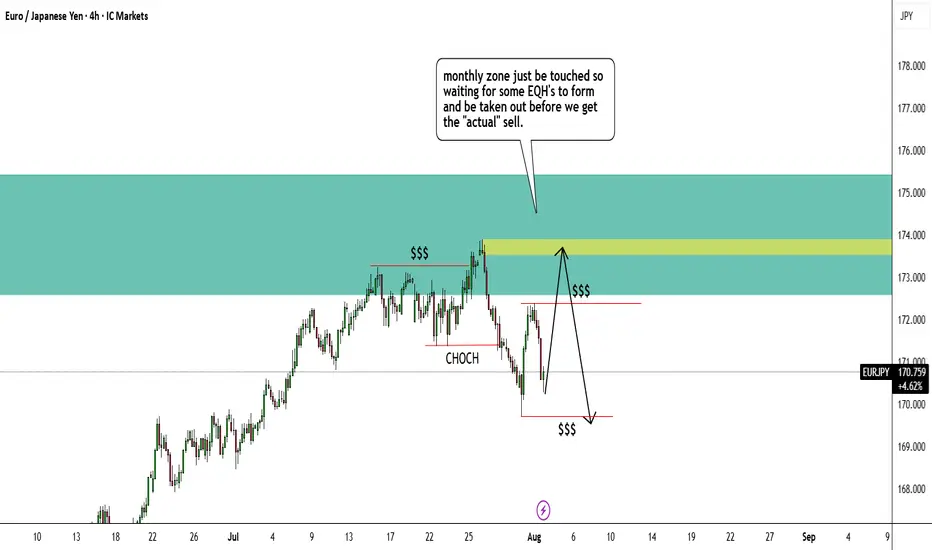
EUR/JPY – 4H Technical and Fundamental AnalysisEUR/JPY – 4H Technical and Fundamental Analysis
EUR/JPY recently pulled back after briefly touching a year-to-date high near 173.25. The pair has since traded within a tight corrective range between 170.00 and 172.30, indicating exhaustion near key resistance zones. Price has now broken below a minor support level—suggesting a potential Change of Character (ChoCh) and the beginning of an accumulation phase. This movement likely triggered liquidity hunts, sweeping stop-losses before dropping lower to re-establish downside momentum.
We are now monitoring for additional liquidity hunts within our identified zones before committing to a bearish continuation setup. The break of structure and recent liquidity grabs are strengthening the case for more downside pressure.
Fundamentals backed the move too:
🚨 Negative sentiment rose after headlines tied to weakening Eurozone economic data—particularly Germany’s recent PMI miss and cautious ECB commentary hinting at slower recovery prospects.
Meanwhile, the Japanese yen remains stable, supported by safe-haven flows amid geopolitical tensions and a broadly weaker Euro outlook.
📍 Sell Setup
Entry: Sell Stop at 170.730
Stop Loss: 171.940
Take Profit: 168.060
📌 Disclaimer:
This is not financial advice. Always wait for proper confirmation before executing trades. Manage risk wisely and trade what you see—not what you feel.

EURJPY shortsHello everyone
I got a EURJPY short trade coming up soon.
Reason being is that price came back to the monthly supply zone (blue)
Price than made a EQH zone which got taken out and created a CHOCH.
Price is now consolidating and has formed EQL and EQH but i believe price will break EQH first to come back to 4hr supply zone (yellow).
Some news is also coming out as well which could influence price as well
EURJPYPrice just broke key internal structure with a clear BoS (Break of Structure) after liquidity sweep above the previous highs. We're now watching for a clean retracement to the supply zone to execute a sniper short.
📍 Setup Details:
BoS Confirmed: 172.00 level cleanly broken
Area of Interest: Supply zone 172.90–173.60
Stop: Above liquidity zone ~174.55
Target: Downside continuation toward 168.00–167.00
📉 RSI shows momentum weakness on the pullback

EURJPY POSSIBLE SELL OPPORTUNITYFrom the H4 timeframe we’re looking at a possible sell opportunity on this pair once we get a break to the downside.( that’s further bearish momentum) we’d open short positions on this asset.

EURJPY SHORTWe have a break of Market structure. The pair rose to the daily fair value gap hoping the pair will drop to the 169.800 level

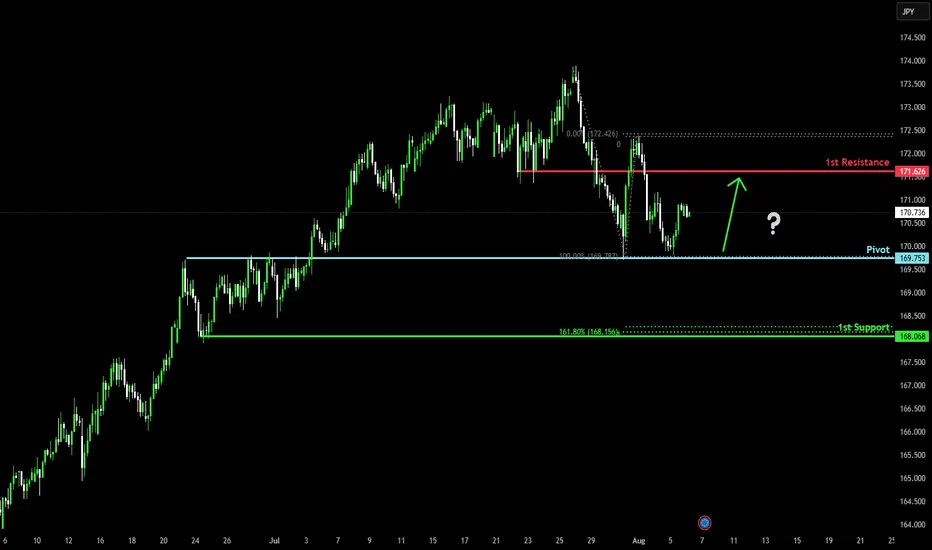
Bullish bounce off?EUR/JPY has bounced off the pivot which has been identified as an overlap support and could rise to the 1st resistance.
Pivot: 169.75
1st Support: 168.06
1st Resistance: 171.62
Risk Warning:
Trading Forex and CFDs carries a high level of risk to your capital and you should only trade with money you can afford to lose. Trading Forex and CFDs may not be suitable for all investors, so please ensure that you fully understand the risks involved and seek independent advice if necessary.
Disclaimer:
The above opinions given constitute general market commentary, and do not constitute the opinion or advice of IC Markets or any form of personal or investment advice.
Any opinions, news, research, analyses, prices, other information, or links to third-party sites contained on this website are provided on an "as-is" basis, are intended only to be informative, is not an advice nor a recommendation, nor research, or a record of our trading prices, or an offer of, or solicitation for a transaction in any financial instrument and thus should not be treated as such. The information provided does not involve any specific investment objectives, financial situation and needs of any specific person who may receive it. Please be aware, that past performance is not a reliable indicator of future performance and/or results. Past Performance or Forward-looking scenarios based upon the reasonable beliefs of the third-party provider are not a guarantee of future performance. Actual results may differ materially from those anticipated in forward-looking or past performance statements. IC Markets makes no representation or warranty and assumes no liability as to the accuracy or completeness of the information provided, nor any loss arising from any investment based on a recommendation, forecast or any information supplied by any third-party.
EURJPY 4hour TF - August 3rd,2025🟦 EURJPY 4H Analysis Bearish Idea
📅 August 3, 2025
🔹 Top-Down Trend Bias:
• Monthly – Bullish
• Weekly – Bullish
• Daily – Bullish
• 4H – Bearish
EURJPY has pulled back through the previous support zone around 171.000 and is currently consolidating after a sharp bearish move. Short term trend remains bearish, but higher timeframes suggest this may be a corrective phase.
🔍 Key Zone: 171.00 – 171.70
This zone represents the 38.2% fib retracement and prior structure. A rejection from this area could trigger further downside, while a break above may confirm a higher low.
✅ Scenario A: Bearish Continuation (Blue Path)
1.If price taps into 171.00–171.70 and rejects
2.Look for bearish confirmation (rejection wick, bearish engulfing, BOS)
Target: 169.60 (key support)
This setup follows short term momentum and offers clean R:R into prior liquidity.
⚠️ Scenario B: Bullish Break & Hold (Orange Path)
1.If price breaks and closes above 172.250
2.Watch for continuation toward 173.750, our extended fib target
3.Structure shift + bullish PA would align with HTF bullish trend
This would confirm strength returning to the pair, ideal for HTF trend continuation traders.
🧠 Final Notes
• 171.00–171.70 is the reaction zone to watch
• HTFs remain bullish, but 4H momentum must flip to validate upside
• Let price confirm direction

How I’m Trading the EURJPY Break of Structure Setup📈 EURJPY Analysis Update 🔍
I'm currently watching EURJPY closely. On the weekly timeframe, the pair is clearly in a strong bullish trend 🚀. Price has recently tapped into a previous daily bullish order block 🧱 — a key zone of interest.
Now, I’m watching for a break of structure (BoS) 📉 followed by a bullish continuation, especially if price pulls back into the fair value gap (FVG) 📊 near the current low.
As always, this setup — along with all key details and trade considerations — is fully broken down in the 🎥 video.
⚠️ This is for educational purposes only and not financial advice.

EURJPY Wave Analysis – 30 July 2025
- EURJPY reversed from the resistance zone
- Likely fall to support level 169.60
EURJPY currency pair recently reversed down from the resistance zone between the resistance level 174.00, the upper daily Bollinger Band and the resistance trendline of the daily up channel from February.
The downward reversal from this resistance zone created the daily Japanese candlesticks reversal pattern, Bearish Engulfing.
EURJPY currency pair can be expected to fall further to the next round support level 169.60 (former resistance from the end of June).

EURJPY: Classic Bullish Pattern 🇪🇺🇯🇵
There is a high chance that EURJPY will continue growing.
A bullish breakout of a neckline of an inverted head & shoulders
pattern leaves clear bullish clues.
Next resistance - 171.9
b]❤️Please, support my work with like, thank you!❤️
I am part of Trade Nation's Influencer program and receive a monthly fee for using their TradingView charts in my analysis.

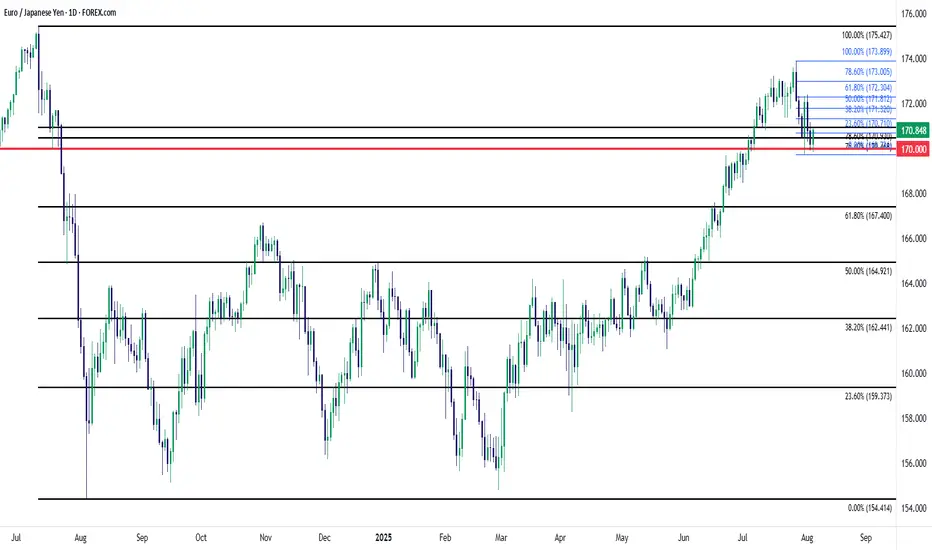
EUR/JPY 170.00 TestEUR/JPY was a high-flyer into late-July as the pair put in a very rare test above the 170.00 level. That price was almost in play back in 2007 and 2008, but ultimately the pair held about five pips below the big figure before plummeting on the back of the financial collapse.
Sixteen years later EUR/JPY was finally able to mount above 170, albeit temporarily, as price climbed above last summer until the massive reversal developed in July, sending prices spiraling all the way down to support around 155.00.
More recently, as Yen-weakness returned in the latter portion of Q2, combined with Euro strength as EUR/USD climbed to three-year-highs, EUR/JPY once again was able to push above the 170.00 handle.
Last week saw a bearish engulfing candlestick develop on Monday, and given the overbought backdrop at the time, the door quickly opened for bears. But since then, buyers have put up a stand around that same 170.00 level with an assist from last week's BoJ meeting.
At this point there's been a hold of higher-lows with the 170.00 psychological level coming into play to hold support. This keeps the door open for bullish continuation and the Fibonacci retracement produced by last week's pullback remains of interest with a few important levels of note. The 172.30 area is the spot for bulls to beat, as this would mark a higher-high and that would then open the door for a re-visit of 173.00 and if bulls can muster that, there's the potential for more as it'll look like a move of broader trend continuation. - js
ENTRY EURJPYDisclaimer:
This is merely a chart-based analytical trading idea and is not considered investment advice. Please manage your risks carefully and conduct your own research before making any trading decisions.