EURJPY: A Big Move In Making, Please Share Your Views! Date: 22/06/2025
Hello everyone,
I hope you’re all having a good weekend. As we previously discussed, we expected a sharp decline in Europe/JPY, but unfortunately, it didn’t work out in our favour due to the extremely bullish US dollar. This led to the crossing and invalidation of our two selling zones.
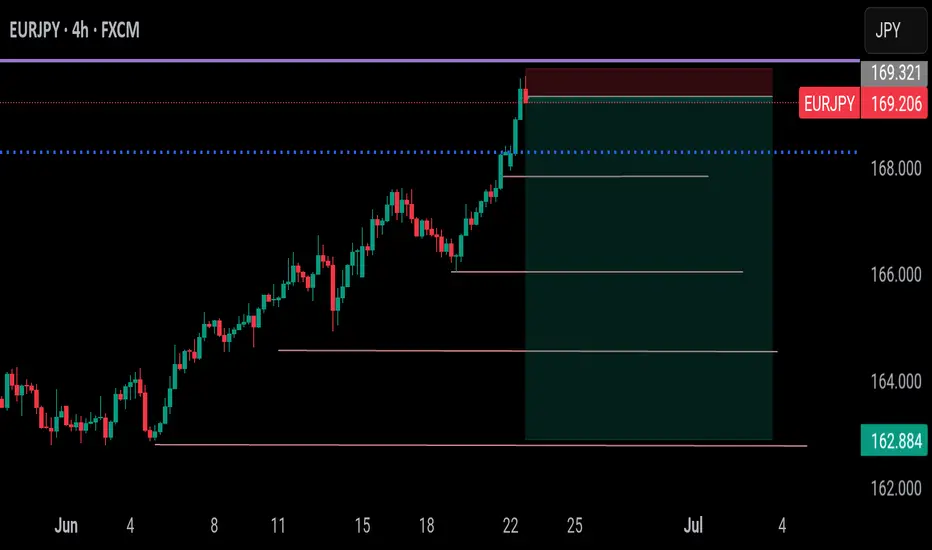
Looking at next week’s price projection, we can confirm that the price is heading towards 170.50 and may be selling at this level. Therefore, we will be keeping a stop loss at 171.50.
Once the trade is activated, we can set our target at 166.0, 163.50, and the final target will be placed at 158.50.
If you like our work, please like our idea.
Good luck and trade safely next week.
EURJPY trade ideas

Multi-Timeframe Analysis & Trend Continuation TradingThe EURJPY has recently violated an important level of structure leading us to make the prediction of price continuing to go higher.
In this video we'll take a look at where the next stopping point may be and what I'm waiting for the market to do in order to get involved in the trade.
If you have any questions, comments or just want to share your views/analysis, please do so below.
Akil

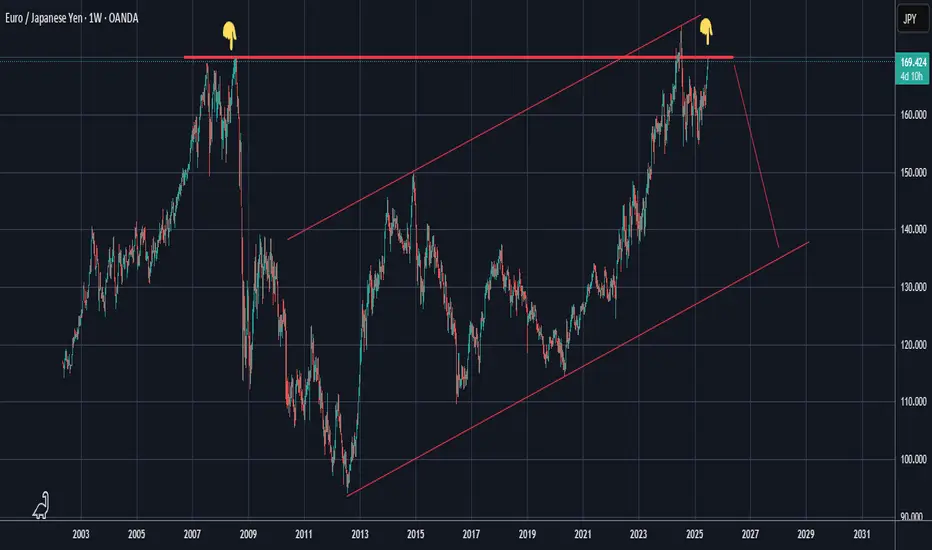
EURJPY - Over-Bought Big Time!Hello TradingView Family / Fellow Traders. This is Richard, also known as theSignalyst.
📈EURJPY has been overall bullish trading within the rising channel marked in blue. However, it is currently retesting the upper bound of the channel.
Moreover, the green zone is a major weekly supply.
🏹 Thus, the highlighted red circle is a strong area to look for sell setups as it is the intersection of the upper blue trendline and weekly supply.
📚 As per my trading style:
As #EURJPY approaches the red circle zone, I will be looking for bearish reversal setups (like a double top pattern, trendline break , and so on...)
📚 Always follow your trading plan regarding entry, risk management, and trade management.
Good luck!
All Strategies Are Good; If Managed Properly!
~Rich
Disclosure: I am part of Trade Nation's Influencer program and receive a monthly fee for using their TradingView charts in my analysis.

#EURJPY: Major Swing Sell +1100 Pips, One Not To Miss! The Japanese Yen (JPY) is most likely to continue its bullish trend, as the Dollar Index (DXY) is expected to decline due to the ongoing conflict between Israel and Iran. Historically, JPY and CHF, alongside gold and silver, have been favoured by global investors and remain bullish. Strong fundamentals and technical support further support our analysis.
The 167-169 price region remains a critical point for sellers, where we anticipate significant selling volume. There are two entry points to consider: one near the current price and another slightly further away. Please monitor volume and use smaller time frames for entries.
Our Swing Target is at 154, but you can also target smaller zones once the trade is activated. For instance, set take-profit levels at 164, 160, and finally, at 154.
To encourage and support us, you can like the idea, comment on it, or share it.
Team Setupsfx_
❤️❤️🚀🚀

I dare to say, I'm bearish EURJPY, GBJPY, UJI will be posting so that those who will enter will enter on time. I'm not looking for any upside objective on Yen pairs for now. Unless, we see otherwise.
Let the line guide you in taking partials.
Dont just enter once and leave this trade, compound it.
Once it enters profit, sell more and BE on first entry, once it falls and retrace, sell more and you'll be glad you did
EUR-JPY Bullish Breakout! Buy!
Hello,Traders!
EUR-JPY is trading in an
Uptrend and the pair made
A strong bullish breakout
Of the key horizontal level
Of 168.000 and the breakout
Is confirmed so we will be
Expecting a further bullish
Move up on Monday
Buy!
Comment and subscribe to help us grow!
Check out other forecasts below too!
Disclosure: I am part of Trade Nation's Influencer program and receive a monthly fee for using their TradingView charts in my analysis.

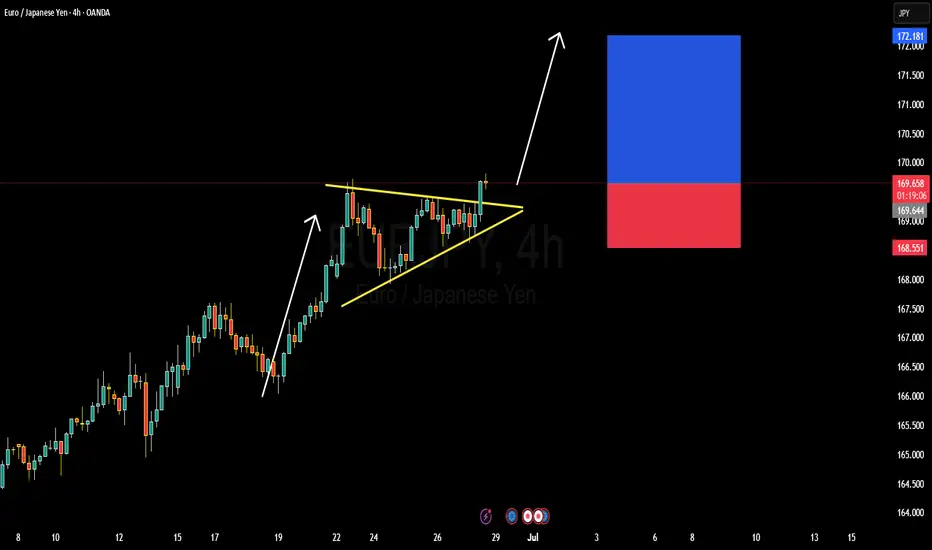
EURJPY BULLISH OR BEARISH DETAILED ANALYSISEURJPY has just broken out of a well-defined bullish pennant pattern on the 4H timeframe, confirming strong continuation potential to the upside. The price is currently hovering around 169.60 after consolidating in a tight structure, respecting both dynamic trendline support and horizontal resistance. This breakout signals renewed bullish momentum, and I'm now targeting the 172.10 zone as the next significant resistance level. The structure is clean, volume supported the breakout, and price action is aligned with the dominant uptrend.
Despite a relatively quiet start to the week—largely influenced by global risk-off sentiment surrounding Middle East tensions—EURJPY has held firm. Now that geopolitical jitters are easing slightly, yen weakness is resurfacing. The Bank of Japan remains firmly dovish, maintaining ultra-loose policy, while the Euro is supported by hawkish commentary from the ECB as inflation in the eurozone remains sticky. This divergence continues to fuel the long-term bullish bias for EURJPY.
Fundamentally, Japanese economic indicators remain soft, and there's still no clarity on when the BoJ will meaningfully shift policy. Meanwhile, EUR zone confidence indicators have stabilized, and speculation is growing around the ECB holding rates higher for longer into Q3. With widening yield differentials and a favorable risk sentiment return, this pair is positioned well for upside movement. Current momentum supports the probability of reaching the 172.00–172.10 area as risk appetite rebuilds across markets.
Technically and fundamentally aligned, EURJPY offers one of the strongest bullish continuation opportunities on the board right now. I will continue to monitor for minor dips as potential add-on areas, aiming for a full extension of the measured move from the pennant formation. Patience pays in setups like this where structure, sentiment, and macro all align.

EURJPY - Important Breakout !Hello Traders !
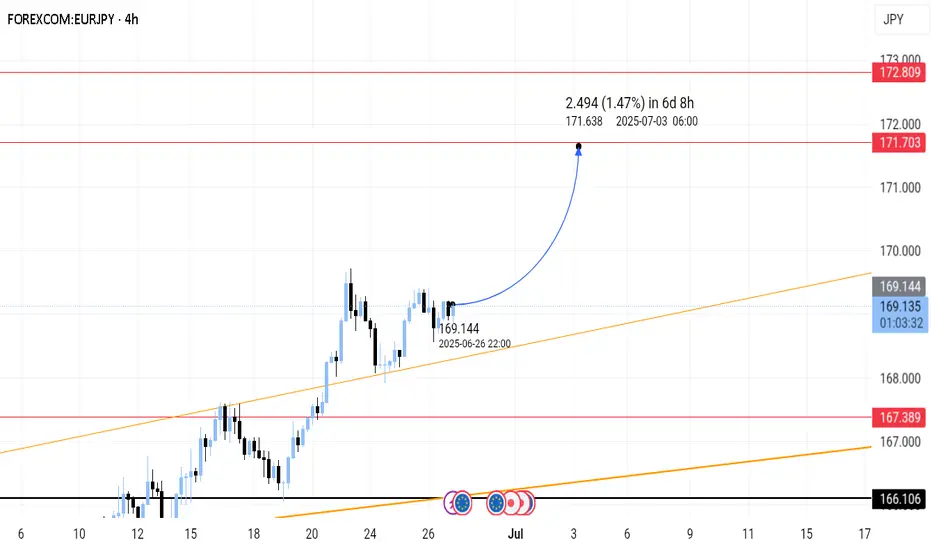
The EURJPY price broke the resistance level (167.520 - 168.018).
This key level becomes new support!
So, I expect a bullish move🚀
_______________
TARGET: 170.570

EURJPY BUY PROJECTION THIS WEEK!Price confirms a bullish trend from the daily timeframe. A buy opportunity is what we’re looking out for from the H4 timeframe.
We’d be monitoring price to see when market retraces to a previous resistance which now turn support so as to gain entry for a buy!

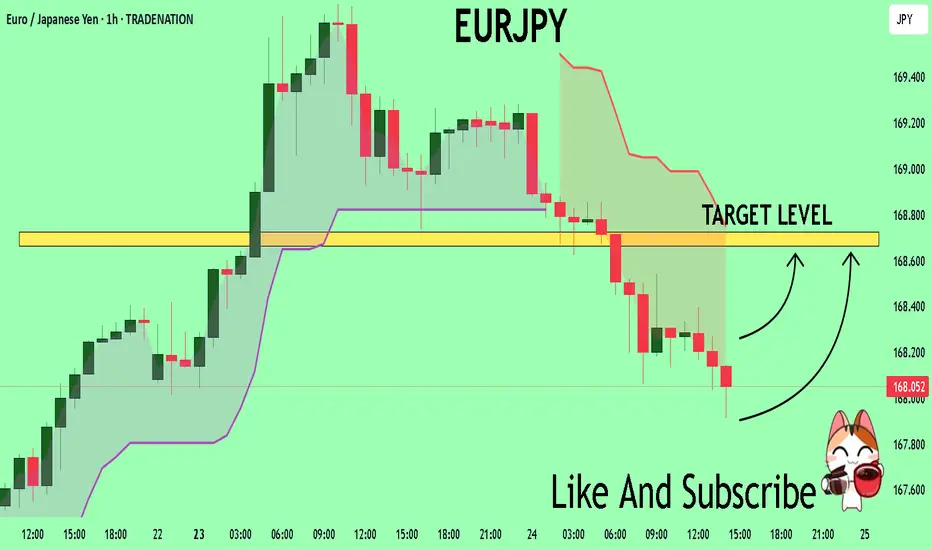
CHECK EURJPY SIGNAL READ CAPTAINPair: EURJPY
Direction: Short (Sell Setup)
Entry Zone: Around 169.200\169.100
Stop Loss: 169.500
Take Profits:
TP1: ~168.800
TP2: ~168.300
Final Target: 167.800

EURJPY Possible Swing Bearish Play EURJPY is shapimg up for some long-term bearish movement still to early for any plays. I will be looking to position my self in from august onwards if the fundamentals and technicals give me an indication.

EURJPY: Bullish Trend Continues 🇪🇺🇯🇵
EURJPY shows a strength after a test of a significant demand zone.
Bullish breakout of a resistance line of a flag pattern provides
a strong trend-following signal.
Goal - 169.64
❤️Please, support my work with like, thank you!❤️
I am part of Trade Nation's Influencer program and receive a monthly fee for using their TradingView charts in my analysis.

EURJPY Will Fall! Short!
Here is our detailed technical review for EURJPY.
Time Frame: 1D
Current Trend: Bearish
Sentiment: Overbought (based on 7-period RSI)
Forecast: Bearish
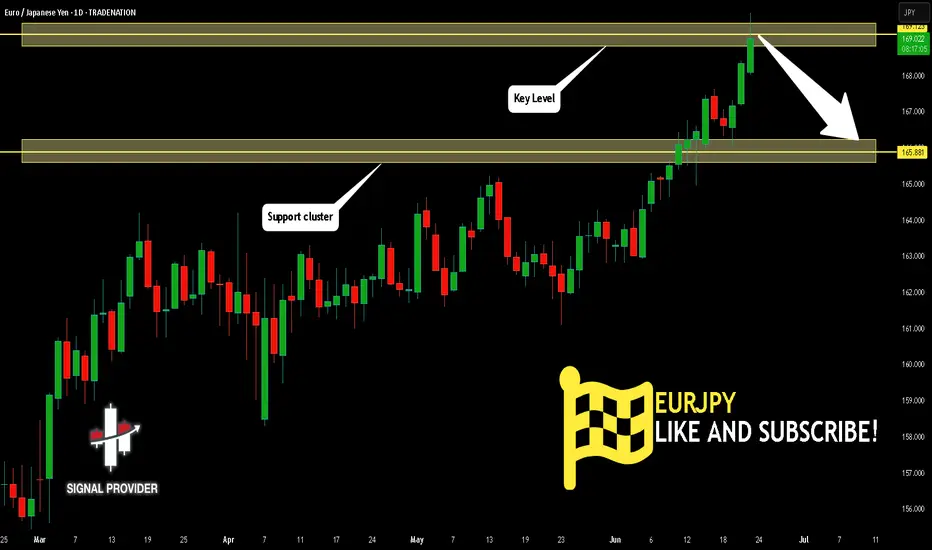
The market is trading around a solid horizontal structure 169.123.
The above observations make me that the market will inevitably achieve 165.881 level.
P.S
Please, note that an oversold/overbought condition can last for a long time, and therefore being oversold/overbought doesn't mean a price rally will come soon, or at all.
Disclosure: I am part of Trade Nation's Influencer program and receive a monthly fee for using their TradingView charts in my analysis.
Like and subscribe and comment my ideas if you enjoy them!
EUR/JPY Breakout Done , Long Setup Valid To Get 200 Pips !Here is my opinion on EUR/JPY , We have a very clear breakout and now i`m waiting for retest to broken res and new support and waiting for good bullish price action to enter a buy trade and targeting at least previous high , if the price go back below my support with daily closure then this idea will not be valid .

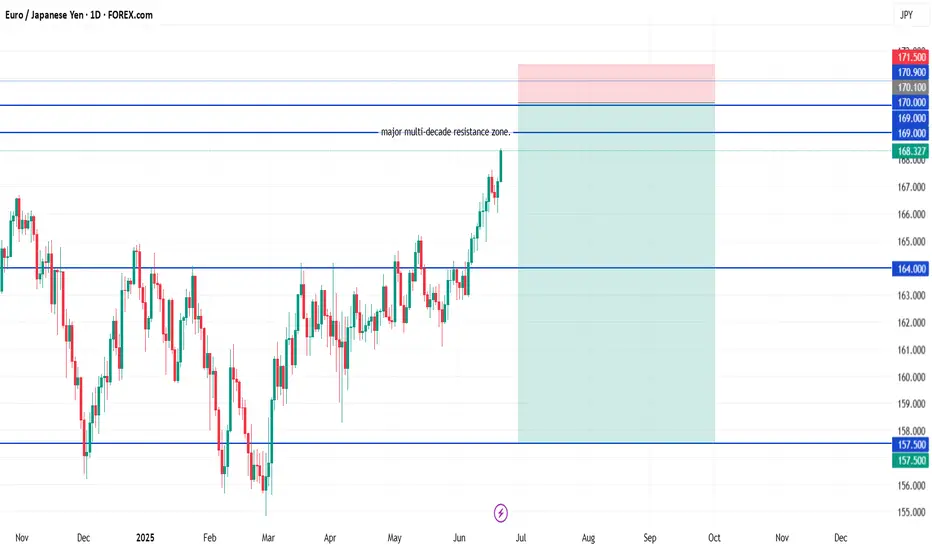
EUR/JPY Short✅ EUR/JPY Swing Short Setup (Multi-Entry)
🎯 Entries:
Entry 1: 169.00 (light position)
Entry 2: 170.10 (core entry)
Entry 3: 170.90 (final top entry)
🛡️ Stop Loss (Unified):
171.50
Placed above the entire resistance zone and previous all-time wick highs, allowing for normal trap behavior without overexposure.
🎯 Take Profits:
TP1: 164.00
TP2: 157.50
You can scale out partially at TP1 or run the full position to TP2 depending on how momentum builds.
EURJPY Will Explode! BUY!
My dear friends,
My technical analysis for EURJPY is below:
The market is trading on 168.01 pivot level.
Bias - Bullish
Technical Indicators: Both Super Trend & Pivot HL indicate a highly probable Bullish continuation.
Target - 168.66
About Used Indicators:
A pivot point is a technical analysis indicator, or calculations, used to determine the overall trend of the market over different time frames.
Disclosure: I am part of Trade Nation's Influencer program and receive a monthly fee for using their TradingView charts in my analysis.
———————————
WISH YOU ALL LUCK
EURJPYI saw an analysis on this pair and tried to get something like an early entry on it, but I noticed there's a lot going on on the smaller timeframes so I went to bigger and found some interesting facts like how the current price is at the area of previously strong supply zone/resistance zone. Which therefore imposes that we should see sellers coming in strong at any time now as we are in the sellers club, but this needs further confirmations from your side, what do you think?
EURJPY LONG IDEAI have been waiting for this EURJPY long setup to form for the past 2 trading sessions.
This morning I saw this beautiful bullish swing low formed and that is my entry signal for to take a long trade on EURJPY.
REASONS:
EURJPY is super bullish right now.
The Daily and 4Hour time frame trend is extremely bullish. So, am only looking to take a long buy to follow the trend direction.

EURJPY Setup Alert!
We’re waiting for the price to reach our marked level.
No emotional trades — let the setup come to you! ⏳
Levels are shown on the chart.
Follow us here: forexCSP

EURJPY- Sell Now Setup on 15 minute ChartEURJPY- Sell Now Setup on 15 minute Chart based on CRT method and Strategies based on TBS, M1 and LS at HTF. Accoridngly Targets are expeceted to be acheived with SL in place.

EURJPY Bearish momentum 4hr and daily chart analaysis EUR/JPY is currently entering a bearish phase, trading around a critical transition zone between 171.00 and 169.787. This area marks a key inflection point, and a clear break below could confirm the shift in momentum to the downside. If the bearish momentum continues to build, the pair could potentially decline further, targeting the support levels around 158.253 to 156.843.
