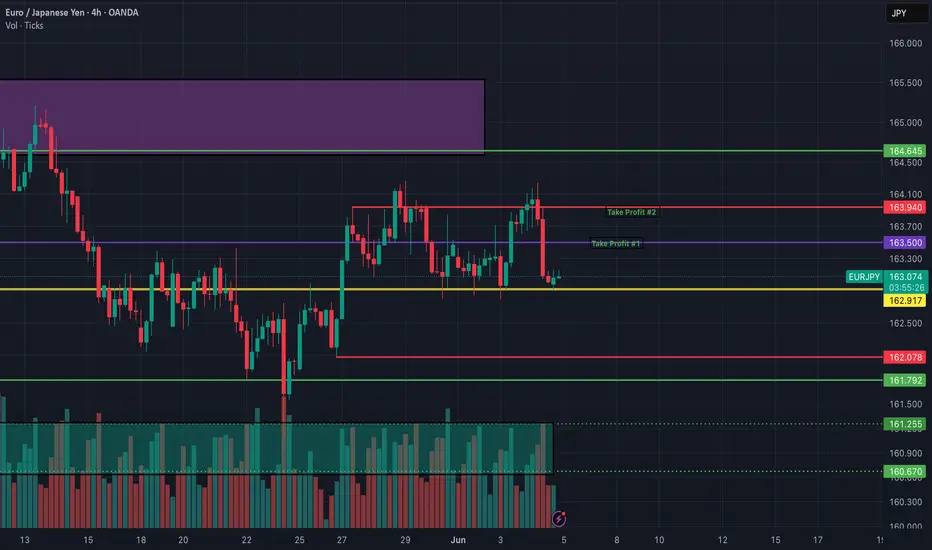
eurjpy sell signal. Don't forget about stop-loss.
Write in the comments all your questions and instruments analysis of which you want to see.
Friends, push the like button, write a comment, and share with your mates - that would be the best THANK YOU.
P.S. I personally will open entry if the price will show it according to my strategy.
Always make your analysis before a trade
EURJPY trade ideas

EURJPY ANALYSIS After seeing the previous week close really bullish on the daily and weekly timeframes, we could expect that momentum to continue pushing but since the pair is at a HH area on the daily we could expect a pull back before the bullish move kicks in

EURJPY Technical AnalysisEUR/JPY Technical Analysis – Buy vs. Sell Scenarios
Current Market Context (June 8, 2025)
Price: 165.018 (Closing)
Daily Change: +0.12% (Mild bullish momentum)
Key Levels:
Resistance: 165.277 (Daily High), 166.000 (Psychological), 167.000 (Upper Range)
Support: 164.741 (Daily Low), 164.000 (Critical), 162.000 (Strong Demand Zone)
Scenario 1: BUY (Long Trade)
Trigger:
Price holds above 164.741 (Daily Low) and bounces with rising volume.
Break above 165.277 (Daily High) confirms bullish continuation.
Targets:
166.000 (Psychological Resistance)
167.000 (Upper Range)
Stop-Loss: Below 164.000 (Invalidation Level)
Rationale:
Bullish momentum from the daily close (+0.12%).
Higher lows suggest buyer interest near 164.000–164.741.
Scenario 2: SELL (Short Trade)
Trigger:
Price breaks below 164.741 (Daily Low) with increased selling volume.
Rejection from 165.277 (Daily High) signals weakness.
Targets:
164.000 (Support)
162.000 (Strong Demand Zone)
Stop-Loss: Above 165.300 (Above Daily High)

EURJPY Ascending channel and bullish fvg 🚨 EURJPY Trade Setup 🚨
4H Timeframe Analysis by Livia 😜
💹 Pair: EURJPY
📈 Structure: Ascending Channel respected ✅
📊 Breakout: Confirmed above Bullish FVG – retest successful 🔥
📍 Entry Zone: 163.200 (Minor Support Holding)
🚀 Bias: Strong Bullish Momentum in play
🎯 Technical Target:
1️⃣ 165.000 – Next Key Resistance Level
🔒 Risk Managed – Watching PA for continuation or pullback setups.
#EURJPY #ForexSignals #PriceAction #BreakoutTrade #FVG #SmartMoney #TechnicalAnalysis #4HChart #LiviaTrades

LONG | EUR/JPY | 1D Macro Context: With ECB neutral and BoJ dovish, EUR/JPY favored to drift upward slowly as Yen weakness persists.
Structure: In a long-term bullish channel and recently bounced off the 50‑day MA near 163.0–163.5 .
Trigger:
Entry: Long on pullback to 163.50–164.00.
Stop: 162.80 (below channel support & LVN).
Target: 166.70 (upper channel range) → 168.00 zone.
R:R: ~1:2.5.
Framework: Entry aligns with liquidity sweep and bounce off HVN/50MA, supported by Elliott/Elliott-wave count and broader bullish range.
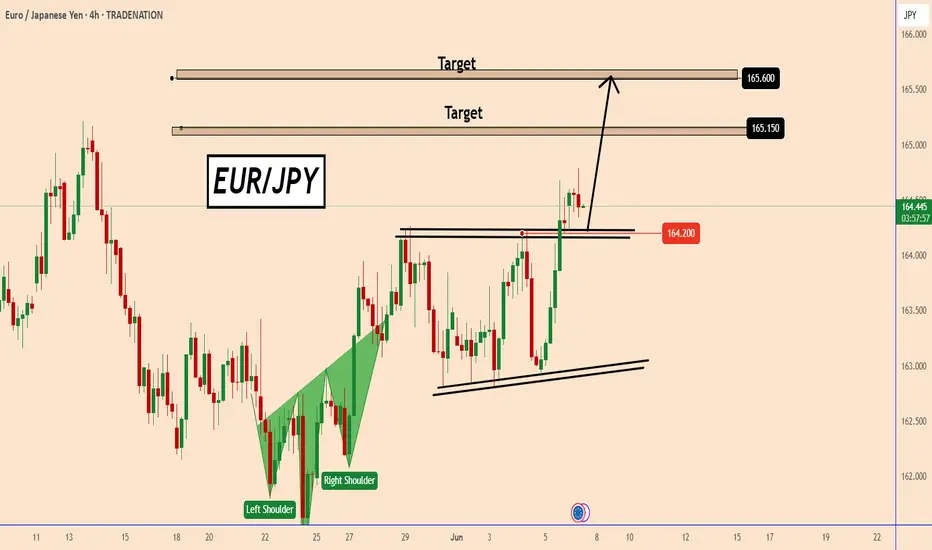
EURJPY : Bullish Breakout Indicates a Bigger MovementEURJPY: Bullish Breakout Indicates a Bigger Movement
Yesterday, during the ECB rate decision, EURJPY broke out from a large bullish pattern.
Actually, the price is testing the broken resistance, now turned into support.
The price is already testing 164.20 and probably during the coming week EURJPY may start a bigger bullish movement with targets 164.15 and 165.60
You may find more details in the chart!
Thank you and Good Luck!
❤️PS: Please support with a like or comment if you find this analysis useful for your trading day❤️
Disclosure: I am part of Trade Nation's Influencer program and receive a monthly fee for using their TradingView charts in my analysis.
EURJPYDamn! Clean trade for the week...Eurjpy went bullish as anticipated on the previous week ..Smooth Bull run as anticipated... Adios!

EURJPY: Short Trade with Entry/SL/TP
EURJPY
- Classic bearish setup
- Our team expects bearish continuation
SUGGESTED TRADE:
Swing Trade
Short EURJPY
Entry Point - 164.60
Stop Loss - 165.15
Take Profit - 163.56
Our Risk - 1%
Start protection of your profits from lower levels
Disclosure: I am part of Trade Nation's Influencer program and receive a monthly fee for using their TradingView charts in my analysis.
❤️ Please, support our work with like & comment! ❤️

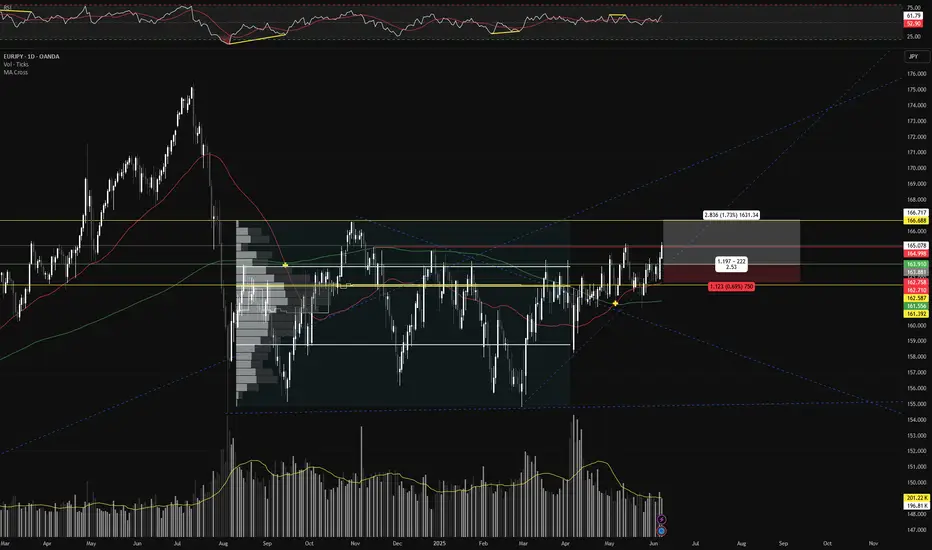
EURJPY Be ready to sell soon.Last time we looked at the EURJPY pair (February 26, see chart below), we gave a clear buy signal that wasted no time hitting straight our 162.250 Target:
With the Lower Highs trend-line now broken, a new pattern has emerged and that's a (blue) Channel Up. The current Bullish Leg is headed straight to the 8-month Resistance Zone, so we will be turning bearish there, targeting the 1D MA200 (orange trend-line) at 162.250.
-------------------------------------------------------------------------------
** Please LIKE 👍, FOLLOW ✅, SHARE 🙌 and COMMENT ✍ if you enjoy this idea! Also share your ideas and charts in the comments section below! This is best way to keep it relevant, support us, keep the content here free and allow the idea to reach as many people as possible. **
-------------------------------------------------------------------------------
💸💸💸💸💸💸
👇 👇 👇 👇 👇 👇

EURJPY Hit the CeilingPrice just kissed the 164.63 resistance I’ve been tracking and printed a rejection wick. Unless we close decisively above that shelf, I’m treating it as a fresh supply zone. My base case is a drift back toward the mid-range support at 164
Structure: clear descending channel; latest rally only tagged the upper rail


EURJPYEUR/JPY Analysis: 10-Year Bond Yields, Interest Rate Differentials, UIP, and Carry Trade
1. Current Bond Yields and Interest Rate Differentials
Eurozone 10-Year Yield: ~2.50% (Germany’s benchmark yield, down 3bps post-ECB rate cut) .
Japan 10-Year Yield: ~1.45% (recently fell to a 3-week low amid strong bond auctions) .
Yield Spread:
2.50% (EUR)−1.45% (JPY)=+1.05%
The Eurozone’s higher bond yield provides a carry advantage for EUR.
Policy Rate Differential:
ECB Deposit Rate: 2.00% (cut by 25bps on June 5, 2025) .
BoJ Rate: 0.50% (unchanged since March 2025) .
Rate Spread:
2.00% (EUR)−0.50% (JPY)=+1.50%
2. Uncovered Interest Rate Parity (UIP)
Theory: The EUR should depreciate against JPY to offset the +1.50% rate spread, eliminating arbitrage opportunities.
Reality: UIP often fails due to risk premiums and market dynamics. Despite the Eurozone’s higher rates, EUR/JPY remains supported by carry trade demand and JPY weakness tied to BoJ policy.
3. Carry Trade Dynamics
Mechanics: Borrow JPY (0.5% rate) to invest in EUR assets (2.0% rate), profiting from the +1.50% rate spread and +1.05% yield spread.
Current Viability:
Opportunity: The yield and rate differentials favor EUR, making the carry trade attractive.
Risks:
ECB Dovishness: Further rate cuts (markets price ~28% chance of a July cut) could narrow the spread.
BoJ Policy Shifts: Japan’s Ministry of Finance may reduce long-term bond issuance to curb yields , while the BoJ continues tapering bond purchases , limiting JPY weakness.
Trade Tensions: U.S. tariff policies cited by the ECB and BoJ could heighten volatility.
Key Data for JPY (Japan)
June 6:
2-Year JGB Auction: Yield at 0.691% (prev. 0.68%), signaling stable short-term debt demand.
3-Month Bill Auction: Reflects liquidity conditions and BoJ policy expectations.
Bank Lending YoY: Steady growth indicates domestic credit demand.
June 10:
PPI YoY: 4.0% (prev. 4.2%), easing input price pressures but still above BoJ’s 2% target.
June 11:
Machine Tool Orders YoY: 7.7% (prev. 8.1%), indicating slowing industrial demand amid global trade risks.
4. Key Economic Context
Eurozone: ECB cut rates to 2.00% but kept future easing options open, citing trade tensions and revised inflation forecasts (2.0% for 2025) .
Japan: BoJ held rates at 0.5% in May 2025, slashing GDP growth forecasts (0.5% for FY2025) due to trade risks .
Summary Table
Metric Eurozone (EUR) Japan (JPY)
10-Year Bond Yield 2.50% 1.45%
Policy Rate 2.00% 0.50%
Yield/Rate Spread +1.05% (bond), +1.50% (policy) —
Carry Trade Bias Bullish for EUR Bearish for JPY
Key Risks ECB dovishness, trade tensions BoJ yield control, fiscal sustainability
Conclusion
EUR/JPY Outlook: Moderately bullish for EUR due to yield and rate advantages, but UIP suggests potential long-term EUR depreciation.
Carry Trade: Profitable if ECB maintains rates and JPY remains weak, but monitor ECB guidance (July meeting) and BoJ bond issuance plans.
Trade Strategy: Favor EUR longs on dips toward demand floor.

EURJPY: Well supported Channel Up aiming for 166.700.EURJPY is bullish on its 1D technical outlook (RSI = 58.535, MACD = 0.340, ADX = 24.438) and is staging right now a rebound on the 1D MA50. This comes only days after the 1D MA200 HL rebound tight at the bottom of the Channel Up. This is a great opportunity to buy and aim for the R1 level (TP = 166.700).
## If you like our free content follow our profile to get more daily ideas. ##
## Comments and likes are greatly appreciated. ##

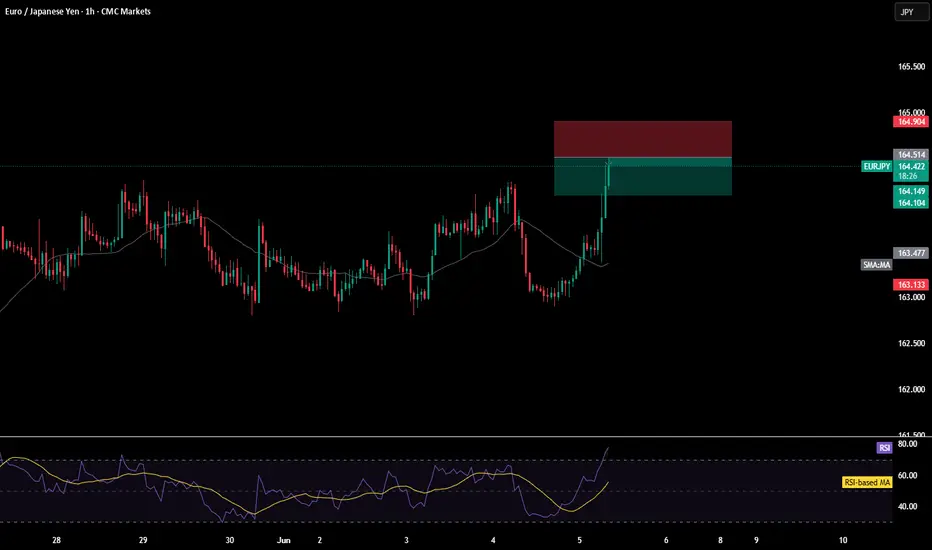
EURJPY h1 sellsell @ 164.50
stop: 164.90 (-40) pips
target 1: 1.6410 (+40) pips
target 2: 1.6360 (+90) pips
CMCMARKETS:EURJPY
EURJPY BUYAfter a downward movement price found support and bounced to the upside with impulse movement. after that the price created a correction and broke it. Therefore i expect the price move further to the upside.
Entry: 162.97
Tp: 164.49
Sl: 162.22
RR: 2:1
#forex #eurjpy #technicalanalysis

EURJPY: Waiting For ConfirmationEURJPY is currently in a bullish trend. Following a new higher high and close on the 4-hour chart, the pair started to consolidate within a horizontal range.
I'm looking for a bullish breakout above the resistance level, with a close above 164.26 on the 4-hour candle signaling buyer strength.
This would confirm a continuation of the bullish trend, with the next resistance target at 165.00.

EURJPY 4H Short Setup📘 Educational Caption for Your Trading Chat
🟥 EURJPY 4H Short Setup (Smart Money Strategy)
I’ve entered a short on EURJPY from 163.884, following a solid Smart Money narrative — price respected a previous Order Block (O-B) and showed strong rejection after mitigating a supply zone.
📉 Entry: 163.884
🎯 Target: 162.657
🛡️ Stop Loss: 164.302
⚖️ Risk-Reward: ~1:3 — a clean and high-probability setup
The setup is based on a bearish Break of Structure (BOS) and a retracement into a premium zone. We’re now seeing reaction and rejection from the inefficiency (FVG), indicating a potential move back to demand.
🔔 Note: Entries like this require patience. Always let the trade play out — no rush.
⚠️ Disclaimer: This trade idea is shared for educational purposes only. Make sure to conduct your own analysis and manage your risk accordingly.

ECB Rate Cut - EUR/JPY Trading ImpactThe European Central Bank (ECB) is expected to cut rates by 25 bps today, lowering the deposit rate to 2.00%. While this move is largely priced in, what matters for markets—especially EUR/JPY—is the forward guidance.
Relevance to EUR/JPY:
Rate Cut = EUR Bearish: Lower rates reduce euro appeal, especially vs. the yen, which is still heavily influenced by the Bank of Japan’s ultra-loose policy. A clear ECB dovish tone may weigh on EUR/JPY.
ECB Caution May Limit EUR Downside: If the ECB signals it's nearing the end of cuts or expresses concern over sticky inflation, it could support EUR. This would limit downside in EUR/JPY or even trigger a rebound.
BOJ Policy Still Ultra-Loose: Japan’s rates remain near zero, and unless the BOJ surprises with a hawkish shift (unlikely short term), EUR/JPY is more likely to react to ECB tone than BOJ policy.
Risk Sentiment Matters: EUR/JPY often tracks risk appetite. If markets interpret the ECB cut as growth-supportive, and global equities rise, EUR/JPY could hold firm or climb despite the rate cut.
Trading Implications
Dovish ECB = EUR/JPY downside, especially if markets price in more cuts.
"One-and-done" message = EUR/JPY support or slight upside.
Watch for BOJ comments or risk sentiment shifts to fine-tune positioning.

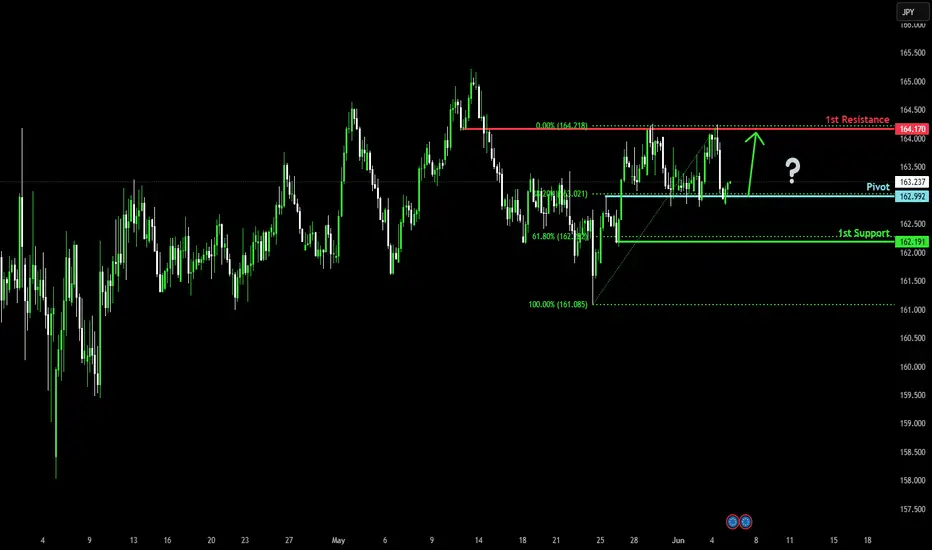
Could the price bounce from here?EUR/JPY has reacted off the pivot that lines up with the 38.2% Fibonacci retracement and could bounce to the 1st resistance.
Pivot: 162.99
1st Support: 162.19
1st Resistance: 164.17
Risk Warning:
Trading Forex and CFDs carries a high level of risk to your capital and you should only trade with money you can afford to lose. Trading Forex and CFDs may not be suitable for all investors, so please ensure that you fully understand the risks involved and seek independent advice if necessary.
Disclaimer:
The above opinions given constitute general market commentary, and do not constitute the opinion or advice of IC Markets or any form of personal or investment advice.
Any opinions, news, research, analyses, prices, other information, or links to third-party sites contained on this website are provided on an "as-is" basis, are intended only to be informative, is not an advice nor a recommendation, nor research, or a record of our trading prices, or an offer of, or solicitation for a transaction in any financial instrument and thus should not be treated as such. The information provided does not involve any specific investment objectives, financial situation and needs of any specific person who may receive it. Please be aware, that past performance is not a reliable indicator of future performance and/or results. Past Performance or Forward-looking scenarios based upon the reasonable beliefs of the third-party provider are not a guarantee of future performance. Actual results may differ materially from those anticipated in forward-looking or past performance statements. IC Markets makes no representation or warranty and assumes no liability as to the accuracy or completeness of the information provided, nor any loss arising from any investment based on a recommendation, forecast or any information supplied by any third-party.
EUR/JPY BullishLooking For EUR/JPY to react off the 163.000 support and resistance zone and continue the buyers momentum. Anticipating price to break through the 163.250 mark and 163.500. May expect a slight pullback before reaching 163.500 however buyers are still appear to be in control
EUR_JPY VERY RISKY LONG|
✅EUR_JPY is set to retest a
Local support level below at 162.900
After trading in a local downtrend for some time
Which makes a bullish rebound a likely scenario
With the target being a local resistance above at 163.112
LONG🚀
✅Like and subscribe to never miss a new idea!✅
Disclosure: I am part of Trade Nation's Influencer program and receive a monthly fee for using their TradingView charts in my analysis.

EURJPY higher bearish expectations from here
OANDA:EURJPY analysis before this one, is be closed, i am note will share new analysis on EJ soon.
ASCENDING CHANNEL visible, price in zone currently, after ISM events today, we are not see break of res zone 164.250, which for me having positive imact on bearish expectations here.
Trend line is breaekd and soon exxpecting to see and break of ASCEDING CHANNEL and higher bearish fall continuation.
SUP zone: 164.250
RES zone: 161.750, 160.900

EURJPY Technical Analysis! SELL!
My dear subscribers,
My technical analysis for EURJPY is below:
The price is coiling around a solid key level - 163.50
Bias - Bearish
Technical Indicators: Pivot Points High anticipates a potential price reversal.
Super trend shows a clear sell, giving a perfect indicators' convergence.
Goal - 162.79
My Stop Loss - 163.85
About Used Indicators:
By the very nature of the supertrend indicator, it offers firm support and resistance levels for traders to enter and exit trades. Additionally, it also provides signals for setting stop losses
Disclosure: I am part of Trade Nation's Influencer program and receive a monthly fee for using their TradingView charts in my analysis.
———————————
WISH YOU ALL LUCK
