EUR/JPY CONTINUES TO BUY?i think the EUR/JPY will continue the with the bullish movement atleast up to the 169.272 level, it retested the uptrend(1) and it seems like its breaking instead of retesting uptrend (2) if it closes with a good bullish candlestick i will consider buying.
EURJPY trade ideas

EURJPY SELL Signal. Don't forget about stop-loss.
Write in the comments all your questions and instruments analysis of which you want to see.
Friends, push the like button, write a comment, and share with your mates - that would be the best THANK YOU.
P.S. I personally will open entry if the price will show it according to my strategy.
Always make your analysis before a trade

EURJPYEURJPY.on structure look for POE on lower time frame and buy ,i have a daily buy confirmation but entry is poor ,risk management is key.
#eurjpy

TRADING PLAN: EURJPY LONG TRADE SETUP Given the bullish sentiment in EJ today, and the successful liquidity grab at the Asian session low, we'll take a long position. Our initial target is a 1:1 risk-reward ratio, followed by a 1:2 ratio after securing some profits.

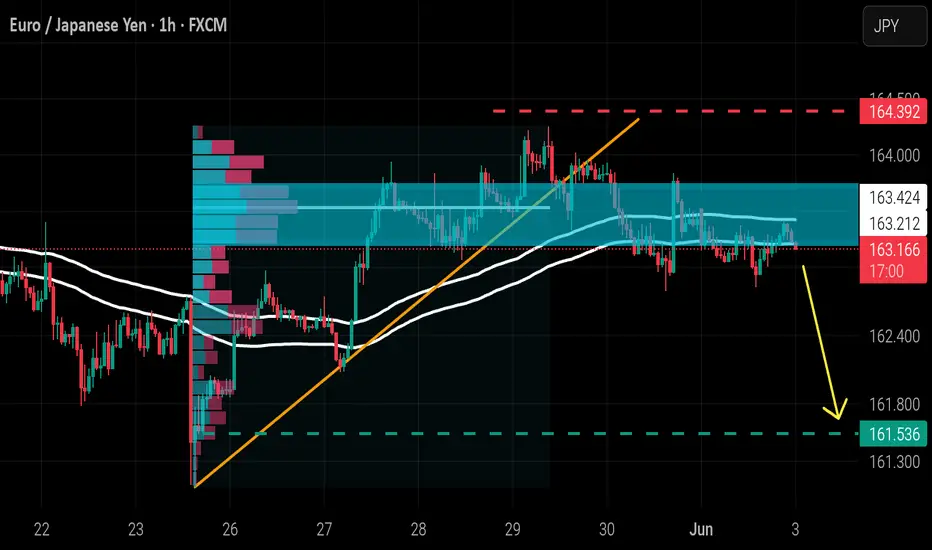
Trading Signals for EUR/JPY buy above 163.38 or sell blow 163.38Early in the American session, the EUR/JPY pair is trading around 163.200, below the downtrend channel formed on may 13 and showing signs of exhaustion.
The euro could resume its bearish cycle in the coming hours. However, there is strong resistance around 163.836 and around 164.259. Both levels could act as a barrier to the euro. and after a technical rebound, it could resume its bearish cycle.
If the euro falls below 162.815, we could expect it to continue falling, with targets at the 200 EMA around 162.261, and it could even reach the bottom of the downtrend channel around 161.089.
The indicator is showing a negative signal, so any technical rebound will be seen as a signal to sell. The indicator also suggests that EUR/JPY could reach the psychological level of 158.280 in the short term.

EURJPY Sell PossibleytIf you want to Increase you R:R So you put sl recent high and risk half if sl hit So Sell Again and put sl to high that i put..

EUR / JPYAfter breaking the uptrend line and moving averages and closing below the volume zone, we will now enter selling.
EURJPYEurjpy, a good pair to swing, looking forward to go bullish once price hits the 162.000 mark, Currently it is 12:10 pm Monday into to the New York Session, anticipating a minor liquidity sweep on either New York Killzone or the Asian open ..Let's wait and see how the market unfolds ...Adios!...

EURJPY: First red day, new monthly cycle!Hello everyone and welcome back to my channel! As always, my analysis are not a financial suggestion, neither a way to predict the market direction.
Predicting and guessing is quite 50/50, my job is hunting the best trade setup for the day, and my analysis are only a tool to identify a great risk reward and to align the setup with the overall thesis.
EURJPY, ended the month of May with an interesting signal, and I'm looking to potentially complete a two week Pump and dump, if it will setup correctly during the upcoming days.
Let's see it in depth, zooming into the previous week!
Monday, opening range of the week, the weekly boundaries are in place, long triggered in the market, starting the day with a pump before Asia session.
Tuesday, initial balance, the market pumped stronger higher, expanding the range, setting the currently weekly high low.
Long traders have been triggered for the second time, and the market closed in breakout. (Other time frames may be driving this move!)
Wednesday, midpoint range of the week, nothing really happened, the market stayed inside, up high into the weekly high, closing the day as an "inside" signal, which typically can be an interesting signal for explosive move.
Thursday, the weekly high has been broken for the third time, long traders are triggered one more time, and eventually (we don't know it certainly), volume can be trapped up high, and the market could shift soon. The breakout of the weekly high, looks like failed and we might start watching for a great reversal.
Friday, last trading day of the week and the month of May, placed a lower low (breaking in structure) and pumped back up inside the daily range, near the Thursday closing price, closing the week as a first red day.
FIRST RED DAY, typical is a reversal signal when it setup properly, but as per my experience and backtest, I don't have many templates where the market fall on Monday. It might happen because it is the first day of the new month and we can see interesting moves, but currently I do not see the setup for today, unless major red news on schedule at 10am NYT might be particularly volatile.
What am I looking for?
In order to validate this signal, I want to partecipate in a pump and dump scenario, setting up during the 3 session Asia, London and NY, not necessarily today, but until the signal will be valid.
Can this market go higher?
Absolutely yes, I repeat, I'm not Nostradamus ahah I do not use technical analysis to forecast, but only to research for the risk reward eventually I will position myself in the market.
I will update this post until FRD signal will be valid!
Gianni

EURJPY Range Breakdown Alert | Watch 146.348 If Support Breaks!EURJPY is currently trading inside a well-defined sideways consolidation between 164.430 resistance and 155.073 support.
The pair is struggling to break above the resistance zone, and repeated rejections are pointing to a potential bearish move ahead.
📉 If we see a clean breakdown below 155.073 with volume confirmation, the next major support sits at 146.348.
⚠️ Always wait for confirmation before entering. Not financial advice – just a chart-based technical view.

EURJPY SEll ideaI Belive that's a high possible setup you can take trade right now or you can wait for any entry confirmation... Up to You

EURJPY - 02.06.2025 - 06.06.2025 Looking for SHORTEURJPY - 02.06.2025 - 06.06.2025 Looking for SHORT position on EURJPY

As ECB Ready's "Final Cut", EJ "Begins Reversal"OANDA:EURJPY has began to potentially form a very strong Triple Reversal Pattern, The Head and Shoulders @ the Resistance Level lasted visited May 14th.
I say "potentially" because the "Right Shoulder" or recent Lower High has been created but we still wait for the final decline to the "Neckline" or Support Area formed by the Lows separating the "Head" from the "Shoulders" or Higher High from the Lower Highs in the pattern!
Signs of Potential Head & Shoulders:
1) Left Shoulder is an Oversold High
2) A Higher High is created at a level of Resistance
3) The Head not only has the Most Volume concentrated in the Pattern, but is also the start of the RSI Divergence from Price
4) Right Shoulder is formed and unable to surpass the Left Shoulder
..Bringing us to a very important tell..
5) Volume Decreases and logs a 3rd Divergent High in the RSI @ the creation of the Right Shoulder
Now we must WAIT for CONFIRMATION of the Pattern!
This will come when Price:
1) Declines to the Neckline
&
2) Makes Successful Breakout
Once the Head & Shoulders is Confirmed and Breakout is Validated:
- This could deliver great Short opportunities as a Head and Shoulders Breakout and Retest at the Neckline being the Last Line of Defense for the Bulls if Bears can push Price through and pick up Volume!
Fundamentally, BOJ Governor Kazuo Ueda will be speaking on Tuesday, June 3rd where we could see volatility come in for JPY.
The ECB is expected to cut rates by 25 bps from 2.4% to 2.15% on Thursday, June 5th and this could be the Last Cut we see the ECB plan to make until they see downside growth risks make more cuts likely.

EURJPY Weekly Analysis – Major Structural Breakout & Target🧱 1. Consolidation Zone: The Dual Directional Area
From around August 2024 to May 2025, EURJPY traded inside a well-defined consolidation range, marked between approximately 155.00 to 165.00. This phase can be categorized as a Dual Directional Zone, meaning both buyers and sellers had tactical entries, but the market was in accumulation/distribution mode.
This phase often traps breakout traders and builds liquidity on both sides.
Price repeatedly swept highs and lows inside this zone but lacked any commitment, signaling that larger players were building positions.
The flat structure over months hinted that a major move was imminent.
⚠️ 2. Major CHoCH (Change of Character)
The first clue of shifting momentum was the CHoCH, which signaled a change in direction and flow of control.
The lower highs and lower lows began to shift into higher lows, showing buying strength beneath the surface.
This change didn’t immediately lead to breakout, but it marked the early intention of bullish dominance.
🚀 3. Major BOS (Break of Structure): Confirming the Bullish Bias
The clean break above the range high was the confirmation of a major bullish BOS.
This wasn’t just a minor pop — it was an aggressive breakout, validating that institutional liquidity had been accumulated and was now being deployed.
The price ran swiftly toward the Bullish Target Zone (~177.50–180.00) with very little pullback, suggesting urgency from buyers or short-covering from trapped sellers.
🎯 4. Bullish Target Reached – What's Next?
Price has hit the projected Bullish Target Area — a region of prior imbalance and psychological round numbers.
Traders who caught the breakout now face a critical decision point: Will price continue higher into price discovery mode, or is this the exhaustion phase?
If price holds above the BOS level (~165.00), there’s still room for continuation. But signs of rejection or slowing momentum here could lead to a correction.
🔻 5. Bearish Alternative: Trap and Reversal Scenario
The bearish path is not out of play — in fact, this move upward could potentially be a liquidity sweep.
If price fails to stay above the BOS and rapidly closes back into the consolidation range, it would suggest a bull trap.
This would confirm a deviation, which often leads to violent reversals.
The projected Bearish Target Zone (~145.00–147.50) aligns with prior unmitigated zones and imbalance that may attract price if sentiment flips.
🧭 6. Trading Strategy & Risk Planning
For Bulls: Watch for consolidation above 165.00. Breakout + Retest entries toward 180.00 or beyond offer high R/R.
For Bears : Look for exhaustion or fakeout patterns (like a Quasimodo or supply engulfing) near current highs. A breakdown and close below 165.00 signals short entries targeting 150s and potentially 147s.
💬 Final Thoughts:
This chart is a prime example of how patience during a range and reaction after breakout pays off. Smart traders don’t chase — they prepare.
A bullish continuation may still be in play.
However, if this move was only a liquidity purge, the reversal could be deep and fast.
Stay alert, mark your key levels, and trade what you see — not what you feel.

EURJPYRight time to take an entry in EURJPY as its in uptrend and is at exactly at support level, target 1:2, Buy at 163.260 and take profit at 163.720

CHECK EURJPY SIGNAL READ CAPTAINeurjpy) buy zone
( trade satup )
entry point (163.260) to (163.215) 📊
first tp (163.310)📊
2nd target (163.400) 📊
last target (163.530) 📊
stop loss (163.140)❌

EURJPY SHORTwith safe haven assets expected to be bullish, i expect JPY to be strong against risk on currency like euro. EURJPY is expected to fall to complete a triange formation in the coming weeks before the bullish impulsive leg.


EurJpy Trade IdeaYesterday I published a long set up on EJ and stated why I was going long on the pair. After markets opened back up I had the retest and candle closure I wanted to see. Price ended up playing out as expected where 1:3rr targets were then smacked! I'll personally be looking to get into some more longs on the pair once price can give a pullback and show some type of bullish candle closure. We'll see what happens with EUR having a bank holiday today.

EURJOY Can continue to fall and Excite trigger moving EUR/JPY testing a key resistance level within a trading range. However, the recent attempt to break above this level resulted in a false breakout, followed by price consolidation within a flat structure.
Amid a weakening U.S. dollar and a strengthening Japanese yen, the pair is experiencing cross-currency pressure. This has led to the formation of a strong support base around the 163.000 and 162.200 levels.
Please note that and share your thoughts in comments for more analysis Thanks.

EURJPY: Move Up Ahead! 🇪🇺🇯🇵
EURJPY is going to rise more after breaking
a resistance line of a tiny horizontal consolidation range
that was formed on a retest of a recently broken daily structure.
Goal - 164.8
❤️Please, support my work with like, thank you!❤️
I am part of Trade Nation's Influencer program and receive a monthly fee for using their TradingView charts in my analysis.

CHECK EURJPY SIGNAL READ CAPTAINeurjpy) sell zone
( trade satup )
entry point (163.600) to (163.550) 📊
first tp (163.400)📊
2nd target (163.200) 📊
last target (163.000) 📊
stop loss (163.800)❌

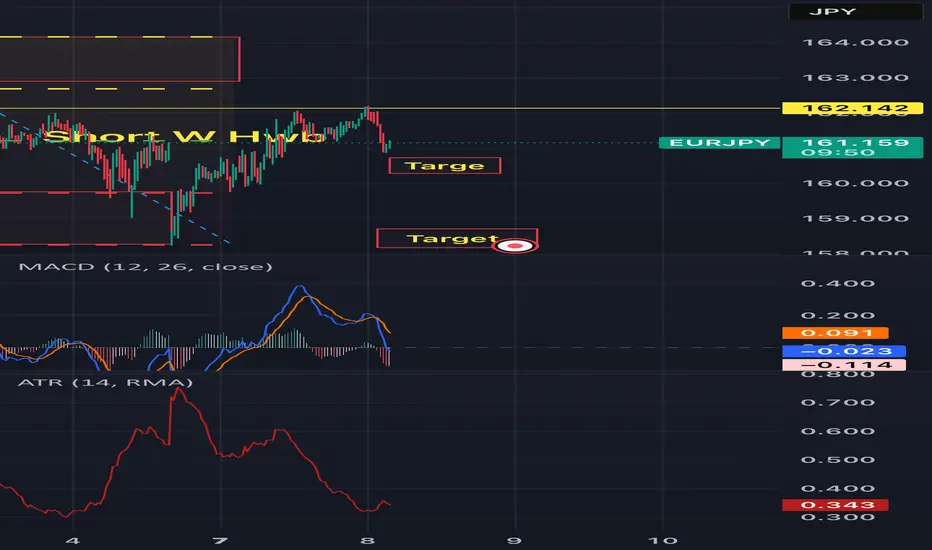
Short budddy!!!Overall weekly short bias on this pair imo.
My 50% pull back
My divergence
And price action has triggered for me to consider these target areas for shorts
160.75 is my first target
158.00 is my second target area
What are your though?
Trade safely my friends