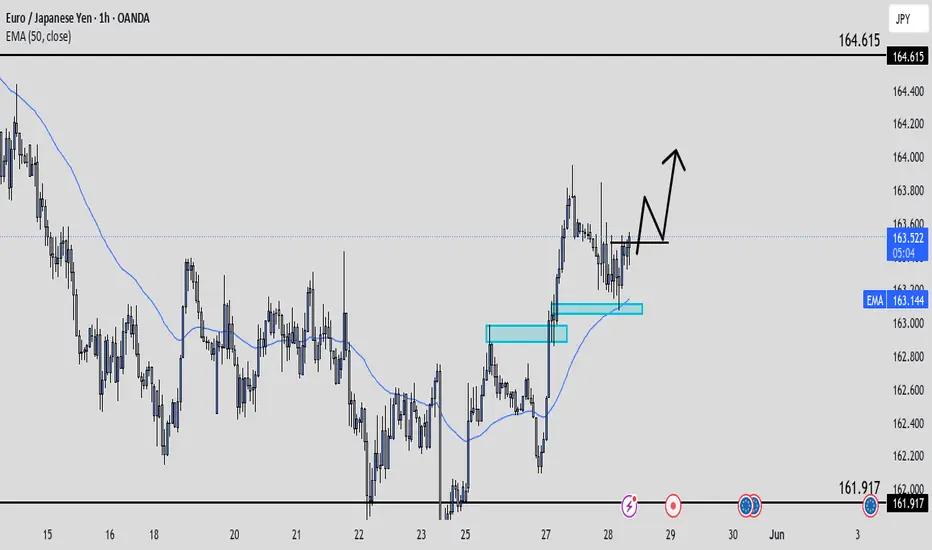
EURJPY: Top-Down Analysis & Trading PlanEURJPY has surpassed and closed above a significant daily resistance level, which has now become support.
We are observing a retest of this broken structure.
To enter a long position, look for confirmation through a breakout of the horizontal range on the hourly chart.
A close of an hourly candle above its resistance will signal buyer strength.
A bullish continuation is expected towards the 164.63 level.
EURJPY trade ideas

EURJPY: Japan's (MoF) may reduce its issuance of long-term bondsEURJPY: The Japanese yen falls as Japan's Ministry of Finance (MoF) may reduce its issuance of long-term bonds.
Today, the Japanese yen is the worst-performing currency across the board.
The decline is linked to speculation that Japan’s Ministry of Finance (MoF) may reduce long-term bond issuance due to weak demand and rising yields.
This speculation stems from a rare questionnaire the MoF sent to market participants, asking for their views on issuance and overall market conditions. The move was seen as unusual, fueling concerns about potential changes in Japan’s bond strategy.
Technical Analysis
EUR/JPY has broken out of a complex inverse head and shoulders pattern, with the above news acting as a catalyst for its bullish momentum.
While the price may take a short pause, further upside remains likely, with targets at 164.30 and 165.00.
You may find more details in the chart!
Thank you and Good Luck!
❤️PS: Please support with a like or comment if you find this analysis useful for your trading day❤️
Disclosure: I am part of Trade Nation's Influencer program and receive a monthly fee for using their TradingView charts in my analysis.

EURJPY: This week and next month analysis.Jen has Strengthen itself, may be under pressure of Trump administration, this may have ended or not. but technically we are ready see more bearish days for pairs against JPY:
The indicated levels are determined based on the most reaction points and the assumption of approximately equal distance between the zones.
Some of these points can also be confirmed by the mathematical intervals of Murray.
You can enter with/without confirmation. IF you want to take confirmation you can use LTF analysis, Spike move confirmation, Trend Strength confirmation and ETC.
SL could be placed below the zone or regarding the LTF swings.
TP is the next zone or the nearest moving S&R, which are median and borders of the drawn channels.
*******************************************************************
Role of different zones:
GREEN: Just long trades allowed on them.
RED: Just Short trades allowed on them.
BLUE: both long and short trades allowed on them.
WHITE: No trades allowed on them! just use them as TP points

EurJpy Trade IdeaWith EJ ranging between two major levels and respecting the support level below once again, I'll personally be looking to get into some longs on the pair for this week. We had a clean flip ofs structure once price tapped into the support below. Price did break below the support level but failed to continue heading bearish. Once price can break and retest from the smaller time frame range I'll execute longs with a 1:3rr target. We'll see what happens.
EUR/JPY For Bearish as pull-backyou can go short now
general trend is up trend
current phase is pull-back
have fun :)
EURJPY: Important Breakout 🇪🇺🇯🇵
EURJPY broke a significant resistance cluster on a daily.
We see its retest now.
I think that the price will start rising from that and reach
at least 164.5 level.
❤️Please, support my work with like, thank you!❤️
I am part of Trade Nation's Influencer program and receive a monthly fee for using their TradingView charts in my analysis.

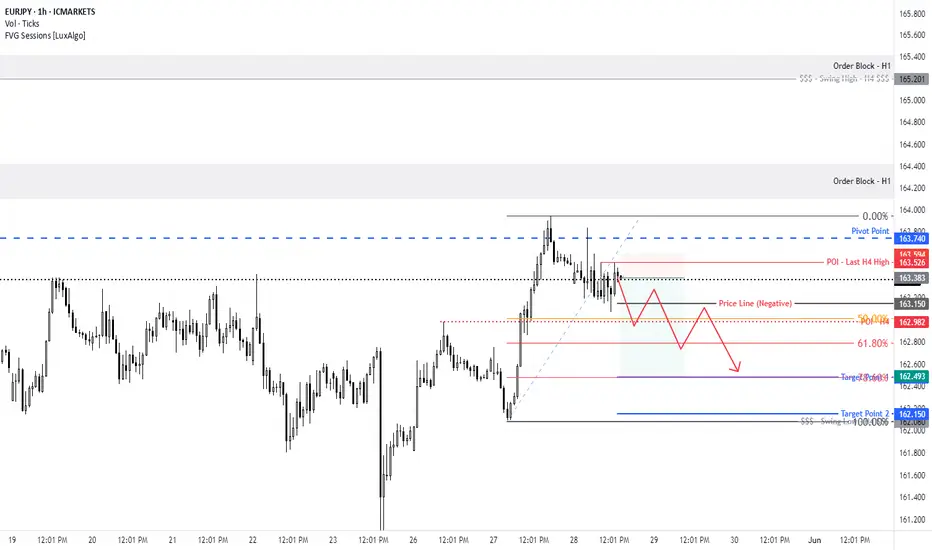
EURJPY → False breakout of resistance. Reversal?FX:EURJPY is testing the resistance of the trading range as part of a distribution movement, but the situation ends with a false breakout and price consolidation within the flat.
Against the backdrop of the falling dollar, the Japanese yen is strengthening and thus exerting a corresponding influence on the currency pair. EURJPY is forming a false breakout of resistance within a distribution movement formed after a retest the support of the flat. The price returns to the channel. After a false breakout of resistance and a return of the price below a strong key level, a base is forming in the form of support at 163.2 (trigger).
Resistance levels: 163.4, 163.6
Support levels: 163.2, 162.7
A breakdown of the 163.2 trigger and price consolidation below the key level could intensify the sell-off, triggering a further decline.
Best regards, R. Linda!

Lingrid | EURJPY support Zone Buy Setup in Sideways MarketThe price perfectly fulfilled my previous idea . FX:EURJPY is currently hovering above the 162.810 breakout level after reclaiming it following a fake breakout to the downside. The price action forms a potential higher low above the upward trendline, suggesting bullish continuation is in play. A successful bounce here could aim for 164.450 as the next resistance test. Momentum will likely pick up if the price stays above the rising trendline.
📈 Key Levels
Buy zone: 162.810
Buy trigger: bullish candle bounce above trendline
Target: 164.450
Sell trigger: daily close below 162.810
💡 Risks
Trendline failure would negate bullish structure
Resistance at 164.450 could attract sellers
Consolidation may extend before a breakout confirms direction
Traders, if you liked this idea or if you have your own opinion about it, write in the comments. I will be glad 👩💻

EJ CD DEEP SHARK HAMRONIC PATTERNPrice is back into bullish trend channel. Looking for a new push up. Harmonic pattern also shows that price can still seek a new HH.

EURJPY SELL Eurjpy is expected to sell after the completion of the gartley pattern. over 2400 drop is expectred

Wednesday signal The market is on an uptrend as some or us will lack patience and try to reverse it. You should always be a friend with the trend

EURJPY: Bearish Continuation
Balance of buyers and sellers on the EURJPY pair, that is best felt when all the timeframes are analyzed properly is shifting in favor of the sellers, therefore is it only natural that we go short on the pair.
Disclosure: I am part of Trade Nation's Influencer program and receive a monthly fee for using their TradingView charts in my analysis.
❤️ Please, support our work with like & comment! ❤️

EURJPY could be about to soarThe price is stuck in a large ascending triangle pattern. But with stocks moving higher, cryptocurrencies gaining momentum, and the trade war easing, could this pattern finally break? Watch the video to see which levels matter.
This content is not directed to residents of the EU or UK. Any opinions, news, research, analyses, prices or other information contained on this website is provided as general market commentary and does not constitute investment advice. ThinkMarkets will not accept liability for any loss or damage including, without limitation, to any loss of profit which may arise directly or indirectly from use of or reliance on such information.

EURJPY still to expect bearish for new week
OANDA:EURJPY strong bearish bounce from top line of price action, currently price in rectangle and on bottom line of price action.
EUR with all showing self the weakest in last periods and expectations are still to see weaknes, here expecting break of rectangle and trend line of PA and higher bearish continuation till res zone.
SUP zone: 163.300
RES zone: 160.600

Qml + BosAfter the market gave us an entryway we came late but this is where we can Always catch up with it..wait for fvg to give us direction as the buyers are now taking control

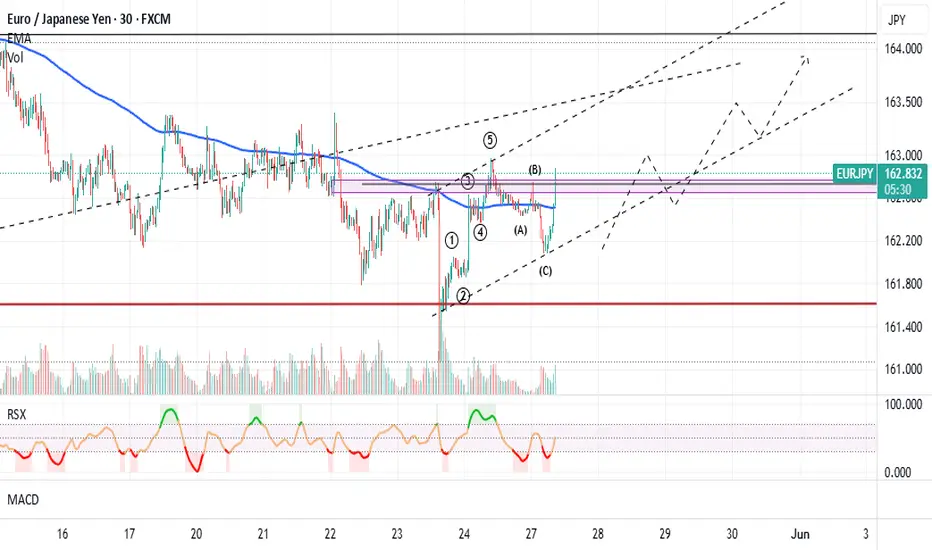
#EURJP Elliott wave analysisclear previous 5 wave bullish move followed by an abc corrective move which now could lead to a wave 3 or c.
EURJPY Wave Analysis – 26 May 2025
- EURJPY reversed from key support level 161.40
- Likely to rise to resistance level 165.00
EURJPY currency pair recently reversed up from the key support level 161.40 (which has been reversing the price from the middle of April), coinciding with the lower daily Bollinger Band
The upward reversal from the support level 161.40 created the daily Japanese candlesticks reversal pattern Long Legged Doji.
EURJPY currency pair can be expected to rise to the next resistance level 165.00, which has been reversing the price from last November.

EUR/JPY: Bulls Warming Up for the Next Leg !!Hey Traders
Price is holding above key structure and showing signs of bullish continuation. If momentum sustains, buyers could push price toward higher targets.
🎯 Target: 164.140
📌 (Not financial advice)
#EURJPY #ForexSetup #BullishBias #SmartMoney #PriceAction #FXTrading #TechnicalAnalysis #EuroYen

Bearish reversal?EUR/JPY is rising towards the resistance level which is an overlap resistance that lines up with the 50% Fibonacci retracement and could drop from this level to our take profit.
Entry: 163.18
Why we like it:
There is an overlap resistance level that lines up with the 50% Fibonacci retracement.
Stop loss: 163.18
Why we like it:
There is a pullback resistance level that is slightly above the 61.8% Fibonacci retracement.
Take profit: 161.61
Why we like it:
There is a pullback support level.
Enjoying your TradingView experience? Review us!
Please be advised that the information presented on TradingView is provided to Vantage (‘Vantage Global Limited’, ‘we’) by a third-party provider (‘Everest Fortune Group’). Please be reminded that you are solely responsible for the trading decisions on your account. There is a very high degree of risk involved in trading. Any information and/or content is intended entirely for research, educational and informational purposes only and does not constitute investment or consultation advice or investment strategy. The information is not tailored to the investment needs of any specific person and therefore does not involve a consideration of any of the investment objectives, financial situation or needs of any viewer that may receive it. Kindly also note that past performance is not a reliable indicator of future results. Actual results may differ materially from those anticipated in forward-looking or past performance statements. We assume no liability as to the accuracy or completeness of any of the information and/or content provided herein and the Company cannot be held responsible for any omission, mistake nor for any loss or damage including without limitation to any loss of profit which may arise from reliance on any information supplied by Everest Fortune Group.


EUR JPY TECHHello dear traders :) It's time to share my new tech!
As we see here we have many reasons to think its ok position to open Long EURJPY
We got a strong uptrend here. We have 16 days LONG strong up channel in this pair. also a nice support point inside.
Our trades price target is near +60 pips (Take Profit).
If you have any Questions? Ask me!
FxCROWN :)
Thank you

EURJPYcomplete buy on the open of the market based on economic data report we will be watching till newyork session

26.05.2025 - 30.05.2025 - EURJPY LONG POSITIONEURJPY - 26.05.2025 - 30.05.2025 Looking for LONG position on EURJPY
