EUR-JPY Risky Long! Buy!
Hello,Traders!
EUR-JPY is trading along the
Rising support line and the
Pair will soon retest the
Support from where we will
Be expecting a bullish rebound
And a local move up
Buy!
Comment and subscribe to help us grow!
Check out other forecasts below too!
Disclosure: I am part of Trade Nation's Influencer program and receive a monthly fee for using their TradingView charts in my analysis.
EURJPY trade ideas

EURJPY - Analysis and Potential Setups (Intraday- 16.05.2025)Brief Description:
A BoS as shown would give us additional confluence on this trade.
I will be taking an aggressive entry @ half risk and will add another position if we see price develop further and give us confirmation structures.

EURJPY Will Explode! BUY!
My dear friends,
EURJPY looks like it will make a good move, and here are the details:
The market is trading on 162.89 pivot level.
Bias - Bullish
Technical Indicators: Supper Trend generates a clear long signal while Pivot Point HL is currently determining the overall Bullish trend of the market.
Goal - 163.75
Recommended Stop Loss - 162.45
About Used Indicators:
Pivot points are a great way to identify areas of support and resistance, but they work best when combined with other kinds of technical analysis
Disclosure: I am part of Trade Nation's Influencer program and receive a monthly fee for using their TradingView charts in my analysis.
———————————
WISH YOU ALL LUCK

EUR/JPY forecast 🚨 **EUR/JPY Trade Setup**
📅 *Date:* April 24, 2025
💰 *Pair:* EUR/JPY
📊 *Timeframe:* M3/ M5
**Current Price:** 162.778
📍 **Sell Limit:** 162.917
🛑 **Stop Loss:** 162.969
🎯 **Setup Status:** Pending Execution
We’re waiting for **EUR/JPY** to pull back into the **162.917** supply zone to activate our **sell limit**. Stop loss is tight at 162.969, maintaining minimal risk on this setup.
📉 *Bias:* Bearish
If price taps the entry and rejects, we expect a downside move targeting lower intraday liquidity zones.
🔑 **Key Levels to Watch:**
* **Entry Zone:** 162.917
* **SL:** 162.969
* **Reaction Zone:** Watching lower timeframes for confirmation after entry

EUR/JPY BEARISH BIAS RIGHT NOW| SHORT
Hello, Friends!
We are going short on the EUR/JPY with the target of 163.215 level, because the pair is overbought and will soon hit the resistance line above. We deduced the overbought condition from the price being near to the upper BB band. However, we should use low risk here because the 1W TF is green and gives us a counter-signal.
Disclosure: I am part of Trade Nation's Influencer program and receive a monthly fee for using their TradingView charts in my analysis.
✅LIKE AND COMMENT MY IDEAS✅

EURJPY H1 Analysis – Wave 4 Retracement in Play🕐 Timeframe: 1H
📅 Updated: 17 May 2025
📌 Pair: EURJPY
⸻
🔍 Technical Outlook:
• Price is in a clear bearish trend, respecting lower highs and lower lows.
• Awesome Oscillator (AO) shows bearish convergence — momentum is weakening but still bearish overall.
• Price retraced to the 2.618–2.786 extension zone (162.902–162.982), a common wave 4 reaction level.
• This zone may act as a rejection area, setting up for the start of wave 5.
⸻
🔧 Elliott Wave Structure:
• ✅ Wave 1–3: Completed with strong bearish momentum.
• 🟡 Wave 4: Likely completed at 162.982 or may slightly extend, but momentum is fading.
• 🔴 Wave 5: Expected next move — continuation to the downside.
⸻
📍 Key Levels:
• 🔺 Wave 4 Resistance Zone: 162.902–162.982
• 🔻 Potential Wave 5 Target:
• 🎯 TP1: 162.000
• 🎯 TP2: 161.835 (Fib 4.236 extension)
• 🎯 TP3 (Extension): 161.50 or lower if selling accelerates
⸻
🧠 Strategy:
1. Monitor price action at 162.982 — if rejected, likely wave 4 completed.
2. Look for bearish engulfing / momentum candles for entry signal.
3. Short Setup Idea:
• Entry: Below 162.88–162.90 after confirmation
• SL: Above wave 4 high (163.12 or tighter at 163.00)
• TP: 100+ pip potential — trailing to lock profit
⸻
✅ Summary:
• AO confirms bearish convergence → weak momentum
• Price hit Fib confluence zone → wave 4 likely done
• Wave 5 could give 100+ pips to the downside
• Wait for confirmation, then short the breakdown

EURJPY Expected Growth! BUY!
My dear subscribers,
EURJPY looks like it will make a good move, and here are the details:
The market is trading on 163.88 pivot level.
Bias - Bullish
Technical Indicators: Both Super Trend & Pivot HL indicate a highly probable Bullish continuation.
Target - 164.26
About Used Indicators:
The average true range (ATR) plays an important role in 'Supertrend' as the indicator uses ATR to calculate its value. The ATR indicator signals the degree of price volatility.
Disclosure: I am part of Trade Nation's Influencer program and receive a monthly fee for using their TradingView charts in my analysis.
———————————
WISH YOU ALL LUCK

EUR/JPY Bearish Pin Bar After Failed Run at 165.00If looking for Yen-strength, EUR/JPY makes for a compelling argument especially against USD/JPY and GBP/JPY.
the pair is spending its ninth consecutive week showing resistance at the 163.00-163.38 zone and this week, bulls had an open door to run a breakout until they got caught at the 165.00 handle. That led to a strong pullback and as you can see from the weekly bar below, there's currently a pin bar that can also be argued as a shooting star formation. The weekly close will be key here as the Monday breakout was reversed later in the week, and seeing whether bears have the motivation to continue pushing will be telling as to whether JPY-strength has more potential for next week.
Longer-term, there's still a descending triangle in here with support down around the 155.00 handle. The 160 level would need to be dealt with first as that was a big spot of support in March/April, but it does provide some additional context in the event that a larger case of JPY-strength appears. - js

EUR/JPY Long Setup – Bullish Reversal from Key Support Zone Entry Point: 162.227
Stop Loss: 161.629
Take Profit (Target): 166.778
Current Price: ~162.798
Risk/Reward Ratio:
Risk: ~60 pips
Reward: ~455 pips
Risk/Reward ≈ 1:7.6 (strong setup)
🔍 Technical Insights
Support Zone:
The purple rectangle around 162.227 to 162.000 is identified as a key demand zone or support area.
Price has tested this zone previously and appears to be bouncing off it.
Price Structure:
The pattern suggests a potential double-bottom or reversal structure forming.
A rounded recovery projection is drawn, implying bullish momentum is expected.
Moving Averages:
A red (shorter period) moving average is crossing below the price.
A blue (longer period) moving average near the support zone could act as dynamic support.
Target Area:
166.778 marks a clear resistance or prior high and is labeled as the “EA Target Point”.
This is a logical profit-taking zone based on past price action.
✅ Bullish Trade Bias Justification
Strong support reaction near entry.
Favorable risk/reward ratio.
Reversal pattern potential.
Confluence with moving average support.
⚠️ Considerations
Ensure confirmation from a bullish candle or reversal signal before entry.
Be mindful of macroeconomic events or EUR/JPY fundamentals that might impact volatility.

EURJPY Will Fall! Short!
Here is our detailed technical review for EURJPY.
Time Frame: 6h
Current Trend: Bearish
Sentiment: Overbought (based on 7-period RSI)
Forecast: Bearish
The market is approaching a significant resistance area 164.491.
Due to the fact that we see a positive bearish reaction from the underlined area, I strongly believe that sellers will manage to push the price all the way down to 163.510 level.
P.S
The term oversold refers to a condition where an asset has traded lower in price and has the potential for a price bounce.
Overbought refers to market scenarios where the instrument is traded considerably higher than its fair value. Overvaluation is caused by market sentiments when there is positive news.
Disclosure: I am part of Trade Nation's Influencer program and receive a monthly fee for using their TradingView charts in my analysis.
Like and subscribe and comment my ideas if you enjoy them!

EURJPY - Breakdown Confirmation Toward Bearish ContinuationEURJPY has broken below the ascending trendline and is now trading under the key structure at **164.331**. The price appears to be forming a lower high before potentially continuing its downward move. As long as price stays below the **165.545** invalidation level, the bearish bias remains intact, with a projected target around **160.000**.
**Key Levels:**
- **Resistance (Invalid Level):** 165.545
- **Structure Break:** 164.331
- **Bearish Target:** ~160.000
**Outlook:**
Bearish continuation likely as long as price remains under resistance.
**Disclaimer:**
This is not financial advice. Trade at your own risk and always use proper risk management.

JPYEUR Long Flag pattern
Buy after successfully breakout this resistant line with a short -term target of at least 10%+ from here.


EUR/JPY
🔹Symbol: EUR/JPY
🔹Price: 164.717
🔹Stop loss: 165.612
🔹Take profit 1: 164.200
🔹Take profit 2: 163.301
🔹Take profit 3: 162.562
🔹Take profit 4: 161.886
🔹Take profit 5: 161.322
Low risk: % 1.🟢
📊Check your chart before entering.
♦️Check before use to make sure there is no important news.

EURJPY Wave Analysis – 14 May 2025
- EURJPY reversed from resistance area
- Likely to fall to support level 162.00
EURJPY currency pair recently reversed down from the resistance area between the pivotal resistance level 165.00 (which has been reversing the price from November), upper daily Bollinger Band and the 50% Fibonacci correction of the downward impulse from July.
The downward reversal from this resistance area stopped the c-wave of the previous short-term ABC correction 2 from February.
Given the strength of the resistance level 165.00, overbought daily Stochastic and clear daily downtrend, EURJPY currency pair can be expected to fall to the next support level 162.00.

SHORT ON EUR/JPYOANDA:EURJPY has created a double top with bearish divergence at a major supply zone.
I will be selling EJ to the next level of support/demand for over 200 pips.

Still Thinking Bullish!Enjoying a Motive wave 3 and An Inverse Head&Shoulder Pattern strongly Suggest a HUGE bullish wave for EURJPY!
ENTRY: BUY Stop :164.200
SL: 163.320
TP1: 166.120
TP2: 166.74
TP3: 167

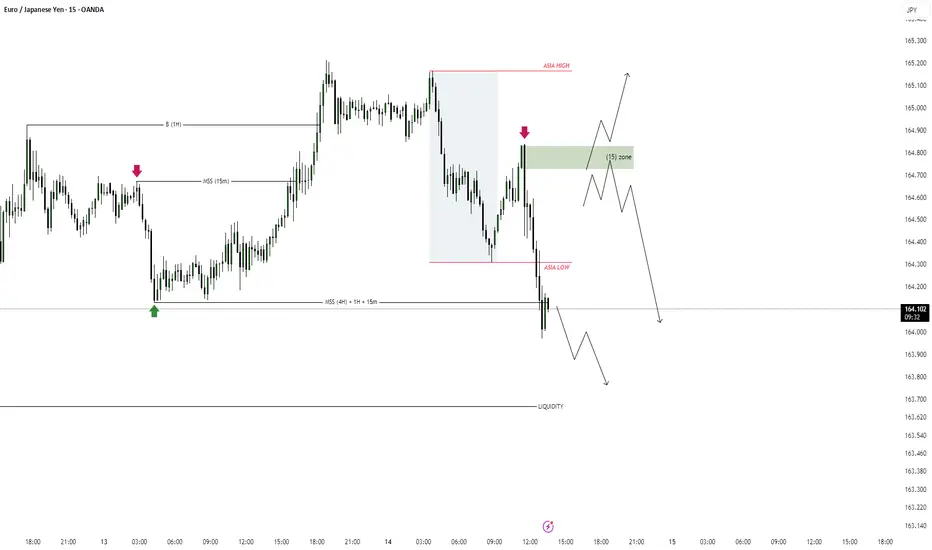
EURJPY Daily analysis OANDA:EURJPY 1H : Bearish MSS + OB + IMB 15m : Bearish MSS + BOS + IMB
The hourly chart is currently very strongly bearish and I think the price should retest and continue the trend
15: Like the hourly chart
EURJPYthree touch channel at the top of the structure .
ascending within an ascending.
waiting for the last touch to take a short position on EURJPY

EUR/JPY For Bearish as pull-backyou can go short now
general trend is up trend
current phase is pull-back
have fun :)

EURJPY 1H – Structure Broken!
⚠️ Bearish Divergence (Wave 3 vs 5) confirmed on AO
📉 Price broke key SNR at 164.671
Structure is gone — now waiting for a clean retest & rejection
🔻 Bearish bias below 164.671
Next target: 164.200 / 163.800
#EURJPY #Divergence #StructureBreak #ForexSetup

Engulfed at the Bottom… Now Watch the Bulls Bite Back Price just bounced off channel support with a clean 1H engulfing candle—classic bullish confirmation. If momentum holds, I’m looking for buyers to drive price toward 165.20–165.40 near the channel top. 📈
Let’s see if the bulls keep control.
