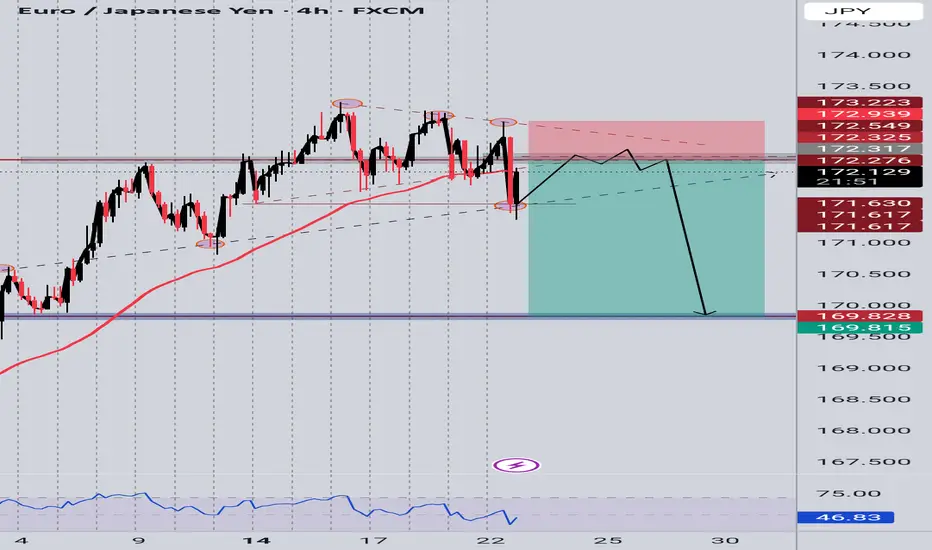
EURJPY 4H chartIf price fails to reclaim above 172.5 and prints a bearish confirmation candle on the retest, it's a high-probability short opportunity targeting the 170.000–169.800 support zone — as you've marked.
EURJPY trade ideas
EURJPY at Risk of Breakdown Below Key Support📈 EURJPY Approaches Key Technical Breakout Point
EURJPY is caught between a critical 4H support and weekly resistance, with momentum beginning to compress. The next move hinges on whether price holds the rising trendline or breaks beneath it. This update outlines the active structure, key levels, and macro narrative around JPY weakness.
🔍 Technical Analysis:
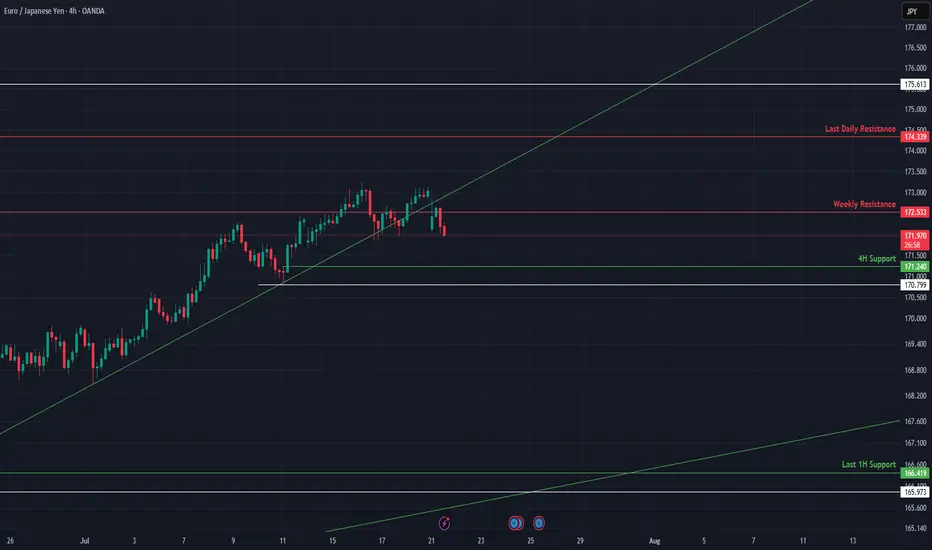
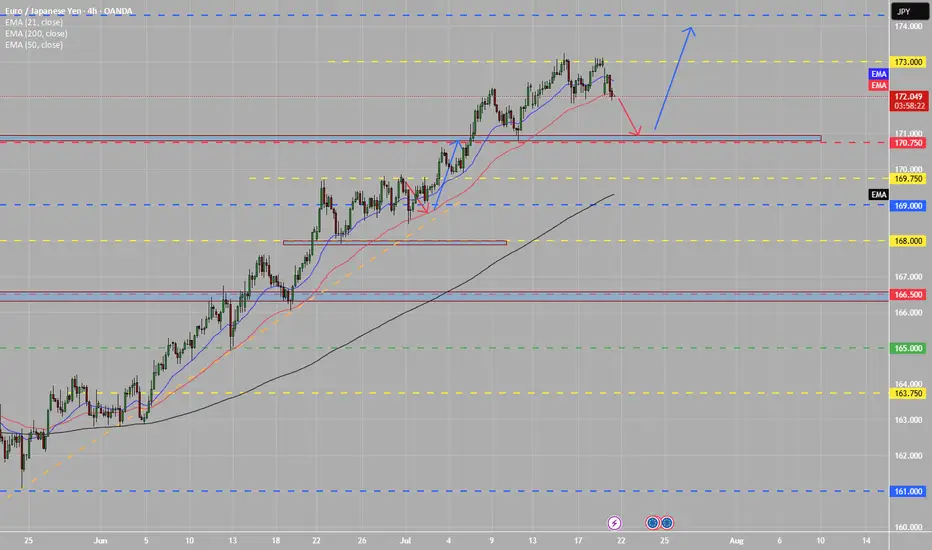
EURJPY recently rejected from weekly resistance at 172.53 and is now sitting on the 4H support at 171.24, right above an ascending trendline. The structure remains bullish while this trendline holds, but a breakdown below 170.77 would flip the bias.
On the upside, reclaiming 172.53 opens the path toward 174.33 (Last Daily Resistance). If support gives way, expect a drop toward 166.80 or lower.
🛡️ Support Zones (if pullback continues):
🟢 171.24 – 4H Support (High Risk)
Immediate support. Good for tight risk scalps.
Stop-loss: Below 170.77
🟡 166.89 – 165.27 – 1H Last Support (Medium Risk)
Strong historical base + diagonal confluence. Favorable for intraday or swing entries.
Stop-loss: Below 165.00
🔼 Resistance Levels:
🔴 172.53 – Weekly Resistance
Key rejection point. Break above this confirms upside continuation.
🔴 174.33 – Last Daily Resistance
Major supply zone. Bullish breakout target.
🧭 Outlook:
Bullish Case:
Hold above 171.24 and break 172.53 = upside continuation toward 174.33.
Bearish Case:
Break below 170.77 and failure to reclaim = possible slide toward 166.80 and below.
Bias:
Neutral–bullish while price holds above trendline. Flip bearish on close below 170.77.
🌍 Fundamental Insight:
JPY remains weak due to BoJ’s ultra-loose stance. However, intervention risk remains elevated if yen depreciation becomes disorderly. Euro remains supported by ECB’s hawkish tone and improving economic data. Watch for BOJ rhetoric and global yield shifts.
✅ Conclusion:
EURJPY is resting at a structural pivot between 4H support and weekly resistance. A breakout in either direction will likely determine the trend into August. Bulls must defend the trendline and 171.24 to stay in control.
Not financial advice. Like & follow for more high-probability setups across FX majors.

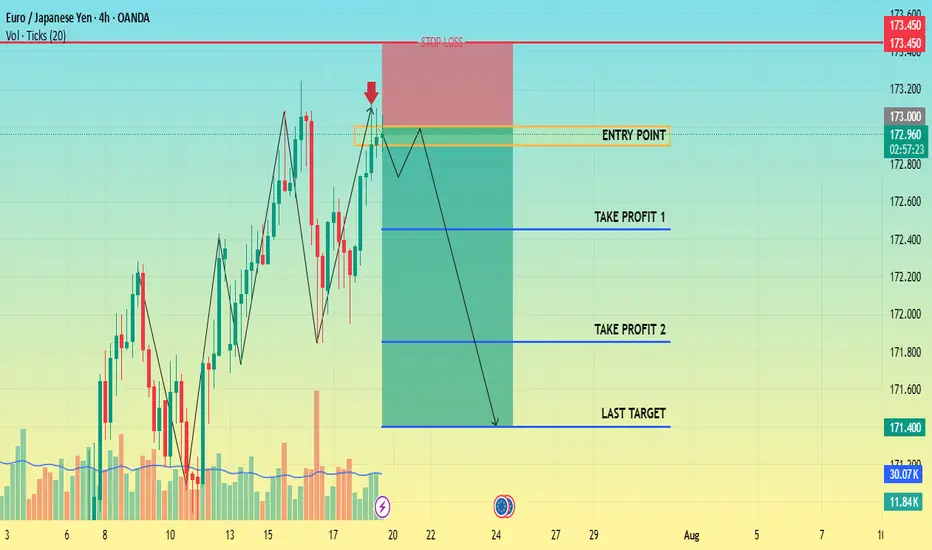
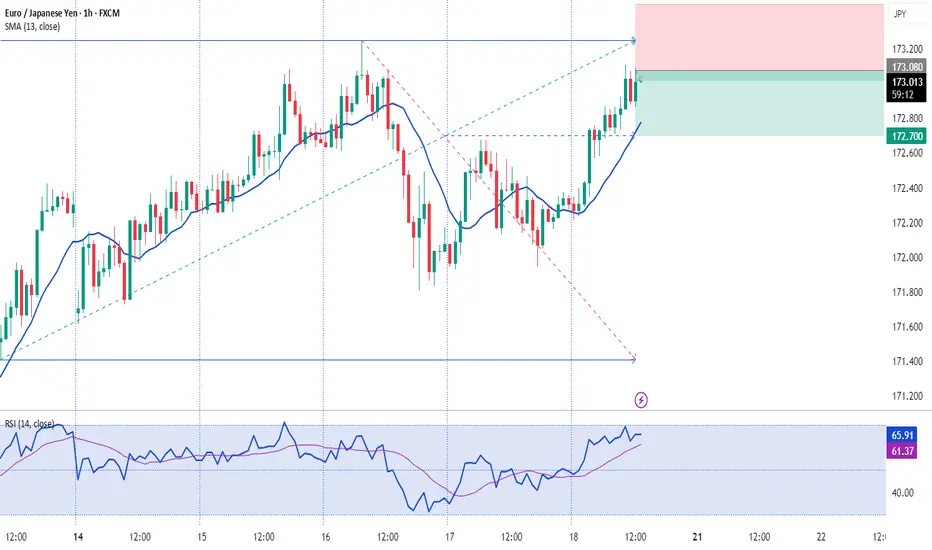
CHECK EURJPY SIGNAL UPDATE GO AND READ CAPTAINEntry Point: Around 173.350 TO 173.200
Take Profit 1: 172.600
Take Profit 2: 171.900
Last Target: 171.200
Stop Loss: 173.900

EUR/JPY BEST PLACE TO SELL FROM|SHORT
Hello, Friends!
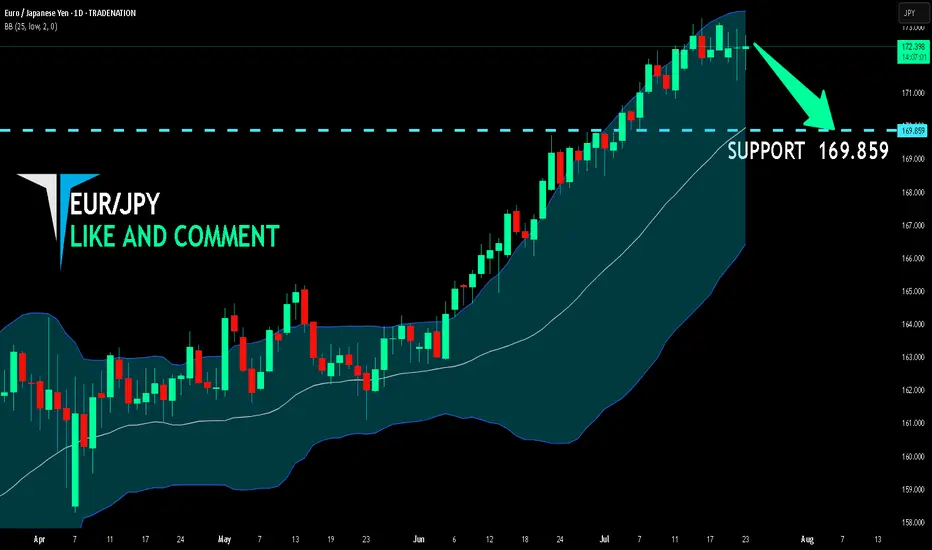
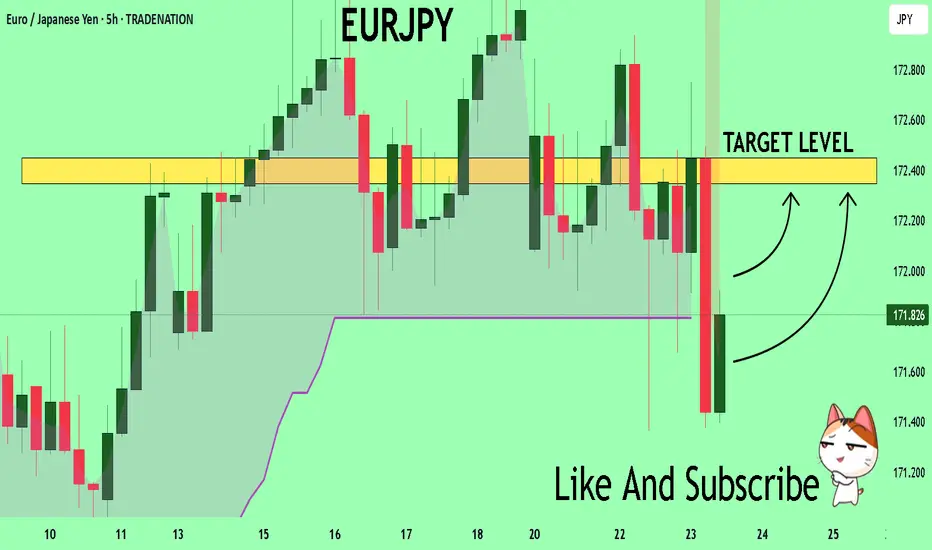
EUR-JPY uptrend evident from the last 1W green candle makes short trades more risky, but the current set-up targeting 169.859 area still presents a good opportunity for us to sell the pair because the resistance line is nearby and the BB upper band is close which indicates the overbought state of the EUR/JPY pair.
Disclosure: I am part of Trade Nation's Influencer program and receive a monthly fee for using their TradingView charts in my analysis.
✅LIKE AND COMMENT MY IDEAS✅
EURJPY in bullish trend EURJPY in bullish trend, potential reversal setup Entry with sell stop. RR 1:1

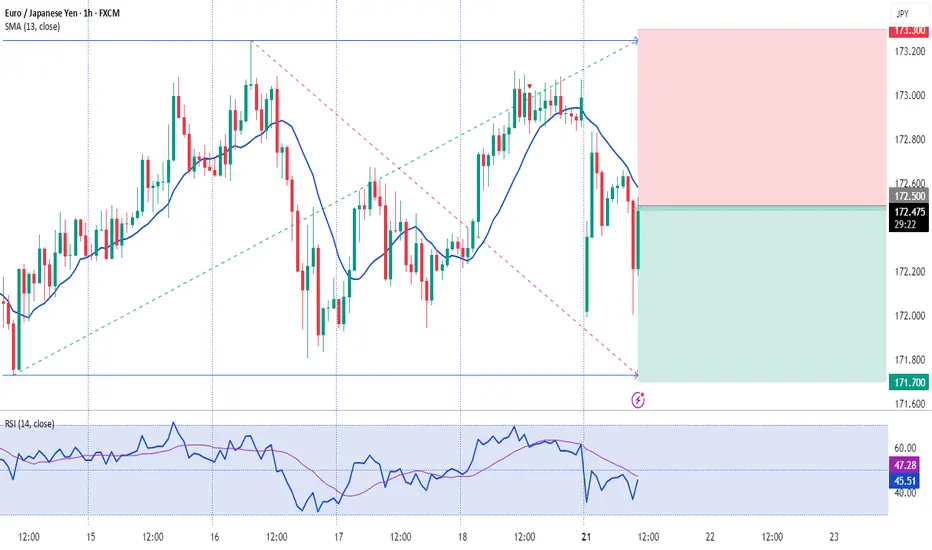
CHECK EURJPY SIGNAL READ CAPTAINShort (sell)
Entry Point: Around 173.000 172.900
Stop Loss: Around 173.450
🎯 Target Levels
Take Profit 1:
172.450
Take Profit 2:
171.850
Last Target:
171.400
short eurjpysell eurjpy targetting 100% fib level as tp1. even though it is a weekly analysis, i dont intend to stay in it for more than a week

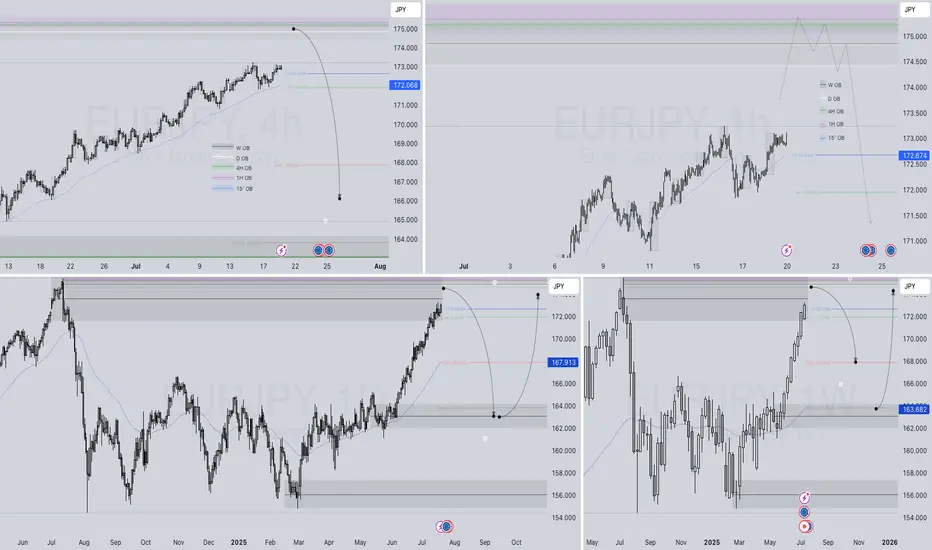
EURJPY Q3 | D25 | W30 | Y25📊 EURJPY Q3 | D25 | W30 | Y25
Daily Forecast🔍📅
Here’s a short diagnosis of the current chart setup 🧠📈
Higher time frame order blocks have been identified — these are our patient points of interest 🎯🧭.
It’s crucial to wait for a confirmed break of structure 🧱✅ before forming a directional bias.
This keeps us disciplined and aligned with what price action is truly telling us.
📈 Risk Management Protocols
🔑 Core principles:
Max 1% risk per trade
Only execute at pre-identified levels
Use alerts, not emotion
Stick to your RR plan — minimum 1:2
🧠 You’re not paid for how many trades you take, you’re paid for how well you manage risk.
🧠 Weekly FRGNT Insight
"Trade what the market gives, not what your ego wants."
Stay mechanical. Stay focused. Let the probabilities work.
FRGNT
OANDA:EURJPY

EJ BULLISH SETUP Looking for a nice retest at the daily support zone, if this holds true price will start to look for monthly resistance marked in blue.
EURJPY Hits Major Weekly Supply | Is the Bull Run Over?EUR/JPY – Institutional Macro Context (COT)
EUR (Euro)
Non-commercials net longs increased by +16,146 → strong buying.
Commercials added +25,799 long positions.
✅ Bias: Moderately bullish.
JPY (Japanese Yen)
Non-commercials decreased longs by -4,432.
Commercials cut -20,405 long contracts.
❌ Bias: Bearish pressure remains on JPY.
Conclusion (COT): EUR remains fundamentally strong, JPY structurally weak. Institutional flows favor long EUR/JPY, but positioning is stretched.
Seasonality (July)
EURJPY shows strong bullish seasonality in July, especially over the 2Y and 5Y averages (+1.03% and +0.66% respectively).
✅ Seasonality bias: Bullish.
Retail Sentiment
89% of traders are short on EUR/JPY.
Contrarian bias = bullish confirmation.
Technical Analysis (Weekly View)
Price is pushing into a major weekly supply zone around 172.50–173.00.
RSI still elevated but showing signs of weakening momentum.
Potential double top structure forming in confluence with liquidity grab.
First downside target sits around 169.50 (daily demand zone).
Awaiting a reaction in supply and confirmation for short.
Trading Plan (Top-Down)
Wait for price to reject the 172.50–173.00 area
Watch for bearish confirmation on Daily (engulfing or lower high)
Target: 169.50 zone
Risk: tight above 173.20 (invalidating supply zone)

EURJPY Will Explode! BUY!
My dear subscribers,
My technical analysis for EURJPY is below:
The price is coiling around a solid key level - 171.82
Bias - Bullish
Technical Indicators: Pivot Points Low anticipates a potential price reversal.
Super trend shows a clear buy, giving a perfect indicators' convergence.
Goal - 172.34
About Used Indicators:
By the very nature of the supertrend indicator, it offers firm support and resistance levels for traders to enter and exit trades. Additionally, it also provides signals for setting stop losses
Disclosure: I am part of Trade Nation's Influencer program and receive a monthly fee for using their TradingView charts in my analysis.
———————————
WISH YOU ALL LUCK
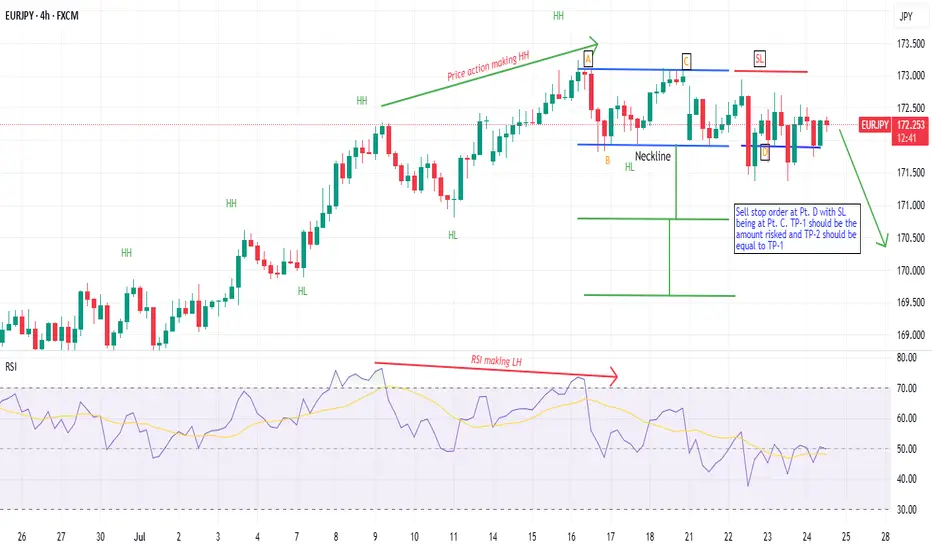
EURJPY - Short Idea - 24th July 2025- Stopped making news HHs
- Suspected Double Top pattern found
- Likely to go bearish
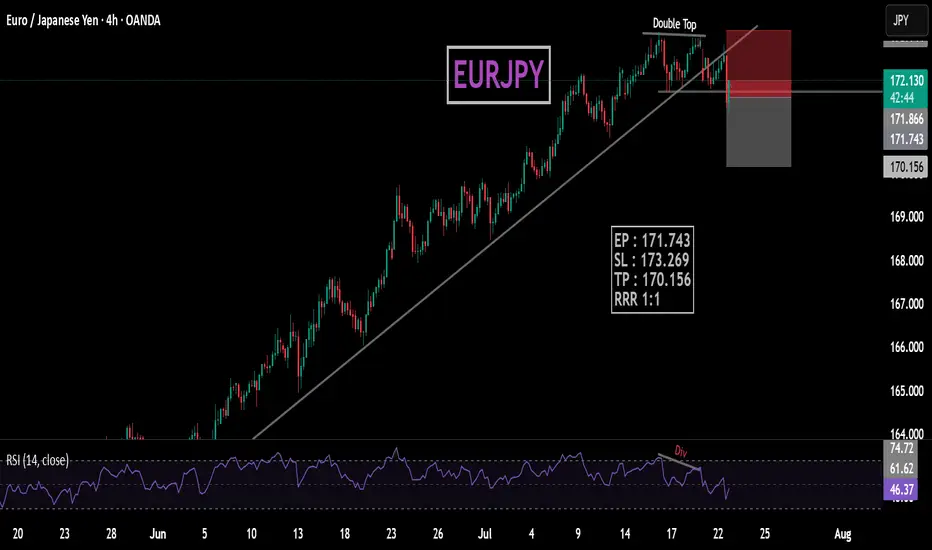
EURJPYDouble top with rsi bearish Divergence also bulish trendline beark.
EP : 171.743
SL : 173.269
TP : 170.156
RRR 1:1
EURJPY in Uptrend ContinuationBuy Limit
Entry Price 172.536
Stop Loss 171.730
Risk 1%
Lot Size 0.46
TP (1RR) 173.342
TP (3RR) 174.954

Selling eurjpyStrong sell coming in next weeks
Already 8 consecutive weekly buy candels
Now strong bearish correction expected
Weekly too overbought pair
Strong selling area reached

EURJPY – WEEKLY FORECAST Q3 | W30 | Y25📊 EURJPY – WEEKLY FORECAST
Q3 | W30 | Y25
Weekly Forecast 🔍📅
Here’s a short diagnosis of the current chart setup 🧠📈
Higher time frame order blocks have been identified — these are our patient points of interest 🎯🧭.
It’s crucial to wait for a confirmed break of structure 🧱✅ before forming a directional bias.
This keeps us disciplined and aligned with what price action is truly telling us.
📈 Risk Management Protocols
🔑 Core principles:
Max 1% risk per trade
Only execute at pre-identified levels
Use alerts, not emotion
Stick to your RR plan — minimum 1:2
🧠 You’re not paid for how many trades you take, you’re paid for how well you manage risk.
🧠 Weekly FRGNT Insight
"Trade what the market gives, not what your ego wants."
Stay mechanical. Stay focused. Let the probabilities work.
FRGNT FOREX ANALYSIS 📊
CHECK EURJPY SIGNAL READ THE CAPTAINEntry Point: Around 173.000 172.900
Stop Loss: Around 173.450
🎯 Target Levels
Take Profit 1:
172.450
Take Profit 2:
171.850
last target
171.350

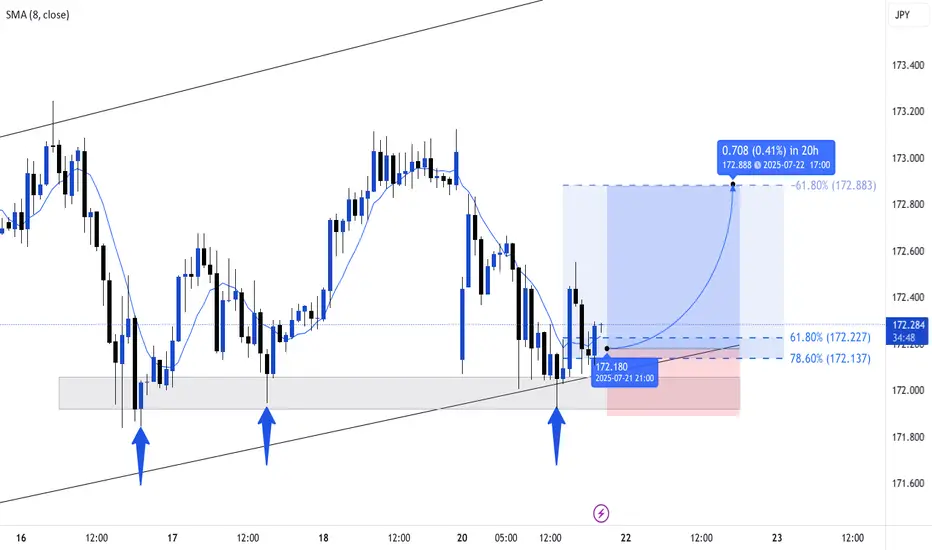
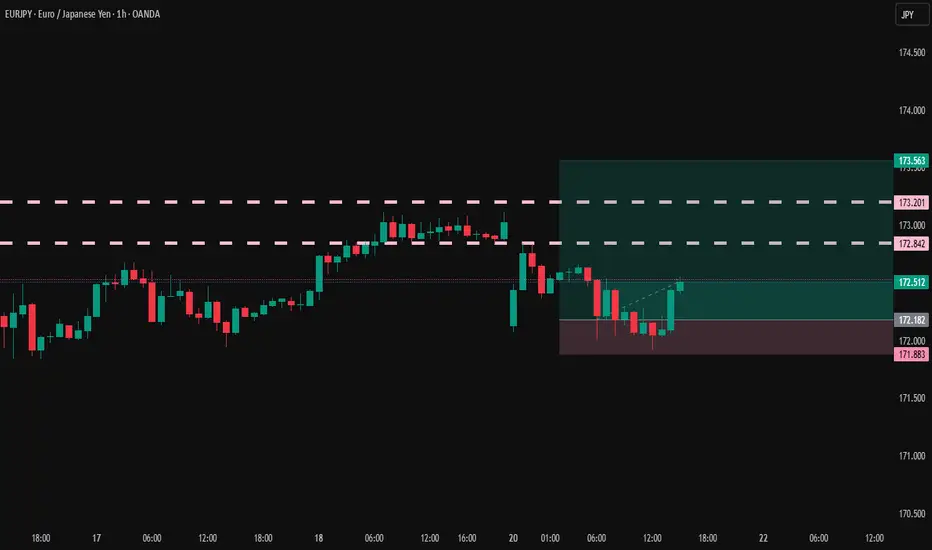
"Three Drives" And EURJPY Bulls Could Be Out!!OANDA:EURJPY has potentially been forming quite a rare Reversal Pattern, the Three Drives Pattern, after making a Bullish Breakout of the Triangle, lets break it down!
Three Drive Patterns are very similar to ABCD patterns except for one thing, a Retracement instead of a Reversal after the CD Leg is finished!
In the CD Leg, Price creates quite a Trading Volume Gap between 172.1 - 171.8 and after Price declines from Point D (normally a Short Opportunity on an ABCD Pattern), Price actually makes a 61.8% Retracement of CD, creating Point E in that very Price Range and moves up, which "drives" a strong case that we potentially could be looking at a Three Drive Pattern!
Now that we have Point E, we can use the Fibonacci Retracement Tool to help give us an idea on where the Extension of the EF Leg could potentially end and the Fibonacci Levels suspected are:
123.6% --> 173.585
138.2% --> 173.795
161.8% --> 174.134
Once Price has made an Extension, shows Reaction, and moves Down from these levels; this could generate a great Short Opportunity!
