EUR/JPY BEARS ARE STRONG HERE|SHORT
Hello, Friends!
We are going short on the EUR/JPY with the target of 159.106 level, because the pair is overbought and will soon hit the resistance line above. We deduced the overbought condition from the price being near to the upper BB band. However, we should use low risk here because the 1W TF is green and gives us a counter-signal.
Disclosure: I am part of Trade Nation's Influencer program and receive a monthly fee for using their TradingView charts in my analysis.
✅LIKE AND COMMENT MY IDEAS✅
EURJPY trade ideas

possible sell tradenice sell setup,ive set my alerts,if i see my patterns form at my poi il be entering sells

EURJPY Long 4/29/2025EUR/JPY Long – Weekly Bullish Engulfing + Double Bottom Off Demand Zone
Looking to go long EUR/JPY after a clean correction into demand and signs of higher timeframe bullish continuation.
Weekly Chart:
Last week printed a bullish engulfing candle that slightly broke out of the previous supply zone, suggesting early-stage trend continuation.
While we opened this week with a sharp sell-off (around 170 pips from the highs), price action shows it was corrective, not impulsive.
4H Chart:
Price is setting up a Morning Star formation — two hours away from confirmation.
If completed, it would signal a bullish reversal right off a critical structure zone.
1H Chart:
A double bottom is forming off a predetermined 1H demand zone — a key liquidity pocket I’ve been tracking.
Recent hourly candle gapped up, further suggesting buyers are starting to step in after soaking up sell-side pressure.
Trade Thesis:
Expecting a bullish reaction from demand and a retest of the previous highs.
This correction appears technical rather than fundamental — no steamy downside momentum despite the initial slide.
Risk-Reward Profile:
Target: Retest of the highs
R:R: 1:3.5
Stop: Below the double bottom structure
This setup blends clean structure with a higher timeframe bullish bias — looking for a continuation leg if momentum holds.

EURJPY Wave Analysis – 28 April 2025
- EURJPY reversed from resistance area
- Likely to fall to support level 161.25
EURJPY currency pair recently reversed down from the resistance area between the resistance level 164.00 (which has been reversing the price from January), upper daily Bollinger Band and the 50% Fibonacci correction of the downward impulse from July.
The downward reversal from this resistance area stopped the previous short-term correction ii.
Given the clear daily downtrend and the overbought daily Stochastic, EURJPY currency can be expected to fall toward the next support level 161.25.

TRADING RECAPKey Lessons On The Trade I Took And The Management As Well I Have Added Some Forecasting Video In This Recap On What I Am Watching For Tonight And Tomorrow Do Let Me Know How Do You Find This Video.

EURJPY BUY SETTUPI tried breaking this PEPPERSTONE:EURJPY analysis from dailytf till weeklytf and h4, pls take your time out to view the content of this post and see if this analysis is something that you may need. Thank You.

EUR/JPY Key Res TestEUR/JPY has been digesting for the better part of the past nine months. While both Euro and USD strength have been on full display in varying ways over that period of time, each currency has been a bit more balanced against the Japanese Yen.
The range has been wide at more than 800 pips but there's also a descending triangle that's set up along the way, with lower-highs around the 163.38 Fibonacci level and horizontal support around the 155.00 handle.
For those looking for Yen-strength, this may be a more attractive venue than USD/JPY at the moment, with USD/JPY holding below the key 145.00 psychological level. - js

EURJPY 4H Chart: Breakout or Reversal? My Full Plan Inside!
📈 EURJPY 4H Chart - My Trading Plan
In the EURJPY 4-hour chart, I observe that the trend is moving higher, clearly visible when connecting the recent highs and lows with a manual zigzag line.
A critical zone is forming around the Double Top near 164.00 , which also acts as a strong supply area.
This is the major challenge ahead: for the bullish trend to continue, price must break and hold above this 164.00 resistance.
However, based on the current momentum, I believe the bulls have enough strength to push beyond this level.
🛡️ Role of Support Line
I have drawn the support line to highlight a potential reversal zone.
If the price fails to break and sustain above 164.00 and instead drops below the support area, it will signal that the double top resistance has held strong, and a deeper pullback could follow.
📊 RSI - Crucial Momentum Signal
The RSI remains above the 50 line and has not dipped below the 30 oversold level since it last touched the 70 overbought zone on March 5th.
This ongoing bullish momentum in RSI supports the idea of a continued uptrend.
🔢 Fibonacci Levels - Target Zones
I have drawn the Fibonacci extension from the recent swing low to high.
If the bullish continuation unfolds, my next key upside targets are:
- 165.350 (1.618 Fib) — Expect 1
- 166.368 (2.0 Fib) — Expect 2
🧠 Plan B - What If I'm Wrong?
If the price fails to break 164.00 convincingly and then breaks below the support line , I will prepare for a reversal trade.
In that case, I plan to double or even increase my lot size to recover any prior losses.
Although this is a higher-risk approach, I have confidence in my strategy.
Let’s trade with discipline and manage risks properly. Let's begin! 🚀

EURJPY | Continues bullish trendEURJPY is continuing its bullish trend after defining its new higher low.It is moving upwards with almost a bullish engulfing candle stick pattern which is quite a strong indication that it is going to move in uptrend.

EURJPY will continue rally upwardBased on technical analysis
1. Trendline broken
2. Rally-base-rally was formed.
I'm expecting the re-test of the base before it continue upward again.
i'm monitoring any reversal pattern in lower time frame.
Good luck and manage your own risk & reward.

Update On EURJPY pushing to 167. LevelFinally Price started moving. still holding for the past 2 weeks, the market has been slow hopefully we get more volatility in the next couple weeks and see this trade play out successfully. Im still holding i still believe in the set up i posted about EJ and for right now everything is looking great.
EURJPY ANALYSISIn this video we see a break down of the pair coming into a new week after seeing last week close as a bullish engulfing and the structure on the 4hr showing HH and HL which is a confirmation of bullishness.

EURJPY TRADE SETUPWait for retest the entry level and bullish momentum candle then take a trade for Buy otherwise skip this setup

Bullish Week For EUR/JPYPrice aggressively traded above the short term high of 163.265 and created a Fair Value Gap. Price traded into the Fair Value Gap making it possible for a Bullish Continuation to the high of 164.161 created on 2 April 2025.

EUR JPY #0012 Short Swing Trade-The trade heavily relies on the liquidity pools surrounding the structures as labeled.
- The main driver of the sell limit order placement is the presence of CHoCH within the cycle.
- Trade is SWING in Nature, holding period may be between 2-4 days.
- The rest, the image is pretty must self-explanatory.

EURJPY Massive Long! BUY!
My dear friends,
EURJPY looks like it will make a good move, and here are the details:
The market is trading on 161.30 pivot level.
Bias - Bullish
Technical Indicators: Supper Trend generates a clear long signal while Pivot Point HL is currently determining the overall Bullish trend of the market.
Goal - 161.68
About Used Indicators:
Pivot points are a great way to identify areas of support and resistance, but they work best when combined with other kinds of technical analysis
Disclosure: I am part of Trade Nation's Influencer program and receive a monthly fee for using their TradingView charts in my analysis.
———————————
WISH YOU ALL LUCK


EUR_JPY RESISTANCE AHEAD|SHORT|
✅EUR_JPY is going up now
But a strong resistance level is ahead at 164.870
Thus I am expecting a pullback
And a move down towards the target of 163.000
SHORT🔥
✅Like and subscribe to never miss a new idea!✅
Disclosure: I am part of Trade Nation's Influencer program and receive a monthly fee for using their TradingView charts in my analysis.

EURJPY Under Pressure! SELL!
My dear subscribers,
My technical analysis for EURJPY is below:
The price is coiling around a solid key level - 163.61
Bias - Bearish
Technical Indicators: Pivot Points Low anticipates a potential price reversal.
Super trend shows a clear sell, giving a perfect indicators' convergence.
Goal - 162.39
My Stop Loss - 164.06
About Used Indicators:
By the very nature of the supertrend indicator, it offers firm support and resistance levels for traders to enter and exit trades. Additionally, it also provides signals for setting stop losses
Disclosure: I am part of Trade Nation's Influencer program and receive a monthly fee for using their TradingView charts in my analysis.
———————————
WISH YOU ALL LUCK

EUR/JPY Technical Outlook: Demand Zone Bounce Sets Up RallyGood Morning Traders,
Trust you are good.
Below is my analysis of the EURJPY pair.
Overview
Price is currently at 161.243, showing signs of a bullish rebound following a sharp drop. A clear bullish structure is forming, characterized by higher lows and a breakout from a recent consolidation zone. The demand zone between 160.900 and 161.100 has held strong, acting as a reliable support level.
Idea
A recent bullish impulse broke above minor resistance, followed by a healthy retracement into the demand zone—shaping a potential bullish flag or continuation pattern. This retracement aligns with the 50% Fibonacci level, providing added confluence for a continuation to the upside.
The projected target is 164.174, a level likely to contain buy-side liquidity and act as a magnet for price in the short term.
Conclusion
Despite macro uncertainty due to ongoing trade tensions, recent news of a 90-day tariff pause from Trump has eased some pressure, allowing the EUR to show resilience. As a result, EUR/JPY may continue its bullish push toward the 164.174 target. However, a break below 160.245 would invalidate this outlook.
Cheers and happy trading!

EURJPY Short 4/25/2025EUR/JPY Short – 4th Rejection from Key Supply Zone + Bearish Engulfing Into Range
Looking for a short setup on EUR/JPY after a clean multi-timeframe rejection from the upper boundary of a well-respected zone.
Daily Chart:
Price has tested this trendline resistance zone four times this week — failing each time. Today’s rejection at 163.151 marks the 4th consecutive denial of higher ground. Structurally, this is shaping up as a textbook range trade.
4H Chart:
The latest 4-hour candle printed a sharp doji right at the supply zone — a strong indecision signal that often precedes reversal. Friday flows are light, so it’s likely a final tap before the weekend.
1H Chart:
Price respected the zone all London session. We now see several wick rejections, followed by a bearish engulfing candle on the most recent hourly close — confirming seller presence.
News Context:
No major upcoming data. Tokyo CPI dropped during Asia session and came in strong — that could lend strength to the yen and support downside momentum from here.
Target:
Looking for a move down to the bottom of the range near 161.142
Entry: Near 163.151
Stop: Above supply
Target: 1:3.69 R:R
Note: Could take time to play out — likely into next week if not into New York session follow-through.
This is a clean supply rejection play with a well-defined range and no macro news in the way.

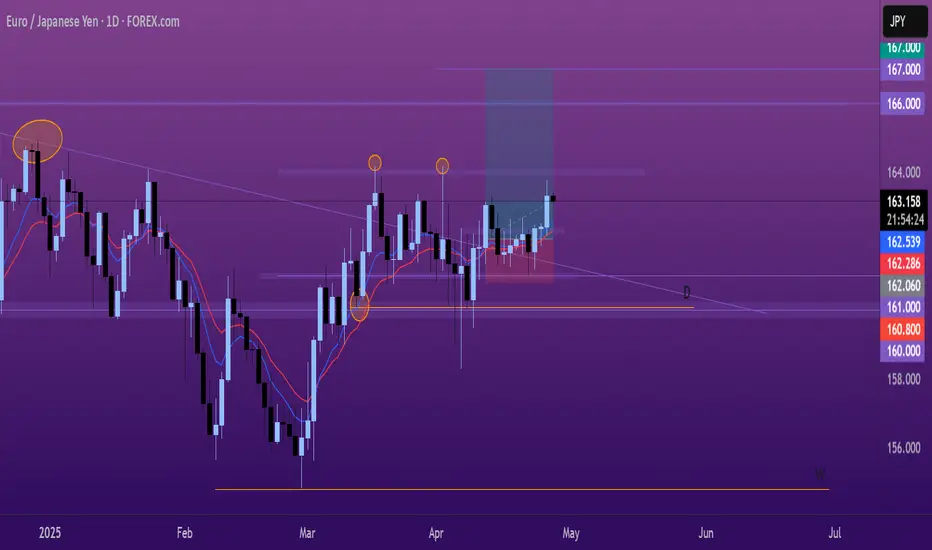
EurJpy- Ready to rise at 166?Since mid-March, EURJPY has been in a consolidation phase. Except for the early April spike down, the pair has respected a pretty clear range between the 161.00 support and the 163.30 resistance.
Now, however, EURJPY looks ready to break to the upside. A sustained price above 163.30 would confirm this breakout and open the door for bullish momentum.
🔍 My strategy:
I’m looking to buy dips, ideally around the 162.50 area.
If the price drops and breaks below 161, that would invalidate the setup.
On the upside, the first major target is the 166.00 resistance zone.
Disclosure: I am part of Trade Nation's Influencer program and receive a monthly fee for using their TradingView charts in my analyses and educational articles.

Mid Term Short on EURJPYIn the short term, I predict a bounce back to the trendline as we sweep some liquidity around this current location. If/When we break the 155 support, we will hit a minimum of 140 and even lower.
This is an idea. If you agree with the fundamentals of the chart you can follow my trade.
Short-term target with price reversal from 1.55
Target 1 - 159
Target 2 - 161.500 (I will look for a reversal and short from this location)
Price target with price breaking below 1.55 support zone
Short Term Target - 140
Mid Term Target - 135
