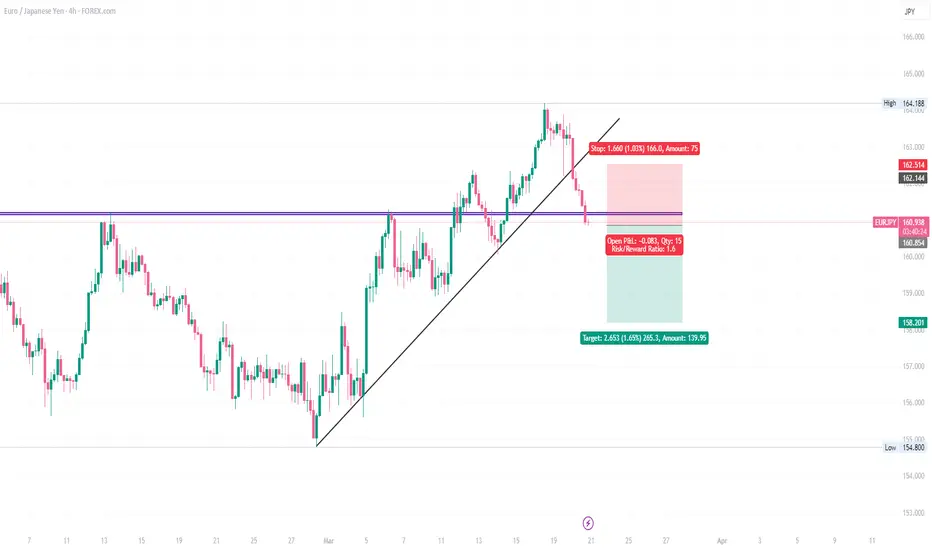
EUR/JPY Breakdown – Sell OpportunityEUR/JPY has broken the uptrend line and is now retesting a key resistance zone at 160.854. This could be a great sell opportunity, targeting 158.201, with a Risk/Reward Ratio of 1.6.
📉 Sell Setup:
Entry: 160.854
Stop Loss: 162.514
Take Profit: 158.201
This trade offers a good risk-to-reward ratio, but be cautious of economic news that may cause volatility. What’s your take on this setup? Let’s discuss!
EURJPY trade ideas
EUR_JPY GROWTH AHEAD|LONG|
✅EUR_JPY has retested a key support level of 160.600
And as the pair is already making a bullish rebound
A move up to retest the supply level above at 163.000 is likely
LONG🚀
✅Like and subscribe to never miss a new idea!✅
Disclosure: I am part of Trade Nation's Influencer program and receive a monthly fee for using their TradingView charts in my analysis.

EURJPY Approaching Key Resistance — Potential Sell SetupOANDA:EURJPY is approaching a key resistance level, an area that has been a key point of interest where sellers have regained control, leading to notable reversals in the past. Given this, there is potential for a bearish reaction if price action confirms rejection, such as a bearish engulfing candle, long upper wicks or increased selling volume.
If the resistance level holds, I anticipate a downward move toward 161.20, which represents a logical target based on previous price behavior and market structure.
However, if the price breaks above this zone and sustains above it, the bearish outlook may be invalidated, opening the door for further upside.
Just my take on support and resistance zones—not financial advice. Always confirm your setups and trade with solid risk management.
Best of luck!

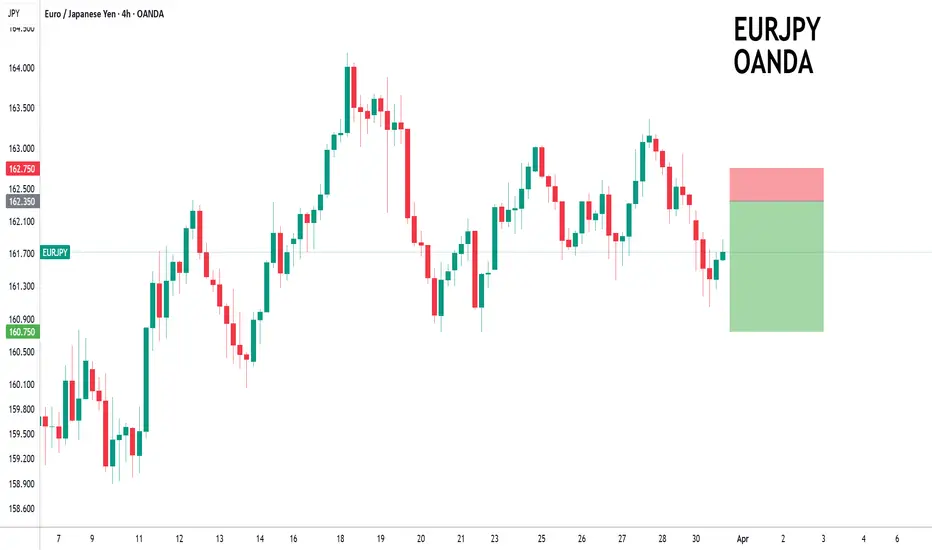
EURJPY remains mixed and volatile.EURJPY - 24h expiry
Although the bulls are in control, the stalling positive momentum indicates a turnaround is possible.
Price action looks to be forming a top.
Preferred trade is to sell into rallies.
A lower correction is expected.
Bespoke resistance is located at 162.35.
We look to Sell at 162.35 (stop at 162.75)
Our profit targets will be 160.75 and 160.50
Resistance: 162.00 / 162.70 / 163.20
Support: 160.75 / 160.20 / 159.00
Risk Disclaimer
The trade ideas beyond this page are for informational purposes only and do not constitute investment advice or a solicitation to trade. This information is provided by Signal Centre, a third-party unaffiliated with OANDA, and is intended for general circulation only. OANDA does not guarantee the accuracy of this information and assumes no responsibilities for the information provided by the third party. The information does not take into account the specific investment objectives, financial situation, or particular needs of any particular person. You should take into account your specific investment objectives, financial situation, and particular needs before making a commitment to trade, including seeking advice from an independent financial adviser regarding the suitability of the investment, under a separate engagement, as you deem fit.
You accept that you assume all risks in independently viewing the contents and selecting a chosen strategy.
Where the research is distributed in Singapore to a person who is not an Accredited Investor, Expert Investor or an Institutional Investor, Oanda Asia Pacific Pte Ltd (“OAP“) accepts legal responsibility for the contents of the report to such persons only to the extent required by law. Singapore customers should contact OAP at 6579 8289 for matters arising from, or in connection with, the information/research distributed.
Found a dependable range ~JPY is still strong.Its usual crosses specially EURJPY are going down although being corrected.In my opinion EURJPY is again at a correction now and It's going to continue descending later.

EUR/JPY BEST PLACE TO BUY FROM|LONG
Hello, Friends!
We are targeting the 162.927 level area with our long trade on EUR/JPY which is based on the fact that the pair is oversold on the BB band scale and is also approaching a support line below thus going us a good entry option.
Disclosure: I am part of Trade Nation's Influencer program and receive a monthly fee for using their TradingView charts in my analysis.
✅LIKE AND COMMENT MY IDEAS✅

4-hr EUR/JPY: Targeting a 230 pips dropSince early March, EUR/JPY has surged nearly 1,000 pips, providing us with several excellent trading opportunities. However, as the rally matures, many early buyers are beginning to take profits, leading to a noticeable slowdown in the uptrend. On Friday, the pair formed a Death Cross, a well-known bearish signal, prompting us to enter a direct sell trade at 161.30 in anticipation of a broader correction.
Our bearish outlook is reinforced by a double top pattern at 163.00, which represents a lower high compared to the previous swing high at 164.00. This formation suggests a weakening bullish momentum, increasing the likelihood of a trend reversal. If our analysis is correct, we aim to take profit near 159.00, aligning with the crucial 61.8% Fibonacci retracement level—often a strong support zone.
To mitigate potential losses while allowing sufficient market fluctuation, we are implementing a stop-loss with a 1.2% distance. This strategic risk management approach ensures our trade remains protected while maintaining the flexibility needed for price movement. As we monitor the market’s response to these technical signals, we anticipate a profitable opportunity in the coming sessions.

EURJPY BEARISHEJ looking really really saaaad. Let's see what it does for this week, it may be full of surprises. WHO KNOWS. Checking back on Tueday.
EUR JPY SHORT ...SWING TRADEUsing my adaptation of SMC and Price Action...I have analysed a highly probable move to the downside for EUR JPY ...as EUR JPY needs to break the weekly low to grab liquidity

EURJPY buy ideaEURJPY has been in a bullish trend and has at Friday, done a 15 ichoch at our orderblock. signaling our buy entry. although we are in a bit of drawdown but it is totally chill, the market just opened, so i still have my position opened,

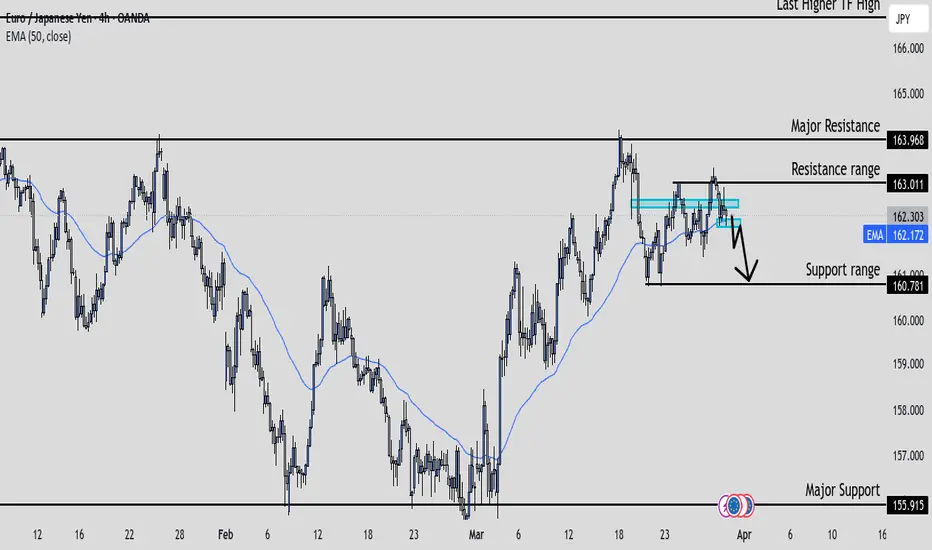
EurJpy Trade IdeaEJ is another pair that is currently in a higher time frame range between 163.968 and 155.915. We had a clean higher time frame shift in structure last week with price ending in a range. I'll personally be waiting on the pair to continue crashing to the downside before getting into any shorts.
EUR/JPY: The Calm Before the Yen Storm
The sharp drop in FOREXCOM:EURJPY OANDA:EURJPY FX:EURJPY CAPITALCOM:EURJPY from July to August 2024 appears to be a classic impulse wave A. Since then, the pair has entered a consolidation phase — most likely forming a triangle as part of a corrective wave B.
🔍 Key observations:
Volume is evenly distributed, with the POC sitting near the current price levels.
Volatility continues to compress, increasing the likelihood of a breakout once the triangle structure completes.
The 0.5–0.618 Fibonacci retracement zone of wave A (around 161.50–164.00) is the most probable area for wave B to top out.
📉 Once this consolidation is complete, the pair is expected to move into wave C, potentially targeting 147.00–154.00.
⚠️ This scenario remains the base case as long as the price action holds within the corrective structure. Watch for a rejection near the upper boundary — a short setup may be on the horizon.

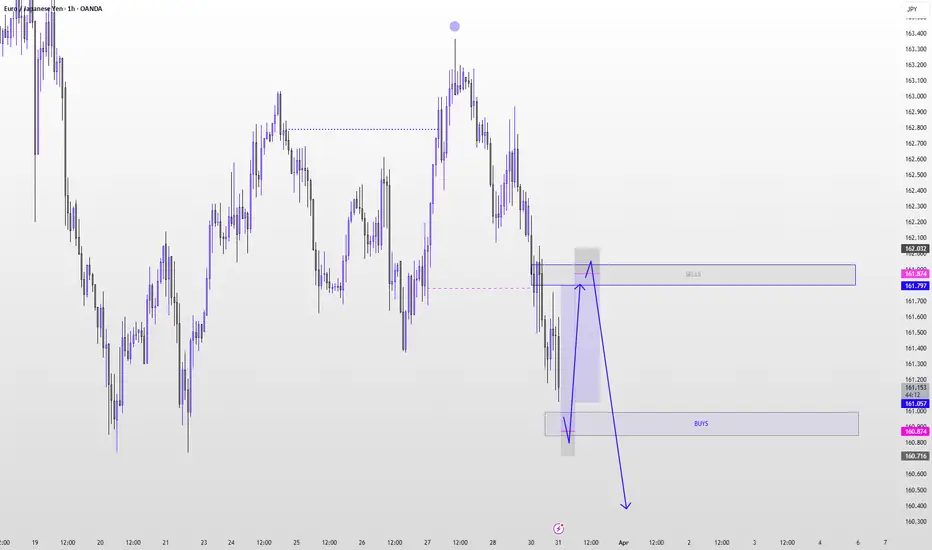
eurjpy biresh trendWe have a 4 -hour Trend fracture after the bounce from the Order Block Daily region, and on it we waited for a change in the structure from Frame 15 minutes and we entered the deal and the goal is the first liquidity.
In the next stage, we expect a change in the structure on Frame for 4 hours, and therefore we are waiting for a bounce and then entering into a beautiful sale deal

EURJPYPrice looks bearish this week after raiding liquidity. i believe next week is going to be bearish wek for the EURJPY. trade with caution and remember this is not financial advice.

Bullish ......... But!CAPITALCOM:EURJPY EUR/JPY stayed in sideway trading below 164.16 last week and outlook is unchanged. Initial bias remains neutral this week first. Further rise is in favor as long as 160.73 support holds. Above 164.16 will resume the rally from 154.77 to 164.89 resistance, and then 166.67. However, break of 160.73 will turn bias back to the downside for 158.87 support and below. Overall, sideway consolidation pattern from 154.40 is still extending.

Strong Confluence Zone – Is EURJPY Ready to Fly?EURJPY is currently respecting a strong ascending trendline that has acted as dynamic support for several years. Price recently rebounded from both the horizontal support zone and the rising trendline, indicating strong buying interest at this confluence area.
Now, the pair is attempting to break above a key resistance zone marked by a descending trendline. A successful breakout above this area could signal a potential continuation of the long-term bullish trend.
The RSI is also showing a bullish divergence, which adds confluence to the bullish bias. However, rejection from resistance could trigger a retest of the support zones.
Found this helpful? Like & follow us for more high-quality market insights.

EURJPY Weekly Forecast: Triple Bottom Breakout & Bullish Target Overview of the Chart & Market Structure
The EUR/JPY daily timeframe chart presents a Triple Bottom Pattern, a powerful bullish reversal formation that suggests a potential shift in market sentiment. This pattern occurs when price tests a key support level three times and fails to break lower, indicating strong buying interest at that zone.
Historically, a Triple Bottom leads to a significant trend reversal as sellers lose strength and buyers gain control. If confirmed by a breakout above resistance, this setup could provide a high-probability trading opportunity for swing traders and position traders.
Key Chart Components & Price Action Analysis
1. Triple Bottom Formation
The three bottoms marked on the chart represent repeated failed attempts by sellers to push the price lower:
Bottom 1 (August 2024): The first rejection from the support zone (~155.000) led to a temporary bounce.
Bottom 2 (October 2024): Price retested the same level, but buyers stepped in again, preventing a breakdown.
Bottom 3 (March 2025): The final test of support confirmed a strong accumulation zone, setting the stage for a potential bullish breakout.
In technical analysis, a Triple Bottom is considered a stronger reversal signal than a Double Bottom, as it represents prolonged buying pressure at key levels.
2. Support & Resistance Levels
Support Zone (~155.086): This level has been tested multiple times and remains a solid demand zone, where buyers have consistently entered the market.
Resistance Zone (~166.000): This level represents the neckline of the pattern, which must be breached to confirm a bullish reversal.
Breakout Target (~179.233): If price breaks out above 166.000, the projected target is set at 179.233, based on the height of the Triple Bottom pattern.
Trading Strategy & Entry Plan
1. Entry Point – Waiting for Confirmation
A buy trade should be initiated ONLY after a confirmed breakout above the resistance level (~166.000). Traders should wait for a daily candle close above this level, preferably with high volume, to confirm the breakout.
2. Stop Loss Placement
A stop-loss should be placed below the third bottom (support level) at 155.086 to minimize risk.
This placement ensures that if price invalidates the pattern by moving below the support level, the trade is exited early.
3. Profit Target Calculation
The measured move technique is applied to estimate the target. The height of the pattern (distance from support to resistance) is projected upward from the breakout point.
Target price: 179.233, aligning with historical resistance.
4. Risk-to-Reward Ratio & Position Sizing
The risk-to-reward ratio (RRR) for this setup is favorable, making it an attractive swing trade opportunity.
Traders should adjust position sizes based on risk tolerance, ensuring proper money management principles are applied.
Additional Confirmation Factors
1. Volume Analysis
A breakout with increasing volume will confirm strong bullish momentum.
Weak volume during breakout could indicate a false breakout, requiring caution.
2. RSI & Momentum Indicators
RSI trending above 50 suggests growing bullish strength.
Bullish divergence on RSI or MACD would add further confidence to the trade.
3. Retest of Resistance as Support
Often, after breaking resistance, price retests the breakout level before moving higher.
This could offer a secondary entry opportunity for traders who miss the initial breakout.
Potential Risks & Market Conditions to Watch
False Breakouts – If price fails to sustain above resistance, the pattern could be invalidated.
Macroeconomic Events – Major news events, such as ECB or BOJ policy decisions, could impact EUR/JPY movement.
Geopolitical Uncertainty – Unexpected events may cause volatility and deviation from technical patterns.
Conclusion – High-Probability Bullish Setup
The Triple Bottom Pattern in EUR/JPY is shaping up as a strong bullish reversal setup. If the price successfully breaks above 166.000, a rally toward 179.233 is expected.
📌 Trading Plan Recap:
✅ Entry: Buy above 166.000 (confirmed breakout).
✅ Target: 179.233 (measured move projection).
✅ Stop Loss: 155.086 (below support).
✅ Risk-Reward Ratio: Favorable for swing traders.
This setup aligns well with technical and price action strategies, making it an attractive trade idea for the upcoming weeks.

EURJPYEURJPY coming week we are looking for buy at the demand floor ,confirmation on 3hr ,SMA,EMA,MARKET STRUCTURE,RSI DIVERGENT POINT AT 161.615 AND 160.710 FOR BUY ZONE .TAGERT 50PIPS ,i think it will break 161.615 floor after respecting it and buy from the lower demand floor 160.710 zone
GOODLUCK AND STAY BLESSED.

EUR/JPY Short Setup – Potential Bearish ReversalTrade Plan:
📉 Sell Entry: 162.190
📍 Stop Loss: 163.459 (Above recent highs)
📍 Take Profit: 156.301 (Targeting key support level)
🔹 Price is rejecting resistance and showing possible weakness.
🔹 Volume is increasing, indicating strong participation.
🔹 If price fails to break higher, a drop to the target zone is likely.

eurjpy bearish moveit seems to be a similar movement n most of JPY pairs
a possible bearish movement on eurjpy on a daily timeframe

EUR/JPY LONGEUR/JPY LONG "break of a resistance area and retest it + 50% fib retracement + 50 ema dynamic support "

EUR/JPYWaiting for these levels to tapped in, for a buy to the upside,
Let me know what you guys think?

EURJPY Discretional Analysis: It's Gonna Go UpHonestly, I can’t fully explain it, but my intuition says it’s gonna go up. If I’m right, I’ll make a profit, and if not, I’ll take the loss and move on to the next trade.
Just my opinion, not financial advice.
