EURJPY 4h bearish ideaEUR/JPY (4H) Technical Analysis – March 6, 2025
Market Structure & Price Action:
The pair was previously in a downtrend, forming a descending channel.
A breakout above the descending trendline occurred, signaling a potential trend reversal or at least a strong retracement.
Price surged past resistance at 156.38, confirming the breakout with bullish momentum.
The next key resistance level was 159.87, which has now been tested.
Volume Analysis:
A noticeable increase in volume at the breakout point indicates strong buying pressure.
If volume starts declining at the current level, a pullback could occur before further continuation.
RSI Indicator:
RSI is at 63.92, approaching the overbought zone (70).
Momentum remains bullish, but there could be a short-term correction before the next move higher.
Key Levels to Watch:
Support: 159.87 (recent breakout level), followed by 156.38.
Resistance: 160.60 (current high) and possibly 162.00 if bullish momentum continues.
Potential Trading Scenarios:
Bullish Case: If price holds above 159.87, the uptrend could continue towards 161.00-162.00.
EURJPY trade ideas

EURJPY can be bearish EURJPY can be bearish for this 3 reasons :
1. The price hunt the important resistance zone (161.232 - 160.184) so the trend can revers at this price.
and here is a strong bearish candle stick :
2. The bearish trend line of the daily time frame shows the bearish trend.
3.Also the RSI number (53) shows that we have space to move lower.
Trigger : You can entry with a good candle stick at the resistance or even now without trigger. or any strategy you have.
Target : the target can be the support zone or when the RSI reaches below 30 number. (I'd rather RSI)
Stop loss : my stop loss is above last candle stick on resistance zone. you can have your personal stop loss but be sure you use stop loss.
It's just my personal analysis and I have no responsibility for your trades. thanks for your attention.

EURJPY Will Go Down From Resistance! Sell!
Please, check our technical outlook for EURJPY.
Time Frame: 1D
Current Trend: Bearish
Sentiment: Overbought (based on 7-period RSI)
Forecast: Bearish
The price is testing a key resistance 159.715.
Taking into consideration the current market trend & overbought RSI, chances will be high to see a bearish movement to the downside at least to 156.155 level.
P.S
The term oversold refers to a condition where an asset has traded lower in price and has the potential for a price bounce.
Overbought refers to market scenarios where the instrument is traded considerably higher than its fair value. Overvaluation is caused by market sentiments when there is positive news.
Like and subscribe and comment my ideas if you enjoy them!

EUR JPY - Wait and seeWaiting to see a break and retest of the entry price rather than placing a buy stop order.
Here's the plan:
Watch for price to break above 160.250 with a decisive candle (preferably closing above this level)
Then wait for a pullback to retest this level as new support
Enter long when price shows rejection from the retest level (with a small bullish candle or rejection wick)
Place your stop loss at 159.900 immediately after entry

T/R zones This idea is based on transient/recurrent zones
Very high probability (90%+) for the price to hit TP.
Probability was calculated on TF 15min.

Over 400 pips potential profitHere are three reasons to watch EURJPY closely:
1. Uptrend
2. Strong support level
3. New trend opportunity
Keep an eye on buy opportunities from the support zone.
The exact trade parameters will be shared in the VIP channel.

EURJPY1.4h
2.dnt
3.resist
4.double top /double top forming/
5.rsi56/sto46/volbearish
6.
7.fibext above/above
8.fibretrace above/above
9.
10.
11.
12.bearish divergence/bearish divergence/
13.bearish harami/bearish harami /
14.exp below/exp bos
1.2h
2.dnt
3.resist
4.double top/
5.
6.
7.fibext above /above
8.fibretraceabove/above
9.
10.
11.
12. bearish divergence/
13.evening star /bearish harami/tweezer top/ bearish hamami
14..exp /exp bos
We have a sell position on EURJPY

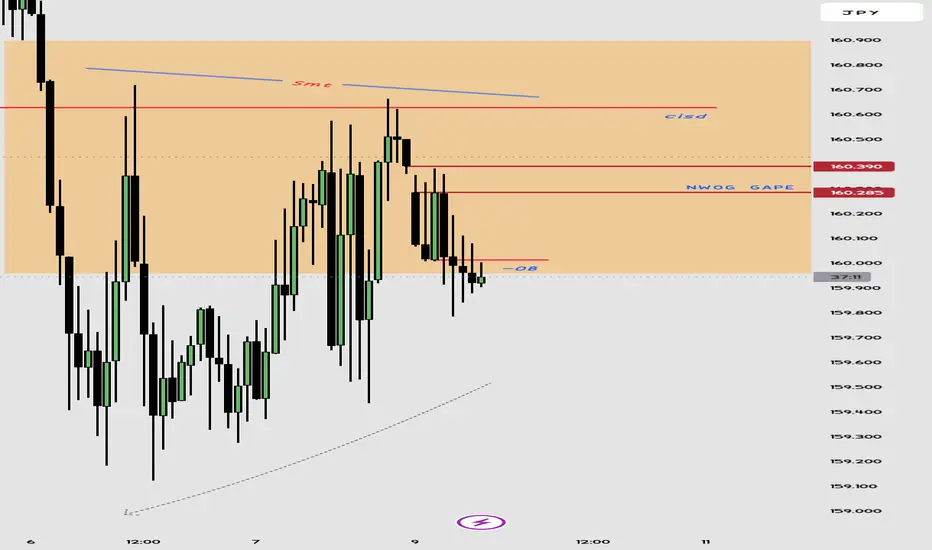
BEARISHNESS IN EURJPY We can see that price is rejecting from CISD and making a SMt and nwog is already field so we can look clear for clear lrlr
EURJPY retracement setupCurrently price is moving on a sideway motion & im looking for confirmation for me to sell from this sideway.
Once the price drop, i will be focusing on my buying zones to look for any confirmation to buy.

EURJPY SELL PROJECTION As we can see , is all about same thing. Trendline breakout+ pullback+ liquidity sweep+ execution.
Once price takes out that high and pullback to the sell zone, we go short

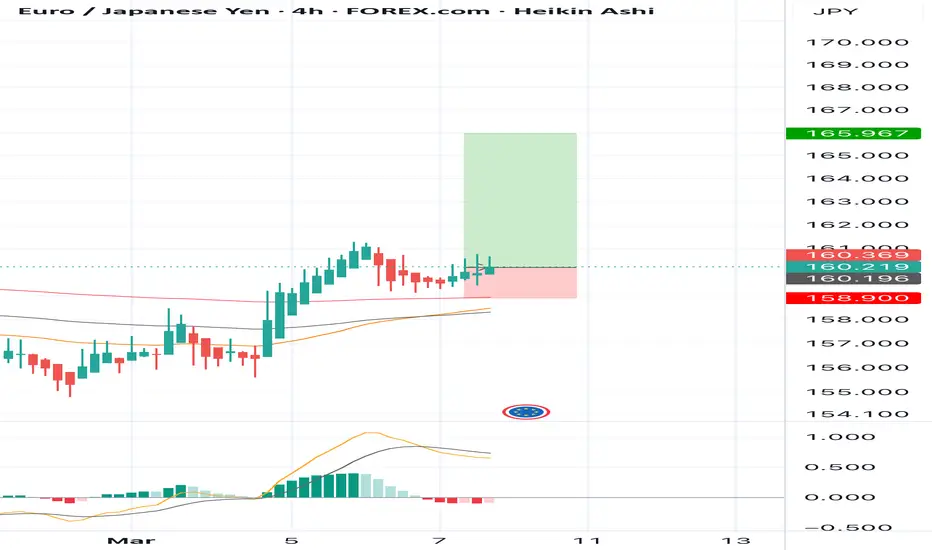
BUY EURJPY for bearish trend reversal STOP LOSS : 158.90 BUY EURJPY for bearish trend reversal
STOP LOSS : 158.90
Regular Bullish Divergence
In case of Regular Bullish Divergence:
* The Indicator shows Higher Lows
* Actual Market Price shows Lower Lows
We can see a strong divergence on the MACD already and There is a strong trend reversal on the daily time frame chart.....
The daily time frame is showing strength of trend reversal from this strong level of Support so we are looking for the trend reversal and correction push from here .....
TAKE PROFIT : take profit will be when the trend comes to an end, feel from to send me a direct DM if you have any question about take profit or anything
Remember to risk only what you are comfortable with…….trading with the trend, patient and good risk management is the key to success here
EURJPY TRADE SETUPWait for retest the entry level then take a trade for buy otherwise skip this setup

EURJPY shortEEURJPY has been ranging on this point and after a touch on the resistance price bounced and is reversing to touch it again. Expecting a move down
Support and ResistanceGood day traders, hope you are all well. As you can see in the setup above, we are looking to go long on EURJPY. This bias is based on pair correlation, technical analysis and chart patterns. the path i drew just gives the structure of the direction where i expect price to go, scale down the timeframes to accommodate your accounts and get more detail to price.

EUR/JPY Short Setup | Key Resistance Rejection & Bearish OutlookEUR/JPY is currently testing a key resistance zone around 160-161. If price rejects this level, we can anticipate a potential drop towards the 156 support zone.
There are two possible bearish scenarios:
A direct rejection from the resistance zone, leading to a bearish move towards 156.
A minor bullish breakout above 161, followed by a deeper pullback before resuming the bearish trend.
This analysis is based on past price action and key supply-demand zones. A strong confirmation at resistance (such as a bearish engulfing candle or a lower high formation) could be a good entry signal.
📉 Potential Target: 156
🚀 Invalidation Level: Above 163 (Break & Close)
📊 Risk Management: Proper stop-loss placement above 161.5/163
Would you like me to refine this further based on your specific trading style?

EUR/JPY Trade Setup Bullish Breakout StrategyEUR/JPY trade setup is based on a **bullish breakout strategy**. Here’s a breakdown of the analysis:
**🔹 Trade Details:**
- **Entry at 160.200:** This level is identified as a good buying point, likely after a breakout or strong upward momentum.
- **Stop Loss at 159.500:** If the price reverses and hits this level, the trade will be closed to limit potential losses.
- **Target at 161.200:** The price is expected to reach this level if the bullish momentum continues.
### **📊 Why This Trade?**
1. **Resistance Breakout:** If EUR/JPY breaks a key resistance level, it could trigger more buying pressure, pushing the price higher.
2. **Strong Buy Zone:** After breaking resistance, the market often enters a phase where buyers dominate.
3. **Risk Management:** The stop loss is placed to minimize potential downside, ensuring a controlled risk-to-reward ratio.
📌 **Conclusion:** If the price breaks above resistance and holds, it’s a strong buy setup. However, always use proper risk management to protect your capital. 🚀📈

EURJPY The Target Is DOWN! SELL!
My dear followers,
I analysed this chart on EURJPY and concluded the following:
The market is trading on 160.16 pivot level.
Bias - Bearish
Technical Indicators: Both Super Trend & Pivot HL indicate a highly probable Bearish continuation.
Target - 158.40
Safe Stop Loss - 160.90
About Used Indicators:
A super-trend indicator is plotted on either above or below the closing price to signal a buy or sell. The indicator changes color, based on whether or not you should be buying. If the super-trend indicator moves below the closing price, the indicator turns green, and it signals an entry point or points to buy.
———————————
WISH YOU ALL LUCK

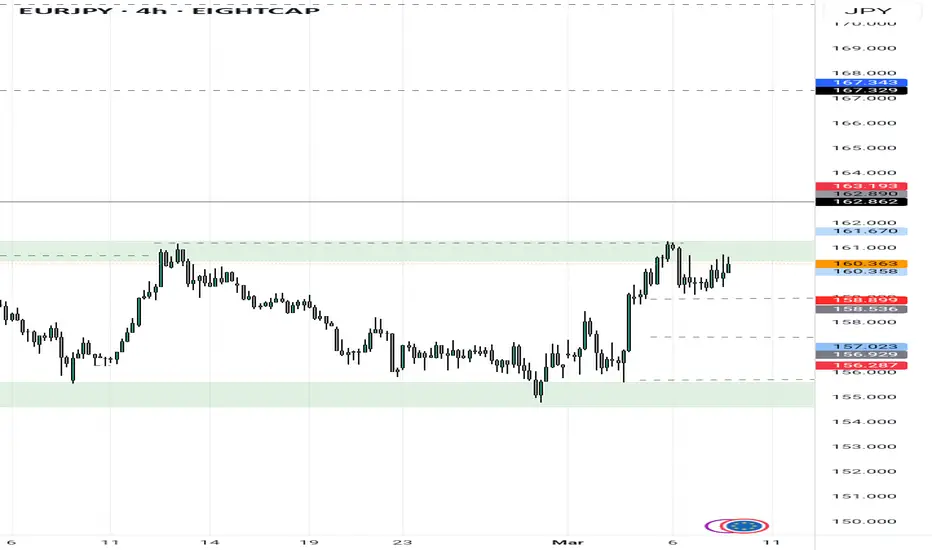
EURJPY is currently inside a large trading range pattern.EURJPY is currently inside a large trading range pattern.
Since the end of January, EUR/JPY has been moving in a volatile manner within a large trading range. This range is nearly 600 pips long and has kept EUR/JPY confined within this zone.
The reason for this volatility is related to fundamental factors from both the ECB and BOJ.
So far, EUR/JPY has tested the top of the structure again, and there are chances that it could move down to test the bottom near 155.00. It's important to be very careful because the market has been very unpredictable lately, but this setup could work out well.
You may find more details in the chart!
Thank you and Good Luck!
❤️PS: Please support with a like or comment if you find this analysis useful for your trading day❤️
Disclosure: I am part of Trade Nation's Influencer program and receive a monthly fee for using their TradingView charts in my analysis.

EURJPY - Follow the Bears!Hello TradingView Family / Fellow Traders. This is Richard, also known as theSignalyst.
📉EURJPY has been overall bearish trading within the falling wedge pattern marked in red.
Since it is retesting the upper bound of the wedge, I will be looking for trend-following sell setups on lower timeframes.
For now, we wait!⏱️
📚 Always follow your trading plan regarding entry, risk management, and trade management.
Good luck!
All Strategies Are Good; If Managed Properly!
~Rich
Disclosure: I am part of Trade Nation's Influencer program and receive a monthly fee for using their TradingView charts in my analysis.
EURJPY: Bullish Move From Support 🇪🇺🇯🇵
EURJPY looks bullish after a completion
of a consolidation on a key daily/intraday support.
A formation of a bullish imbalance candle provides a strong bullish confirmation.
I think that the price will go up and hit at least 160.33 level.
❤️Please, support my work with like, thank you!❤️

EUR/JPY Technical AnalysisTrendline Breakout:
EUR/JPY has broken a long-standing descending trendline, which previously acted as dynamic resistance, pushing the price lower. The breakout indicates a potential trend reversal from bearish to bullish.
Retesting Support Zone:
After the breakout, the price has retraced back to a key support zone around 156.000, highlighted in purple. This area has previously acted as a strong demand zone, where buyers have stepped in multiple times. Retesting this zone is a natural price action movement before confirming further upside momentum.
Bullish Projection:
If the support at 156.000 holds, EUR/JPY is expected to resume its bullish movement towards key resistance levels at 158.000 and ultimately 160.000. These levels align with previous price reaction zones, making them crucial take-profit areas for buyers.

EURJPY 4h Falling Wedge EUR/JPY – 4H Chart Analysis (March 6, 2025)
1. Market Structure & Trend Analysis
Falling Wedge Breakout: Price was previously in a descending channel, forming a falling wedge pattern, which is a bullish reversal signal.
Strong Breakout & Momentum: The breakout led to a sharp rally, confirming bullish intent.
Retest of 159.87: Price is currently retesting the 159.87 support zone, which was a previous resistance level.
2. RSI & Momentum Analysis
RSI at 63.92: Indicates strong bullish momentum but not overbought yet.
Healthy Pullback: The RSI shows a minor retracement, suggesting that price may be stabilizing before another push higher.
3. Key Levels to Watch
Support:
159.87 (Current retest level; previous resistance turned support)
156.38 (Major support below if price breaks down)
Resistance:
160.50 - 161.00 (Current local resistance zone)
162.00+ (Next major resistance if the uptrend continues)
4. Potential Trade Scenarios
📈 Bullish Scenario (Higher Probability)
If 159.87 holds as support, price could continue the uptrend towards 161.00+.
Long Setup:
Entry: 159.80 - 160.00 (on confirmation of support hold)
Stop-loss: Below 159.50
Target: 161.00, then 162.00
📉 Bearish Scenario (Lower Probability)
If price fails to hold above 159.87, we could see a deeper retracement toward 156.38.
Short Setup:
Entry: Below 159.50
Stop-loss: Above 160.00
Target: 157.50, then 156.50
5. Conclusion & Strategy
Bias: Bullish, but waiting for confirmation of support at 159.87.
Trade idea: A retest of 159.87 holding as support could provide a strong buy opportunity for continuation to 161.00 - 162.00.
Risk management: If price breaks below 159.50, consider avoiding longs and waiting for a deeper retracement.

EURJPY: Short Trade with Entry/SL/TP
EURJPY
- Classic bearish setup
- Our team expects bearish continuation
SUGGESTED TRADE:
Swing Trade
Short EURJPY
Entry Point - 159.79
Stop Loss - 160.94
Take Profit - 157.84
Our Risk - 1%
Start protection of your profits from lower levels
Disclosure: I am part of Trade Nation's Influencer program and receive a monthly fee for using their TradingView charts in my analysis.
❤️ Please, support our work with like & comment! ❤️
