EURJPY 2000 PIPS ON THE TABLE SHORTlooking short on this pair waiting for a few confluences to give us a 100 percent go ahead. quality and quantity.
EURJPY trade ideas

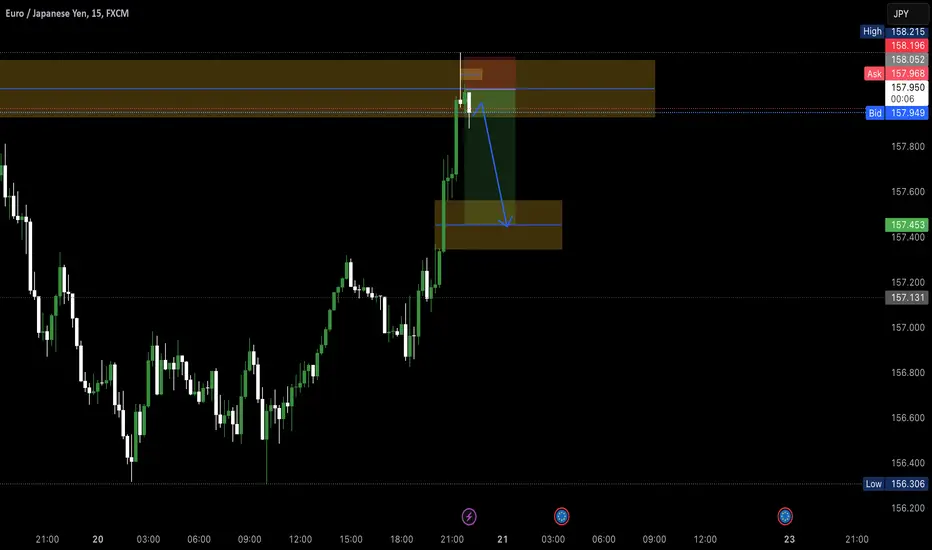
EURJPY buy signal. Don't forget about stop-loss.
Write in the comments all your questions and instruments analysis of which you want to see.
Friends, push the like button, write a comment, and share with your mates - that would be the best THANK YOU.
P.S. I personally will open entry if the price will show it according to my strategy.
Always make your analysis before a trade

EUR/JPY Bulls Seeking Signal as Price Clings to SupportEUR/JPY is teetering above known support, but with momentum favouring the bears, there’s no need to rush into longs.
If the pair continues find buyers on dips below 156.21, a long trade could be considered above the level with a stop beneath for protection. 158 looms as an initial target, with 159 and 161 other levels to watch.
The preference is to wait for a bottoming signal before entering, similar to the morning star patterns seen in December and early February. RSI (14) and MACD remain firmly bearish, reinforcing the need for patience given the setup is counter to momentum.
A convincing break below 156.21 would invalidate the setup, opening the door for shorts targeting a retest of 154.41.
Good luck!
DS

LongLong.
Use proper risk management
Looks like good trade.
Lets monitor.
Use proper risk management.
Disclaimer: only idea, not advice.

EURJPY - 23/02/25EURJPY - 23/02/25 Ideas for the coming week. Will update the comments if any trades come in to play.

EURJPY 2H SHORTEURJPY 2H
Fundamentals:
•Eurozone 10Y Bonds broke a key ascending trendline to the downside and have now retested it before continuing lower. This suggests that the EUR is overvalued and that investors are losing confidence in the Eurozone.
•Conversely, Japanese 10Y Bonds have been in a strong uptrend for a while now.
•The Non-Weighted Currency Index also shows that the Yen is strong, as it recently broke a descending trendline, retested it, and then surged higher.
•Meanwhile, the Non-Weighted Currency Index of the Euro shows the opposite pattern. A bearish flag is forming on the daily timeframe, which could indicate a potential decline.
•Lastly, we have the monetary policy divergence between the ECB and the BoJ. The BoJ is
expected to hold rates, while the ECB is expected to cut.
•The only concern is risk sentiment, which could weigh negatively on the Yen.
Technical Analysis
•On the daily timeframe, there is a strong uptrend, but a bearish triangle has formed.
•On the 8H timeframe, we can see a 61% Fibonacci rejection, forming a clear double top, signaling strong selling pressure, followed by a break of a key support level.
•On the H4 timeframe, another double top confirms the sellers’ strength, further validated by the break of the 50-SMA, which had previously acted as a dynamic support.
•I am expecting a rejection at 50% Fibonacci at 156.180, which will be my entry price.
•Stop-loss at 159.400, slightly above the previous support-turned-resistance.
•Target: 149.000, a psychological level and a round number.
•Retail traders are mostly long (80%), confirming that a short position would be a valid opportunity.

EUR/JPY: Bullish Reversal in Progress?EUR/JPY has been in a downtrend, but recent price action suggests a potential reversal is forming.
Key support at 155.821-156.042 has held strong, with multiple rejection wicks (highlighted in red ovals), indicating buying pressure at these levels.
The double bottom pattern (bullish reversal structure) is evident, further strengthening the case for an upside move.
The Fibonacci retracement levels align with key resistance zones, with 161.8% (160.987) and 164.774 as major upside targets.
📈 Bullish Confirmation & Upside Potential:
✅ Price is bouncing from a strong support zone 🚀
✅ Breakout above the descending trendline could trigger further buying momentum
✅ Moving Average (50-day) is acting as dynamic resistance; a break above it can fuel the rally
🎯 Key Targets:
🔹 First target: 158.000 (Psychological Level)
🔹 Second target: 160.987 (Fibonacci 0.618 level)
🔹 Final target: 164.774 (Major Resistance Zone)
🔻 Risk Management:
❌ Stop-loss below 155.821 to protect against further downside

gbpjpy buy signal. Don't forget about stop-loss.
Write in the comments all your questions and instruments analysis of which you want to see.
Friends, push the like button, write a comment, and share with your mates - that would be the best THANK YOU.
P.S. I personally will open entry if the price will show it according to my strategy.
Always make your analysis before a trade

EUR-JPY Bullish Bias! Buy!
Hello,Traders!
EUR-JPY keeps falling
Down in a downtrend
And the pair is locally
Oversold so after it hits
The horizontal support
Level of 155.100 we will
Be expecting a local
Bullish rebound
Buy!
Comment and subscribe to help us grow!
Check out other forecasts below too!


EURJPY - The 0.618 Fibonacci zone acting as resistanceThe EURJPY pair is one of the most interesting assets to watch.
Overall, the long-term trend has shifted from strongly bullish to neutral since the highs of July 2024. However, we can observe that each successive bullish rebound is reaching lower highs.
With the ECB lowering interest rates and the recent rate hikes by the Bank of Japan, a rebalancing is gradually taking place. As a result, at best, we can expect a range-bound movement between 156.00 and 164.00 in the coming weeks, and at worst, a sustained decline in the exchange rate in favor of the yen.
Holding yen long-term is not attractive from a swap perspective, but in the short term, attempting bearish rebounds is more interesting.
Here, I initiated a short trade, betting on a continuation of the downtrend after the pair rebounded from the 0.618 Fibonacci retracement zone. Historically, this level is significant and acts as resistance when trends establish themselves.

EURJPY SHORTS My initial thoughts were to look for buy entries as we hit a low, with a double bottom on the 15-minute chart showing potential signs of upside movement. I entered a buy position but was stopped out in profit due to the formation of a double top, indicating that the overall daily downtrend could still be in play. This reinforces the importance of risk management.
Let me know your thoughts in the comments

EUR/JPY Bearish Setup: Rejection from 200 EMAEUR/JPY 1H Analysis 📉📊
Bias: Bearish 🔻
This EUR/JPY 1-hour chart suggests a bearish setup with potential downside movement. Here’s a breakdown of key elements:
🔍 Key Observations:
200 EMA Resistance 🚨
Price is struggling below the 200 EMA (158.383), a strong dynamic resistance.
Bears are defending this area, preventing further upside.
Supply Zone (158.319 - 158.383) 🟥
Price recently rejected from this key resistance zone.
Sellers stepped in aggressively, pushing price lower.
Bearish Market Structure 📉
Lower highs and lower lows are forming, confirming the downtrend.
A potential retest of resistance before another drop.
RSI Indicating Weakness ⚠️
RSI (51.59) is below overbought levels and sloping downward.
The 56.02 resistance on RSI suggests limited buying strength.
📍 Trade Setup Idea:
Entry: Around 157.70 - 158.00 (Possible retest zone)
Target: 156.25 - 156.00 (Major support area) 🎯
Stop Loss: Above 158.40 to avoid fakeouts ❌
📌 Summary:
Bearish Bias 🚨 as long as price remains under 200 EMA.
Expect a pullback before continuation to the downside.
156.00 Target looks achievable if sellers maintain pressure.
⚡ Trade cautiously & manage risk properly! 🚀 Let me know if you need more details! 🔥

EURJPY weakness continues on BoJ rate hike signal The EUR currency further weakened against the JPY earlier today when the BOJ Governor Kazuo Ueda signalled that the central bank stands ready to increase government bond buying if long-term interest rates rise sharply, reiterating the BOJ’s long-standing commitment to supporting stable markets. The EURJPY price action sentiment appears bearish, supported by the longer-term prevailing downtrend.
The key trading level is at 158.90. An oversold rally from the current levels and a bearish rejection from the 158.90 level could target the downside support at 156.50 followed by 153.30 and 151.00 levels over the longer timeframe.
Alternatively, a confirmed breakout above 158.90 resistance and a daily close above that level would negate the bearish outlook opening the way for further rallies higher and a retest of 161.00 resistance followed by 162.10 levels.
This communication is for informational purposes only and should not be viewed as any form of recommendation as to a particular course of action or as investment advice. It is not intended as an offer or solicitation for the purchase or sale of any financial instrument or as an official confirmation of any transaction. Opinions, estimates and assumptions expressed herein are made as of the date of this communication and are subject to change without notice. This communication has been prepared based upon information, including market prices, data and other information, believed to be reliable; however, Trade Nation does not warrant its completeness or accuracy. All market prices and market data contained in or attached to this communication are indicative and subject to change without notice.

EURJPY What Next? BUY!
My dear friends,
Please, find my technical outlook for EURJPY below:
The price is coiling around a solid key level - 156.81
Bias - Bullish
Technical Indicators: Pivot Points High anticipates a potential price reversal.
Super trend shows a clear buy, giving a perfect indicators' convergence.
Goal - 158.63
Safe Stop Loss - 156.08
About Used Indicators:
The pivot point itself is simply the average of the high, low and closing prices from the previous trading day.
———————————
WISH YOU ALL LUCK

DeGRAM | EURJPY the rising bottom is formedEURJPY is in a descending channel between the trend lines.
The price is moving from the lower trend line and support level.
The chart has formed a rising bottom.
We expect growth after the retest and consolidation above the support.
-------------------
Share your opinion in the comments, and support the idea with a like. Thanks for your support!

EURJPY bullish set up 100+ pipsOur recent signal on this pair was 100 pips
Price has entered the excess zone near 156.48, a level where sellers have historically exhausted their momentum. Based on fair value principles, this is an area where buyers could step back in, bringing price back toward equilibrium.
🔍 Why I’m Buying Here:
✅ Excess Price Rejection – Price has moved outside the fair value range, indicating potential exhaustion of selling pressure.
✅ Mean Reversion to Fair Value – Expecting price to return toward the control price
🎯 Trade Plan:
📍 Entry: Around 156.48 (Excess Price Zone)
📍 TP 1: 157.75 (First reaction level)
📍 TP 2: 159.80 (Control Price Target)
If buyers step in as expected, we could see a move back toward the control price within the fair value range. Let’s see how this plays out! 🚀

EUR/JPY Bearish Setup | Rejection from 200 EMA & Supply ZoneEUR/JPY Analysis (Daily Timeframe) 📉🔥
Key Observations:
Price at 159.804 (-0.07%), showing minor bearish sentiment.
200 EMA Resistance (162.206) 🚧
Price previously rejected from this level, reinforcing it as a strong resistance zone.
Bearish Retest of Supply Zone (162.000 - 162.500) 🛑
Price attempted to break above but failed, leading to rejection and a move downward.
Breakout from Ascending Channel 📉
Price previously followed an upward trend but broke below, signaling a shift to bearish momentum.
Target at 155.732 (Next Support) 🎯
A blue arrow suggests an expected drop toward this key support.
Bias: Bearish 📉
Confirmation: If price fails to reclaim 160.500, further downside is likely.
Bearish Entry: Below 159.500 with a target at 155.732.
Invalidation: A daily close above 162.200 would shift bias to bullish.
🚨 Watch for rejection candles or strong bearish momentum for a sell setup! 🚨

EURJPY BUY EURJPY-The 4-hour structure has broken, and the price is currently sitting at the 4-hour low. A double bottom has formed on the 15-minute timeframe, and a break of the neckline could signal continuation. I will trail my stop loss as higher lows develop.


EURJPY-BUY strategy 3 hourlyWe are definitely a bit oversold here, and it may be an opportunity to be on the BUY side.
Strategy BUY at current 156.65-156.85 and take profit near 158.17 for now.