Falling towards 61.8% Fibonacci support?EUR/JPY is falling towards the pivot which has been identified as a pullback support that aligns with the 61.8% Fibonacci retracement and could bounce to the pullback resistance.
Pivot: 157.97
1st Support: 156.57
1st Resistance: 159.48
Risk Warning:
Trading Forex and CFDs carries a high level of risk to your capital and you should only trade with money you can afford to lose. Trading Forex and CFDs may not be suitable for all investors, so please ensure that you fully understand the risks involved and seek independent advice if necessary.
Disclaimer:
The above opinions given constitute general market commentary, and do not constitute the opinion or advice of IC Markets or any form of personal or investment advice.
Any opinions, news, research, analyses, prices, other information, or links to third-party sites contained on this website are provided on an "as-is" basis, are intended only to be informative, is not an advice nor a recommendation, nor research, or a record of our trading prices, or an offer of, or solicitation for a transaction in any financial instrument and thus should not be treated as such. The information provided does not involve any specific investment objectives, financial situation and needs of any specific person who may receive it. Please be aware, that past performance is not a reliable indicator of future performance and/or results. Past Performance or Forward-looking scenarios based upon the reasonable beliefs of the third-party provider are not a guarantee of future performance. Actual results may differ materially from those anticipated in forward-looking or past performance statements. IC Markets makes no representation or warranty and assumes no liability as to the accuracy or completeness of the information provided, nor any loss arising from any investment based on a recommendation, forecast or any information supplied by any third-party.
EURJPY trade ideas

Bearish drop off overlap resistance?EUR/JPY is rising towards the resistance level which is an overlap resistance that aligns with the 38.2% Fibonacci retracement and could drop from this level to our take profit.
Entry: 159.53
Why we like it:
There is an overlap resistance level that aligns with the 38.2% Fibonacci retracement.
Stop loss: 160.24
Why we like it:
There is an overlap resistance level that aligns with the 61.8% Fibonacci retracement.
Take profit: 157.97
Why we like it:
There is a pullback support level that is slightly below the 61.8% Fibonacci retracement.
Enjoying your TradingView experience? Review us!
Please be advised that the information presented on TradingView is provided to Vantage (‘Vantage Global Limited’, ‘we’) by a third-party provider (‘Everest Fortune Group’). Please be reminded that you are solely responsible for the trading decisions on your account. There is a very high degree of risk involved in trading. Any information and/or content is intended entirely for research, educational and informational purposes only and does not constitute investment or consultation advice or investment strategy. The information is not tailored to the investment needs of any specific person and therefore does not involve a consideration of any of the investment objectives, financial situation or needs of any viewer that may receive it. Kindly also note that past performance is not a reliable indicator of future results. Actual results may differ materially from those anticipated in forward-looking or past performance statements. We assume no liability as to the accuracy or completeness of any of the information and/or content provided herein and the Company cannot be held responsible for any omission, mistake nor for any loss or damage including without limitation to any loss of profit which may arise from reliance on any information supplied by Everest Fortune Group.


STOP LOSS HUNTING STRATEGY 8.8% OR 10% REWARDSHORT AT STATISTICAL STOP LOSS FROM MAJORITY
Will short at where most put their stop loss. This strategy is valid for me because this forex pair is indicating a bearish sentiment and the strongest ever recorded. But there is no previous statistics on such a price action. So I will short your stop loss which is around 160-167 (Aggressive account) and 170.5 (Buy and hold account).
I have no believe in a bearish continuation beyon that, it will just carry on going bullish and I'm not interested into shorting or buying this premium as it was bullish for decades and will not offer an exit strategy and/or a decent Stop Loss size
Factors of confluence:
- Anchored VWAP 0.618 above
- Monthly SIBI Fair Value Gap acting as strong resistance
- Previous POC levels
Take Profit:
- EMA200 Weekly chart
- Previous Fair Value Gap level
- Previous Month POC of June 2023 that hasn't been retested and had a strong bullish candle
- Quarterly Q1 Pivot Support Levels

EURJPYThe upcoming fundamental data and events that could affect the EUR/JPY trade directional bias include:
Eurozone Flash PMIs (February 21, 2025):
Manufacturing PMI: Expected to provide insights into the health of the manufacturing sector.
Services PMI: A strong services sector can bolster the euro, while weakness may lead to bearish sentiment.
Impact on EUR/JPY: Stronger-than-expected PMIs could support the euro against the yen, leading to a bullish bias for EUR/JPY. Conversely, weaker PMIs might lead to a bearish outlook.
Bank of Japan (BoJ) Monetary Policy Meeting (February 19, 2025):
The BoJ's stance on interest rates and inflation will be closely watched. Recent GDP growth data indicates a robust economy, which may lead to speculation about potential rate hikes.
Impact on EUR/JPY: If the BoJ signals a more hawkish approach or hints at future rate increases, it could strengthen the yen against the euro, resulting in a bearish bias for EUR/JPY.
European Central Bank (ECB) Commentary:
Recent comments from ECB officials regarding potential rate cuts may weigh on the euro.
If the ECB maintains a dovish stance while the BoJ turns hawkish, this could lead to further declines in EUR/JPY.
Current Market Sentiment. The recent decline following Japan's robust GDP report indicates a stronger yen, which may continue if economic data supports this trend.
The bearish sentiment towards EUR/JPY due to deteriorating Eurozone growth expectations relative to Japan.
Technical Analysis
Support and Resistance Levels: The pair is currently testing key support levels. A break below these levels could trigger further selling pressure.
Conclusion
The directional bias for EUR/JPY next week will largely depend on the outcomes of the Eurozone PMIs and the BoJ's monetary policy meeting. Strong economic indicators from Europe could bolster the euro, while hawkish signals from Japan may strengthen the yen. we will closely monitor these developments and adjust our positions accordingly based on market reactions to key data points.

ideaThis Analysis Can Change At Anytime Without Notice And It Is Only For educational Purpose to Traders To Make Independent Investments Decisions.
Disclaimer
The information and publications are not meant to be, and do not constitute, financial, investment, trading, or other types of advice or recommendations supplied or endorsed by TradingView

I'm waiting for a good drop on the chart.It is at a historical ceiling where resistance is very strong. I expect a return to the 170 range and a market decline. Our main target is 9%. There is a possibility of a decline of up to 20% in the long term. The decline is probably as low as 20%. I am taking profit with a stop.
1- Break of the uptrend line
2- Start of the bearish phase
3- Retracement to the 86% Fibonacci line in the bearish phase
4- Start of our short position and receive 9% of the chart
OANDA:EURCAD

EURJPY 100 pips sell signal This sell is based on the pullback seen on the chart, keep in mind major news coming today and could affect this

a long term idea on eurjpythis idea make take a long time to happen but it worth it
I believe the long term trend on yen pairs are gonna be bearish

EURJPY BullishEURJPY has been on a range.
158.50 with FVG is a possible entry to go long.
157.50 maybe a even better entry for those who are patient
167 maybe the 1st target.

EURJPY: Get Ready For The Next MovementEURJPY: Get Ready For The Next Movement
The EURJPY has completed a bullish harmonic pattern and has tested a strong support and psychological zone near 156.00. Despite initial weakness, EURJPY recovered very well.
The JPY's strength has been bolstered by market uncertainty related to tariffs, driving volume towards safe-haven currencies like the JPY.
Currently, the EURJPY appears to be stabilizing, suggesting for a potential correction for the moment. The bullish trend may resume during next week after the price spends some time in correction.
You may find more details in the chart!
Thank you and Good Luck!
❤️PS: Please support with a like or comment if you find this analysis useful for your trading day❤️
Disclosure: I am part of Trade Nation's Influencer program and receive a monthly fee for using their TradingView charts in my analysis.

EUR/JPY Bias: Bearish📉 Bias: Bearish
📍 Target: Yearly Fair Value Gap (FVG) below
🕵️♂️ Analysis:
Daily TF: Price has completed an inducement grab ✅
Expectation: Price to tap into the bearish Order Block (OB) 🔄
HTF Move: Liquidity grab expected before further drop 🌊📉
🎯 Plan: Wait for price to react at the OB and look for confirmations before entering a short position. 🚀📊

EURJPY The Week Ahead 17th Feb 25The EURJPY price action sentiment appears bearish, supported by the longer-term prevailing downtrend.
The key trading level is at 161.30, 50 Day Moving Average level. An oversold rally from the current levels and a bearish rejection from the 161.30 level could target the downside support at 158.85 followed by 15687 and 156.00 levels over the longer timeframe.
Alternatively, a confirmed breakout above 161.70 resistance and a daily close above that level would negate the bearish outlook opening the way for further rallies higher and a retest of 162.76 resistance followed by 163.70 levels.
This communication is for informational purposes only and should not be viewed as any form of recommendation as to a particular course of action or as investment advice. It is not intended as an offer or solicitation for the purchase or sale of any financial instrument or as an official confirmation of any transaction. Opinions, estimates and assumptions expressed herein are made as of the date of this communication and are subject to change without notice. This communication has been prepared based upon information, including market prices, data and other information, believed to be reliable; however, Trade Nation does not warrant its completeness or accuracy. All market prices and market data contained in or attached to this communication are indicative and subject to change without notice.

Bearish Momtentum expected EURJPY Sell PositionBearish Momtentum expected EURJPY Sell Position is expected based on Potential reversal zone and behavior of market.

EURJPY SHORT TO 152.000My insight on EURJPY is short due to lower Highs being created on a bigger TF showing that pricing is trending downwards.

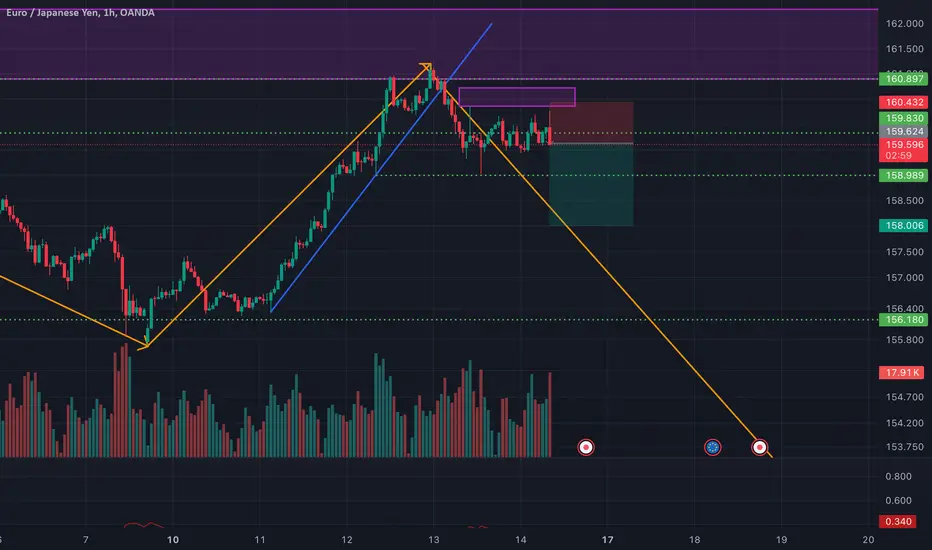
Intraday Trade: EURJPY SELLTrend in H4 is downtrend
There is a reversal on H1 aligning with the higher TF trend
Entry: 159.624
SL: 160.432
TP: 158.006
Trade with your own risk
Not a financial advise
OANDA:EURJPY