EUR/JPY: Bullish Setup on 170.00 Breakout & Dovish BoJWe've identified a compelling, high-conviction long trade setup on EUR/JPY, perfect for a limit order right now. This trade leverages a powerful combination of fundamental divergence and a confirmed technical breakout, setting the stage for quick execution and potential profit! 🎯💰
Fundamental Rationale: 🌍📊
Japanese Yen (JPY) Weakness: The JPY is under significant bearish pressure. 📉 The Bank of Japan's (BoJ) persistently dovish monetary policy, keeping interest rates at historic lows, creates a wide interest rate differential. This fuels "carry trades," where investors borrow low-yielding JPY to invest in higher-yielding currencies like the Euro, increasing JPY supply. Recent weak economic data, including a decline in Tokyo CPI, reinforces expectations that the BoJ will not hike rates in 2025. Additionally, a global "risk-on" sentiment diminishes the JPY's safe-haven appeal, leading to capital outflow and sustained Yen depreciation. 🐻📉
Euro (EUR) Stability: While the Euro isn't showing explosive bullish momentum, its relative stability provides a crucial counter-balance to the weakening Yen. 🇪🇺 The European Central Bank (ECB) is inclined to maintain its current policy, and recent Eurozone inflation data hasn't significantly altered expectations for further rate cuts in H2 2025. This steady footing, paired with the pronounced JPY weakness, creates a compelling bullish case for EUR/JPY. The Euro's role is to be a stable anchor against a fundamentally weak JPY, allowing the cross to climb. ⚖️
Technical Setup: 📊✨
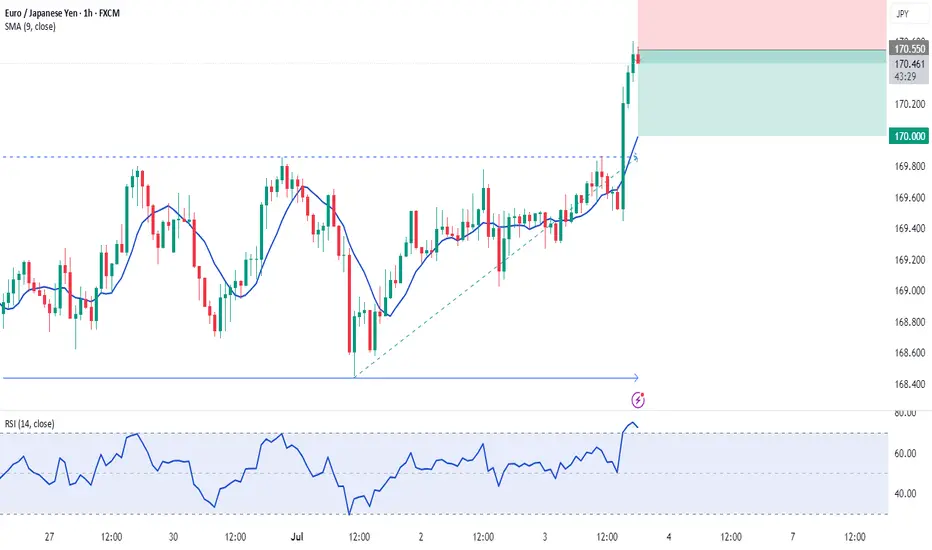
Decisive Breakout Confirmed: EUR/JPY has achieved a powerful and decisive breakout above the critical psychological resistance of 170.00 and its previous yearly high of 169.75. This is a monumental technical event! Such a sustained move above key long-term barriers signals strong underlying buying pressure and confirms a "new trigger for the bulls," indicating a high probability of continued uptrend. 🚀⬆️
High-Probability Entry Strategy: Our entry strategy is designed for a quick and successful fill. Following the confirmed breakout, we anticipate a classic "breakout and retest" phenomenon, where price pulls back to retest the former resistance (now new support). By placing a limit order slightly below the current market price, at 170.10, we aim to catch this anticipated pullback, securing an optimal entry with a tighter risk profile. 🔄🎯
Clear Resistance Target: Our single Take Profit target is strategically set at 170.90, just below the next significant resistance: the 78.6% Fibonacci retracement level at 170.93. This level, derived from a previous long-term decline, represents a key area where price might encounter resistance. Targeting slightly below it increases the probability of the TP being hit before any potential reversal. 🎯✅
Trade Parameters: 📋✨
Currency Pair: EUR/JPY 💶🇯🇵
Direction: Long (Buy) ⬆️
Entry (Limit Order): 170.10
Take Profit (TP): 170.90
Stop Loss (SL): 169.60
Risk-Reward Ratio: 1.6:1 (A favorable ratio for a high-probability setup!) ✅
EURJPY trade ideas

EURJPY is rising to 173 for a bearish and larger pattern.EURJPY is rising to 173 for a bearish and larger pattern.
Since the beginning of March 2025, EURJPY started an uptrend and is still rising in a clear way with no signs of reversal.
As long as the BOJ has no plans to change its monetary policy statement or make any significant interventions in Forex, then EURJPY can continue to rise higher.
There is a high possibility that Eurjpy will complete a major daily harmonic pattern near 173.00.
Given that EURJPY may be close to the all-time high zone, the reversal could also occur within the zone, but I think EURJPY may start a reversal between 173.00 and the higher level. We can look for sell signals there.
At the moment, EURJPY is rising and may rise to 173.00, although not in a clear way.
You may find more details in the chart!
Thank you and Good Luck!
PS: Please support with a like or comment if you find this analysis useful for your trading day
Disclosure: I am part of Trade Nation's Influencer program and receive a monthly fee for using their TradingView charts in my analysis.

EUR-JPY Will Keep Growing!⭕Buy!
—
#EURJPY is trading in an
Uptrend and the pair broke
The key horizontal level
Of 169.814 and the breakout
Is confirmed so after a potential
Retest of the support cluster
Of the rising and horizontal
Support lines below we will
Be expecting a bullish continuation
Buy!

EURJPY SHORT DAILY FORECAST Q3 D4 W27 Y25EURJPY SHORT DAILY FORECAST Q3 D4 W27 Y25
Professional Risk Managers👋
Welcome back to another FRGNT chart update📈
Diving into some Forex setups using predominantly higher time frame order blocks alongside confirmation breaks of structure.
Let’s see what price action is telling us today! 👀
💡Here are some trade confluences📝
✅Daily Order block identified
✅4H Order Block identified
✅1H Order Block identified
🔑 Remember, to participate in trading comes always with a degree of risk, therefore as professional risk managers it remains vital that we stick to our risk management plan as well as our trading strategies.
📈The rest, we leave to the balance of probabilities.
💡Fail to plan. Plan to fail.
🏆It has always been that simple.
❤️Good luck with your trading journey, I shall see you at the very top.
🎯Trade consistent, FRGNT X


EUR-JPY Will Keep Growing! Buy!
Hello,Traders!
EUR-JPY is trading in an
Uptrend and the pair broke
The key horizontal level
Of 169.814 and the breakout
Is confirmed so after a potential
Retest of the support cluster
Of the rising and horizontal
Support lines below we will
Be expecting a bullish continuation
Buy!
Comment and subscribe to help us grow!
Check out other forecasts below too!
Disclosure: I am part of Trade Nation's Influencer program and receive a monthly fee for using their TradingView charts in my analysis.

EURJPY H4 LONG SETUPTECHNICAL ANALYSIS
This pair is currently in a beautiful bullish trend, and price is currently at WM4/weekly tp@170.588. I am anticipating profit-taking from traders as the trading week comes to a close. This trade plan will probably play out next week.
Bulls will be looking for long setups at support @ 169.791/169.395, which is the buy zone and previous resistance.
A long trade at that level will give us a target @ 170.588 for next week.
FUNDAMENTAL ANALYSIS
The trend meter shows that the pair is bullish and projected to continue its bullish momentum.. Most institutional traders are long both currencies, but we can see a slight increase in longs for the Euro and short positions being added on JPY.
The retail sentiment indicator shows that most retail traders are short this pair, with 74% being short and only 26% being long, indicating they are on the wrong side of the trade.
The plan is to go long once price gets to the buy zone.

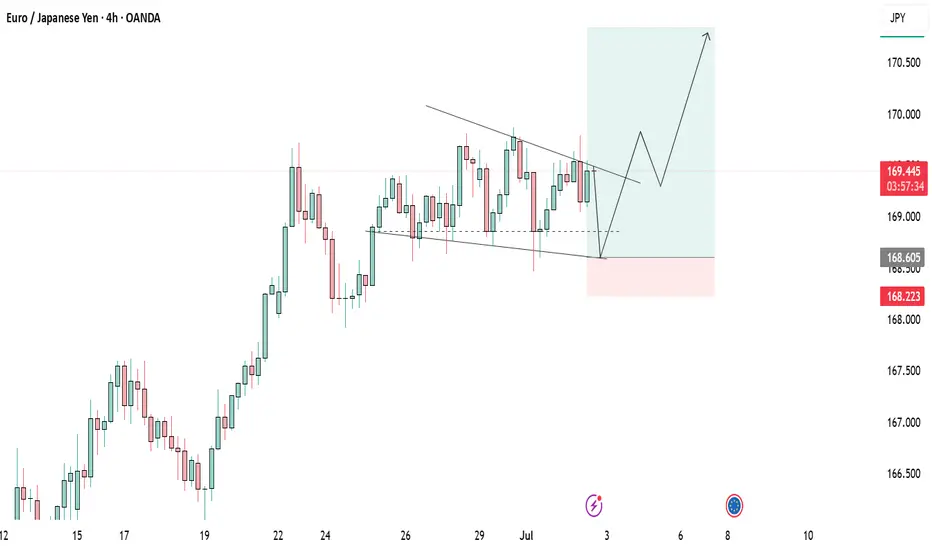
EURJPY Wave Analysis – 3 July 2025- EURJPY broke resistance level of 169.55
- Likely to rise to resistance level 72.00
EURJPY currency pair recently broke above the key resistance level 169.55 (which reversed the price multiple times at the end of June, as can be seen from the daily EURJPY chart below).
The breakout of the resistance level 169.55 accelerated the active short-term impulse wave 3 of the intermediate impulse wave (C) from February.
Given the clear daily uptrend, EURJPY currency pair can be expected to rise further to the next resistance level 172.00, target price for the completion of the active impulse wave (C) lying at the intersection of the 2 up channels from June and March.

EURJPY sellstrong resistance above and a lot of failed attempts
drop down expecting below 170.0 level

EURJPYLAST month i called eurjpy long ,and we still holding that buy based on the following context.
EU10Y= 2.602%
EUR INTEREST RATE after governing council decision 25basis point on deposit facility 2% main refinancing operation 2.15% and marginal lending facility 2.40%
JP10Y=1.438%
JPY INTEREST RATE =0.5%
BOND YIELD DIFFERENTAL= EUR-JPY= 1.164 % FAVOUR EUR CARRY TRADE.
INTEREST RATE DIFFERENTIAL= EUR-JPY=1.5 % FAVOUR EUR CARRY TRADE
CARRY TRADERS BORROWED FROM BOJ AND INVESTED IN ECB BOND MARKET.
STRUCTURE OF MARKET=the daily break of supply roof turn to demand floor and EURJPY WENT MOON

07/02/2025 | EURJPY | BULLISH - QUICK SCALPALL TIMEFRAME:
Bullish
Invalidation: 169.482
Target: 170.045

SELL EURJPY for bullish trend reversal STOP LOSS: 170.17SELL EURJPY for bullish trend reversal
STOP LOSS: 170.17
Regular Bearish Divergence
In case of Regular Bearish Divergence:
* The Indicator shows Lower Highs
* Actual Market Price shows Higher Highs
We can see a strong divergence on the MACD already and There is a strong trend reversal on the 4 hour time frame chart.....
The daily time frame is showing strength of trend reversal from this level resistance so we
are looking for the trend reversal and correction push from here .....
TAKE PROFIT : take profit will be when the trend comes to an end, feel from to send me a direct DM if you have any question about take profit or anything
Remember to risk only what you are comfortable with….....trading with the trend, patient and good risk management is the key to success here

EURJPY LONG IDEAI have been waiting for this EURJPY long setup to form for the past 2 trading sessions.
This morning I saw this beautiful bullish swing low formed and that is my entry signal for to take a long trade on EURJPY.
REASONS:
EURJPY is super bullish right now.
The Daily and 4Hour time frame trend is extremely bullish. So, am only looking to take a long buy to follow the trend direction.

SELL EURJPYASIA session will sink EURJPY price low towards 168,888. Price is currently consolidating between two ranges, let us exploit this move

Potential Bullish EURJPYI'll be looking to enter 2 trades from this area.
Trade 1 - 1:1 RR
Trade 2 - 1:3 RR
Tighten up SL if trade takes the 1:1 and makes a significant move away from the level.

EURJPY - bullish Story: Market is in bullish trend with series of HH and HLs. There is no divergence on the chart therefore we expect market to continue bullish trend. as the market is continuing bullish, we look for any continuation pattern. Yes, we have found one, which is bullish flag pattern.
there is no reversal or harmonic pattern.
Anticipate : it is anticipated that market will breakout the Flag neck line and we anticipate the market to reach its projection of flag-pole.
Plan is to enter in the market on break out of neckline and continue riding till the projection of flag-pole with our SL placed just below the Marked HLs and we set our TP1 and TP2 with R:R of 1:1 and 1:2 respectively.

EURJPY Gearing Up for LongsThe triangle is tightening at the resistance and we will soon see price break upwards and rally towards 170,841. Sell for now
EUR-JPY Strong Uptrend! Buy!
Hello,Traders!
EUR-JPY is trading in an
Uptrend along the rising
Support and we are already
Seeing a local rebound
Which reinforces our bullish
Bias and we will be expecting
A further bullish move up
Buy!
Comment and subscribe to help us grow!
Check out other forecasts below too!
Disclosure: I am part of Trade Nation's Influencer program and receive a monthly fee for using their TradingView charts in my analysis.

EURJPY Sell- Go for sell
- Refine entry with smaller SL for better RR, if you know how
- keep looking for sell even if price goes one more up
A Message To Traders:
I’ll be sharing high-quality trade setups for a period time. No bullshit, no fluff, no complicated nonsense — just real, actionable forecast the algorithm is executing. If you’re struggling with trading and desperate for better results, follow my posts closely.
Check out my previously posted setups and forecasts — you’ll be amazed by the high accuracy of the results.
"I Found the Code. I Trust the Algo. Believe Me, That’s It."


EUR/JPY Potential Bullish ContinuationEUR/JPY Potential Bullish Continuation 📈🔍
📊 Technical Overview:
The EUR/JPY chart presents a bullish channel structure, indicating an overall upward trend. Price action respected the channel boundaries with multiple confirmations before the latest bearish correction.
🔹 Structure Highlights:
🔵 Ascending Channel: Price moved steadily within an upward-sloping channel.
🟠 Support Rebound: A strong bullish candle formed on June 20th after touching the lower boundary — a clear support confirmation.
🔴 Recent Rejection: On July 1st, price tested the upper channel resistance and faced rejection, forming a bearish engulfing candle.
🟫 Support Zone Marked: Around the 167.800 level, this zone has been tested multiple times, indicating a possible demand area.
🔁 Current Scenario:
The pair has broken down from the internal trendline (light brown line) and is heading toward the support zone. A bullish bounce from this area may lead to a rally toward the Target Point at ~172.000 🎯.
📌 Key Levels:
Support Zone: 167.600 – 168.000
Resistance Zone: 170.500 – 172.000
Current Price: 168.994
📈 Outlook:
If support holds and bullish momentum returns, there's potential for a move toward the target area at the top of the channel. However, a break below the support zone could invalidate the bullish scenario and suggest a deeper correction.
🧠 Conclusion:
Wait for bullish confirmation near support before considering long positions. A clean break and retest of the support zone could signal a continuation of the upward trend.

