EURNOK trade ideas
EURNOK - H4 SHORT SETUP - TTS-IIEntered SHORT on on EURNOK after the break and confirmed retest of the support turned resistance at 9.70000.
Monday gap has broken the 20 SMA as well as the range support and waited for the confirmed retest of the previous support (now resistance) before entering SHORT.
TP is at 9.40000 (365 pips) which is the first logical level of structure while SL just above (or barely above) the trigger candle (180 pips), giving a potential risk reward of 1:2.
#EURNOK and #UKBRENT #UKOIL CorrelationWhen we look at correlations in charting, we sometimes see certain #FX pairs are correlated to a #commodity or #index, in this instance I am giving you an example of #EURNOK vs #UKOIL #BRENT. These charts can help you make distinctions in the trend of the commodity, so when we see a #bullish EURNOK, you want to be looking a trades that are bearish Brent/UKOil, again this is not tick for tick, so, you will use confirmation like trendlines, underlying fundamentals etc. But you can clearly see the correlations. I suggest you try this with other markets, like #USDNOK #WTI #USDJPY #NIKKEI #SPX #10YR
EURNOK - 240 - Ranging...for now...Trade Alert
EURNOK continues to range between 9.6940 and 9.7700 levels. FOr now, we will stay put, but keep on monitoring key levels, in order to spot a possible breakout opportunity.
A drop below the 9.6940 zone could invite more bears to the table,which could open the path towards the next potential area of support near 9.6415, marked by the high of the 16th of November.
On the other hand, a break above 9.7510 might lead a bit more upside, at least towards the 9.7700 barrier, a break of which may get more buyers excited, as it would increase the possibility of seeing the pair moving towards the 9.8050 resistance area, marked by the high of the 7th of September.
Don't forget your SL.
CFDs are complex instruments and come with a high risk of losing money rapidly due to leverage. 68% of retail investor accounts lose money when trading CFDs with the Company.
EURNOK Sell IdeaEURNOK Sell Idea @ Daily Supply Zone (9.75401 - 9.80640)
Sell Limit: 9.74897
Stop Loss: 9.81383
Take Profit: 9.60227
Risk Management = 0.01/$100
Recommended Leverage not to exceed 1:50
Recommended Risk Ratio 1:1.5 – 1:3
Close partially the contract once it reaches 50% of profit, Move stop loss over the entry level
Close partially the contract once it reaches 80% of the profit
EURNOK - 240 - Wait for a breakTrade Alert
EURNOK got stuck between the 9.7230 and the 9.6930 levels. For now, we will stay put and wait for the pair to exit this short-term range.
Even though tomorrow's Norwegian unemployment figure could be a non-event for the Krone, still, we will watch the EURNOK carefully during the release of the data.
Always have your SL in place.
EURNOK - Daily - Still climbingTrade Alert
EURNOK continues to move north after its reversal on the 17th of October. A good break above the 9.5675 level could confirm an upcoming higher high. This is where we could start looking at levels that were last tested around mid-September.
On the downside, a break below the short-term upside support line and also a drop below the 9.5265 area could invite more bears into the game and we could see the pair sliding towards the other areas of support.
Please see the chart for details.
Always have your SL in place.
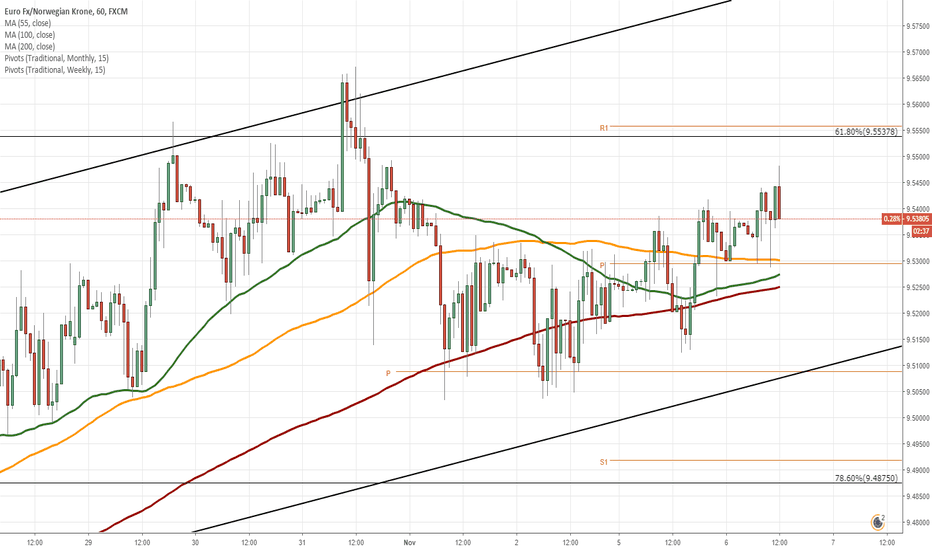
EUR/NOK 1H Chart: Bullish momentum prevailsThe Euro has been appreciating against the Norwegian Krone since the the middle of October. This movement has been bounded in an ascending channel.
Given that the currency pair is supported by the 55-, 100– and 200-hour SMAs, it is likely that the rate continues to go up within the following trading sessions. Technical indicators for the 4H and 1D time frames also support bullish scenario. A potential target is the resistance cluster formed by a combination of the weekly R2, the monthly R1 and the Fibonacci 50.00% retracement located circa 9.6000.
It is the unlikely case that some bearish pressure still prevails in the market, the Euro should not exceed the weekly S2 at 9.4719.
Watch #EURNOK price action at 6 years bullish trendline- 6 years long bullish trendline is very close to spot price.
- Important key horizontal supp/res zone at 9,39-9,42
- EWO and MACD show minor positive divergence compared to lower low in price
- Heikin-Ashi indecision
Upper key levels are: 9,4810 / 9,5440 / 9,61


