TP on half of shorts. Look for sell signal at 9,38-9,40As goes the Oil.... goes the NOK (more or less).
- Daily trend is bearish, and Weekly HA structure also suggests the pair has chance to continue lower towards 9,03-9,09.
- However short term I see wave exhaustion signal on daily: haDelta/SMA3 already signalled yesterday minor momentum drop. Today candle confirms start of consolidation/pull back above 9,25 resistance. Candle has both upper and lower wicks, haDelta moved more up.
- I recommend to take profit on half of short positions. Doha w/e, and as I wrote yesterday, WTI and Brent oil started a pull back too.
- Bearish support is 9,38-9,41 area, looking to re-sell there.
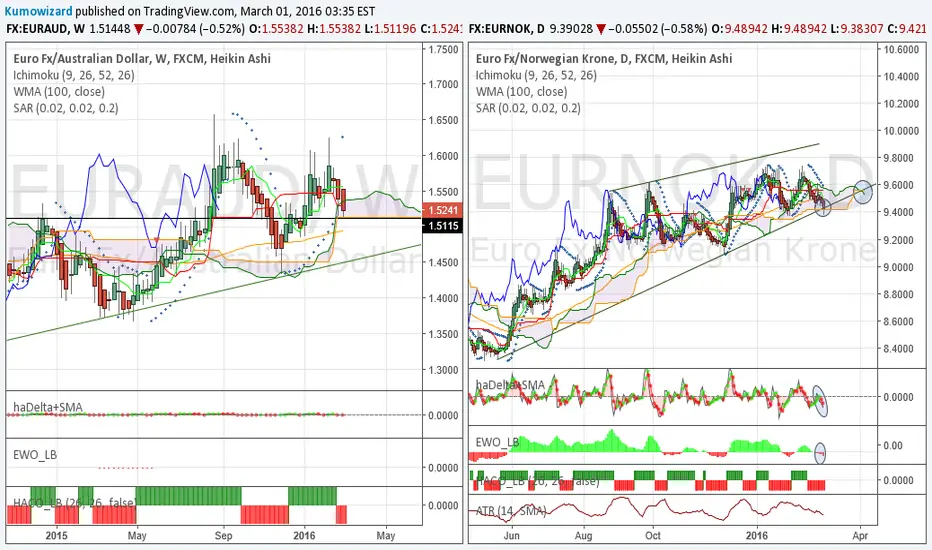
EURNOK trade ideas


Sell moreThose who follow me on Twitter, already saw a similar chart from me about EURNOK. Now I add the weekly too, plus I'll have some more notes.
Weekly:
- The big trend is bullish, but we may experience further counter trend wave towards stronger supports
- Ichimoku picture is bullish... or is it turning neutral? It will be decided if we finally see a decisive candle close below Kijun.
- Stronger supports below Kijun are: 100WMA and Senkou B (Kumo bottom) ard 9,00-9,05 and the major trendline ard 8,80+
- Heikin-Ashi still showed undecision last week as candle had both upper and lower wick and a very small body, but price action was bearish on friday, which ended in a red body finally. Price has not managed to move back above Tenkan Sen (9 weeks avg) for 4 weeks, however still could not close below Kijun either.
haDelta/SMA3 crosses down at zero, this suggests bears may get stronger momentum.
Note: bearish divergences are always nice to realise and examine, but as you can see in both haDelta and EWO, divergences can develop and exist for extremely long time! Divergences alone can not be traded!
Daily:
- As it often happens, the initial bearish Kumo break did not have an immediate follow through at beginning of March. Bulls tried everything to push back price above 100WMA and 9,50-9,51 key supp/res lvl, but they failed 14-16 times!!! (that is like trying for almost every trading day for more than 3 weeks!)
- Heikin-Ashi signals turned bearish last friday, with strong momentum. In case price clears 9,30-9,35 resistance, selling will accelerate down to 9,00-9,10 zone.
- EWO is still neutral/starting bearish.
As I wrote on Twitter, I have been holding sometimes more sometimes less EURNOK short for several months now. I think it is time to hold more! If someone doesn't like selling EUR ag NOK, can still do another relative value trade, long NOKSEK, which I also called for on Twitter few days ago.
p.s.: Of course the whole success depends a lot on Brent Oil price action, as Norway is one of the world's biggest oil producers, but recently I see Oil price well supported by buyers.


BUY NOW - LOW RISK TRADELONG TRADE :
Entry : BUY @ 9.4600
Target : 9.7030
Stop : 9.3420
Risk Level : LOW
RR ratio : 1:2


EURNOKWhere are we going now ?
Wait and see, if up short if down long - i would not take a trade in the middle of nowhere
Trade your plan, if you don't have avoid trading
(Warning. I am a private trader. I don't sell any signals, equipment or other sources of learning about forex . I am here to share ideas based on technical analysis to improve me on Forex practice. Trading forex is dangerous and can result in significant financial losses. So I am not responsible when the results of the positions to be taken on the basis of my charts since these constitute no basic signals but simply my own market analysis. As i always says, trade your plan and if you don't have any, avoid trading.)
Update status


EURNOKBreak or not break the triangle
Here is the price on extension if goes to (let see)
Wait and see
Trade your plan - if you dont have any, avoid to trade - stay safe
Thanks for clicking the like button. In case of another view, questions or comments ? share it with pleasure More ideas following. Click the follow button to keep updated when I publish new ideas or update already published ones. Thanks for your visit !
Update status

EURNOK triangleQuite a solid symmetrical triangle forming here and getting very close to the apex.
Profit targets based on previous structure. (Zoom out to see lower target structure.)
Trade a close outside the triangle.


A short set up on the EUR/NOK.A Cup and Handle pattern formed from the highs of December 2008. The black horizontal level at 9.15202 provided strong resistance early to mid 2009 (red arrows), it came back into play December 2014 and January 2015 (red arrow) again providing strong resistance. From September 2015 until the end of the year that level became strong support (green arrow). A broadening formation from september 2012 has also formed and January of this year we failed to reach the upper trendline before heading back towards the lower trendline as well as the 9.15202 area where the last green arrow is placed. The high probability trade would be to enter short close to the red dotted upper channel trendline and close on the support level at 9.15202 or there abouts.

Undecision before Norges Bank meetingWeekly:
- Major bullish trend and bullish Ichimoku setup
- Price pulled back to Kijun Sen, but could not stay below.
- Heikin-Ashi candle shows undecision at Kijun Sen. haDelta still below zero, but crossed above SMA3
Daily:
- Trendline and bearish Kumo break, but no follow through! Lot of noise at lower side of Kumo during last 6 days.
- Ichimoku setup shd be considered neutral, maybe with slight bearish bias. Chikou Span is also in past Kumo.
- Heikin-Ashi: haDelta/SMA3 at zero --> neutral. Oscillator green --> bullish bias. Candles --> too much noise, even with this noise filter.
- EWO is still bearish
Oil started some pull back, and that correction itself puts some pressure on NOK and CAD again. However the major factor this week is the rate setting of Norges Bank on 17/March. Market has priced in some cuts. If Norges keeps on hold and/or gives less dovish comments, then EURNOK may break lower.

$EURNOK Wolfe Wave Completion, 1-4 Target LineIn the daily time frame. EURNOK formed a Wolfe Wave. I am a bit late on this one but it is till a nice setup to enter a short and exit at the 1-4 line.

WAITING to go long...that's my way
if the price breaks up the red triangle, could go UP inside the green one
if it breaks down, invalidate my setup
putting an alarm and going surf, pretty good REAL waves around here this week =))

BUY NOW - RSI @ OVERSOLD LEVELLONG TRADE :
Entry : BUY @ 9.3330
Target : 9.7000
Stop : 9.2000
Risk Level : LOW
RR ratio : 1:3

EURNOK SELLNice tops and price turn down. but lower is big trend 9.478 wait and see how price behaves there

#EURNOK: High Probability Move To The Downside Likely! #ForexTraders,
Bearish momentum visible here after we hit some decent technical levels. Really good opportunity to jump in shorts into continuation with a high probability bear move. This could also be part of a longer term down move correction. We could see moves towards the mean price from here, but we will see over time.
---Interested in joining my professional signals group? Message me here on Trading view or email me with the email address on my Trading view profile page---
Best of luck,
Tom

Ready to go?No more comment. The chart and the marks by ellipses tell everything.
In case of break, short term targets are 9,20 and 9,05.
EURNOK - RSI divergence for long tradeThe EURNOK pair is supported by level 9.445. This support combined with the RSI divergence suggests that we may see a bullish phase towards 9.6 then 9.7.
For a long trade, we may either wait for a small retracement towards the support area or directly launch the long. Stop loss would be just below the support area, though beware of wicks and higher spread on such pair.

BUY BUY BUY - LOW RISK TRADELONG TRADE :
Entry : BUY @ 9.4600
Target : 9.7390
Stop : 9.3675
Risk Level : LOW
RR ratio : 1:3

going long if it breaks the down trend linei dont know wtf is EURNOK but for me it looks like its going UP next week, if it breaks the down trend line, of course!
I use only MANUAL S/L if it CLOSES.
the green line is the initial target, i'm just watching this thing to see how it goes the next week
have a nice weekend my friends! i have been busy trading IBOVESPA futures, but next month i will focus more in FOREX
