Did you take advantage of the setup I mentioned?We’ll decide the next move after reaching the top.
Good luck!
EURNZD trade ideas
Is it time to buy?Rising from a significant low, a pullback, and increasing volume can be good signs for a potential buy.
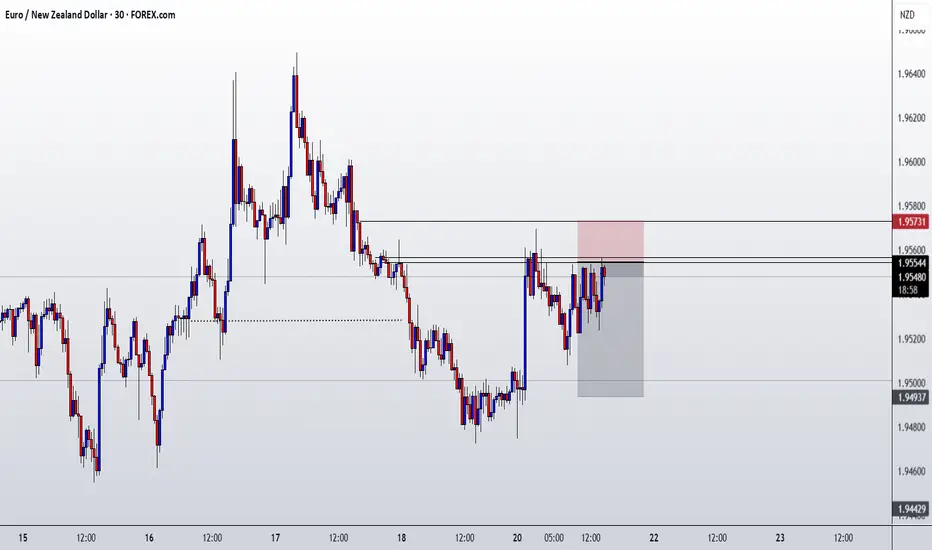
EURNZD SHORT UPDATE ON SHARE ANALYSIS
WE CREATED THE FVG AS PREDICTED
WE GOT A DECENT REACTION
WE CREATED A SMALL CHCOH + FVG ON 5M TF
JUST ENTERED THE POSITION
I am not a financial advisor, and this is not financial advice. The information shared is for educational and informational purposes only and reflects my personal opinion and analysis. Please do your own research and consult with a qualified financial professional before making any trading or investment decisions. Trading involves risk, and you should never invest more than you can afford to lose.

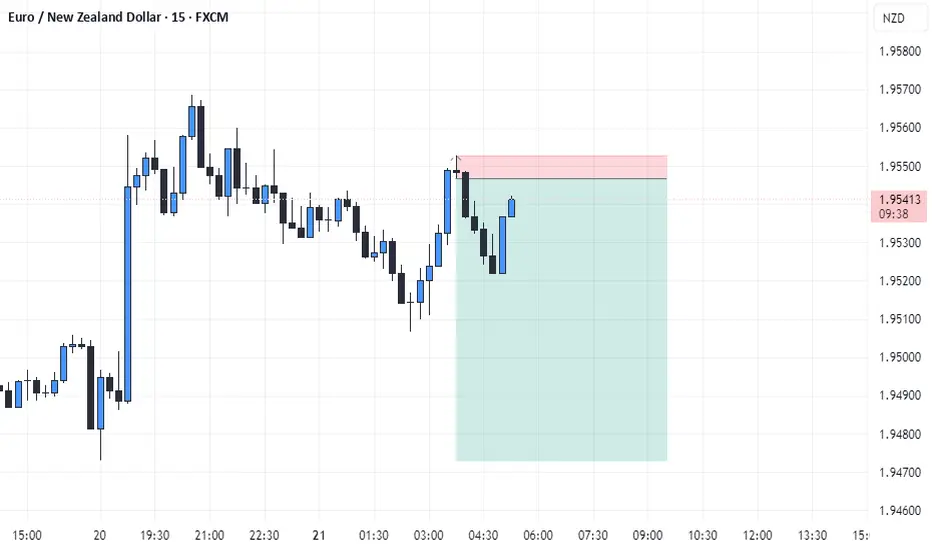
EUR/NZD short scalp opportunityI am looking for a short scalp opportunity on EUR/NZD.
Only if this 1H FVG will form and hold.
I will look for downside momentum to short after a reaction from the 1H FVG
Target = previous day low, but after 2RR you can take partials.
I am not a financial advisor, and this is not financial advice. The information shared is for educational and informational purposes only and reflects my personal opinion and analysis. Please do your own research and consult with a qualified financial professional before making any trading or investment decisions. Trading involves risk, and you should never invest more than you can afford to lose.

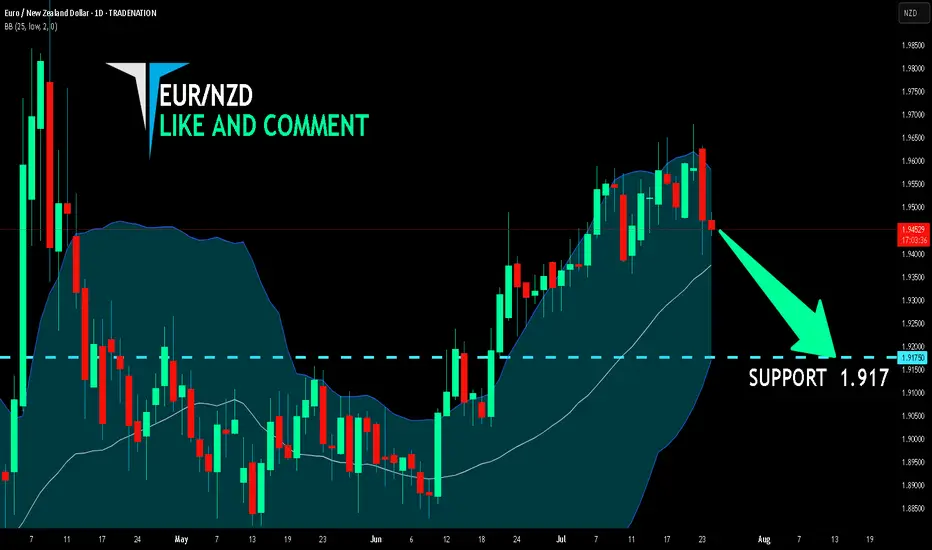
EUR/NZD SENDS CLEAR BEARISH SIGNALS|SHORT
Hello, Friends!
The BB upper band is nearby so EUR-NZD is in the overbought territory. Thus, despite the uptrend on the 1W timeframe I think that we will see a bearish reaction from the resistance line above and a move down towards the target at around 1.917.
Disclosure: I am part of Trade Nation's Influencer program and receive a monthly fee for using their TradingView charts in my analysis.
✅LIKE AND COMMENT MY IDEAS✅

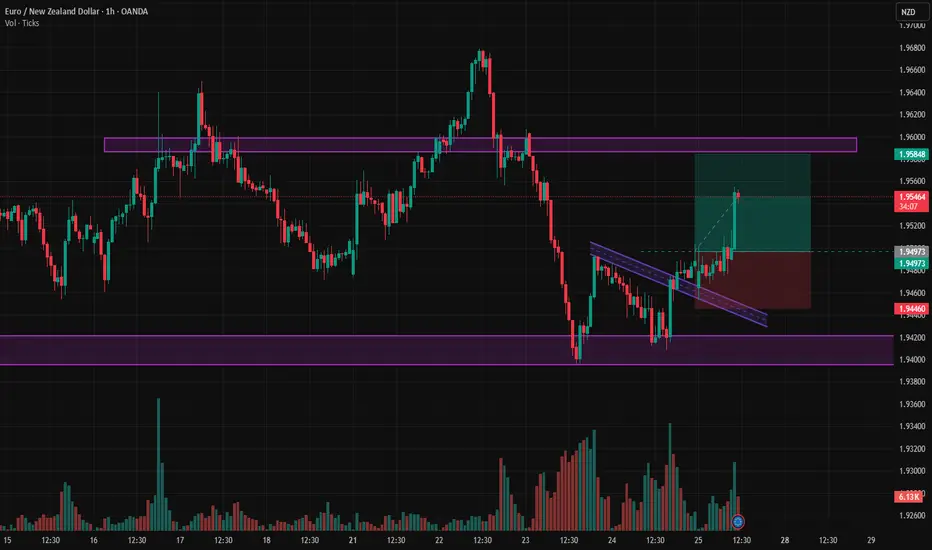
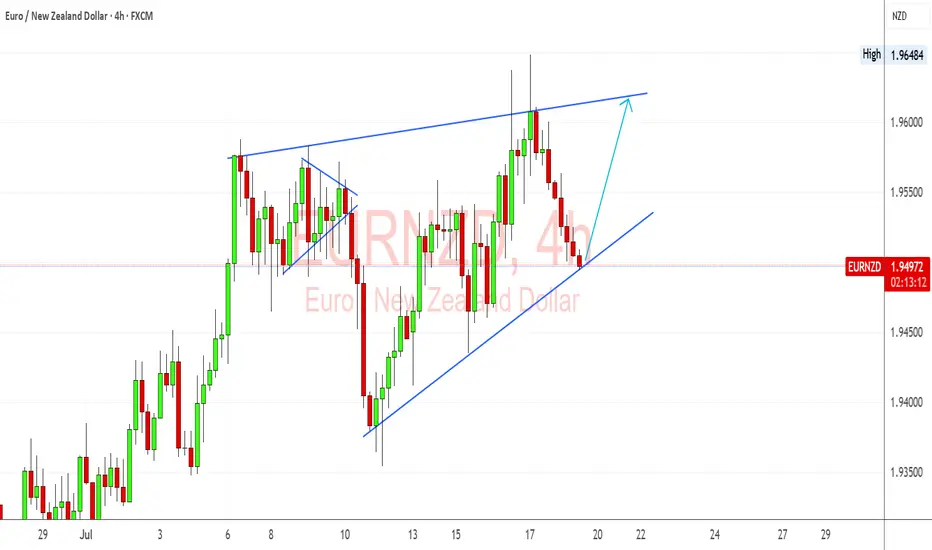
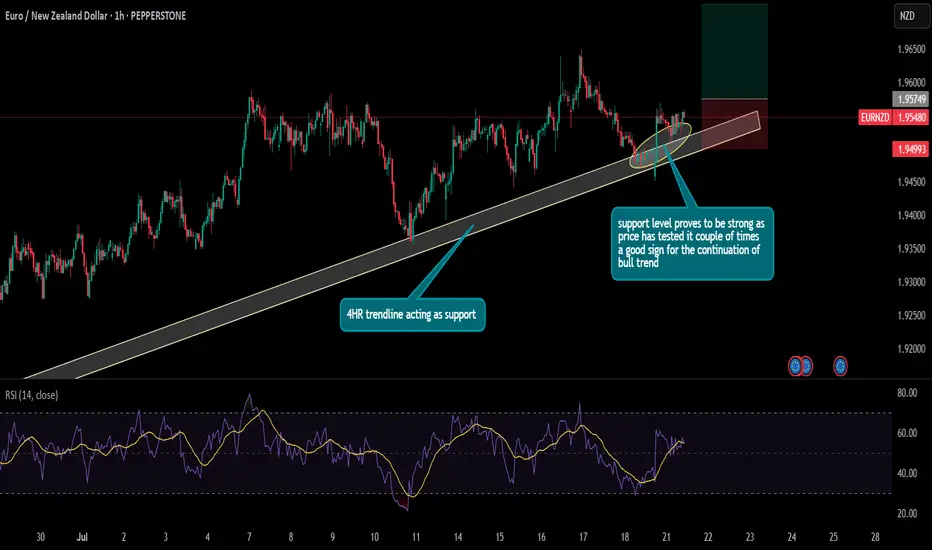
EURNZD Trendline & Hawkish ECB Bias Support Bullish ContinuationEURNZD is holding beautifully above the ascending trendline on the 4H, and I’m watching this level closely for a bounce continuation setup. Fundamentally, the euro remains supported by sticky inflation and hawkish ECB commentary, while the kiwi is showing softness after dovish signals from the RBNZ and mixed jobs data. If this trendline holds, I’ll be targeting a retest of the upper wedge resistance near 1.9640.
🔍 Technical Setup (4H):
Structure: Ascending triangle forming – price is pressing into dynamic support.
Support Zone: Around 1.9480 trendline area – price rejected this level several times in July.
Resistance Target: 1.9640 highs – double top and triangle resistance.
Bullish Confirmation: Rebound with bullish engulfing or strong 4H close above 1.9525 could trigger long setup.
Invalidation: Clean break below trendline and 1.9440 invalidates bullish scenario short-term.
💡 Fundamental Insight:
EUR Drivers:
ECB members remain cautious about declaring victory on inflation.
German and Eurozone CPI data remain above target, supporting higher-for-longer ECB stance.
Speculation that ECB won't cut aggressively compared to RBNZ.
NZD Weakness:
RBNZ minutes show concern over downside inflation risks.
Labor market cooling, and migration pressures remain high.
Commodity and China-linked sentiment weakening NZD.
⚠️ Key Risks:
If Eurozone inflation or PMI data surprises to the downside, EUR may weaken.
RBNZ hawkish pivot or surprise tightening would flip sentiment toward NZD.
Global risk-on could favor NZD as a high-beta currency.
🧭 Summary:
I’m bullish on EURNZD as long as price holds above the trendline near 1.9480. The technical structure shows a clean ascending pattern, and the fundamentals currently favor EUR strength over NZD. My eyes are on a potential move toward 1.9640, especially if upcoming ECB rhetoric stays hawkish. EURNZD tends to lead NZD-crosses like NZDJPY or NZDCHF in risk-off regimes and could signal euro strength if it breaks out. Watching closely for price action confirmation.
EURNZD: Bulls Will Push Higher
Our strategy, polished by years of trial and error has helped us identify what seems to be a great trading opportunity and we are here to share it with you as the time is ripe for us to buy EURNZD.
Disclosure: I am part of Trade Nation's Influencer program and receive a monthly fee for using their TradingView charts in my analysis.
❤️ Please, support our work with like & comment! ❤️

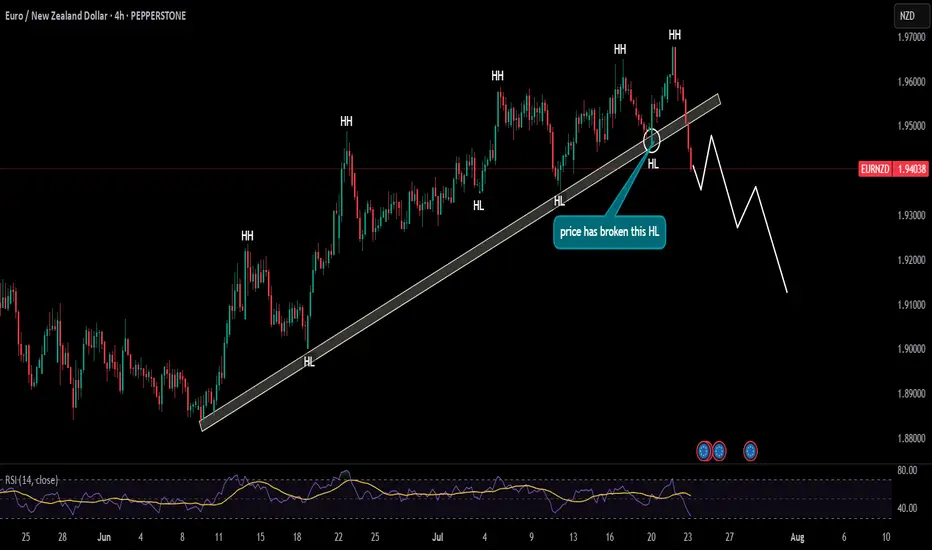
EURNZD giving early signs of reversal of trend!!!as it can be seen that price has broken the bullish trendline with strong momentum, and along with that, it has also broken its last HL these confluences indicate a trend reversal from bullish to reversal. For more confirmation of bearish trend let the price make pullback either to make its first LH and then look for sell setups
EUR / NZD - Buy on H1Buy EUR / NZD at Current Market Price on H1.
Entry Price : 1.95746
Stop Loss : 1.94668
TP1 : 1:1
TP2 : 1:2
Confluences for the trade are as follows:
- Price is an upward Channel
- No Divergence Detected
- Price is retracing and is at the 0.5 to 0.618 level after breaking the last higher high

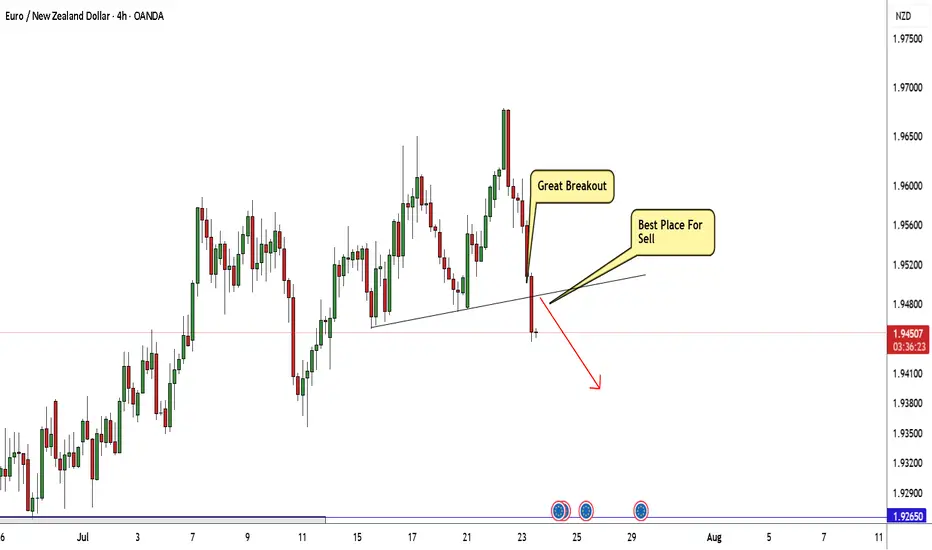
EUR/NZD Breakout Done , Short Setup Valid To Get 150 Pips !This Pair moved to upside very hard last 2 weeks and now the time to go down again , we have a very good closure below my C.T.L , And we have a confirmation with a very good 4h Candle so we can wait the price to go up a little to retest the broken area and we can enter a sell trade .
Eurnzd buy againEurnzd i gave on the 20th July took profits now pulled back and ready to r3buy back in at 1.95940 looking to take profits at 1.96683

Short eurnzd Sell eurnzd if lower trend line of the rising wedge is broken. I'm expecting Gbpnzd to follow similar pattern

EURNZD: Bullish Confluence Aligns for Buy Setups at Key ArraysGreetings Traders,
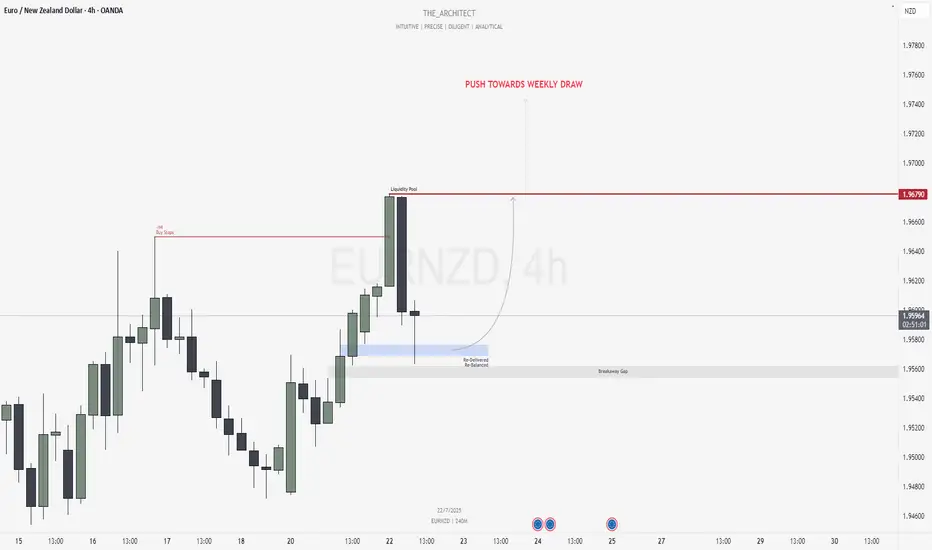
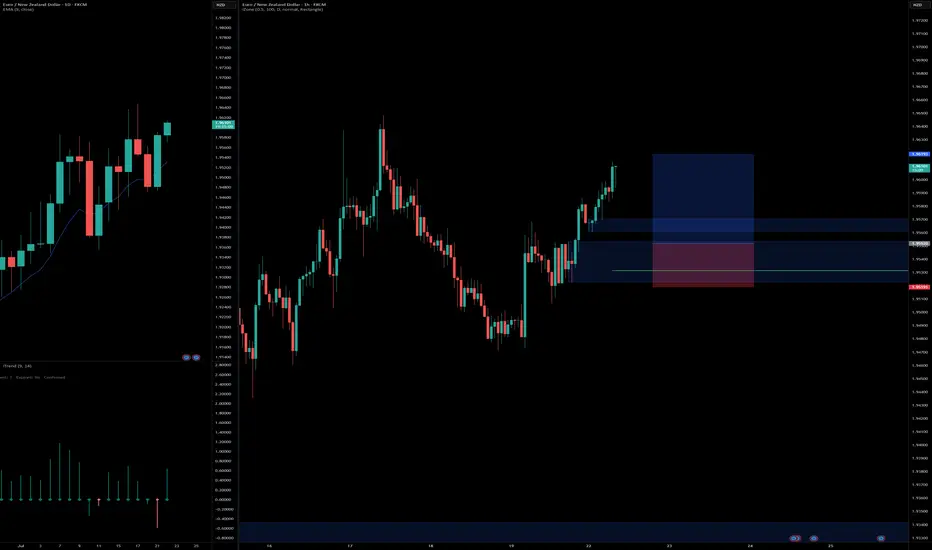
In today’s analysis of EURNZD, we identify that the current institutional order flow is bullish. With this bias in mind, we aim to capitalize on high-probability buying opportunities from key points of interest aligned with institutional behavior.
Higher Timeframe Context:
The weekly timeframe is showing a clear bullish narrative. This bullish order flow is confirmed by the H4 timeframe, which is also delivering higher highs and higher lows—providing confluence between both the macro and intermediate timeframes. This alignment increases our confidence in seeking long setups.
Key Observations on H4:
Buy-Side Liquidity Sweep: Price recently took out H4 buy stops, which triggered a retracement into internal range price action.
Re-Delivered Re-Balanced Zone (RDRB): Price has now pulled back into a re-delivered, re-balanced array—a significant institutional level that typically offers low-risk buy setups. Given the nature of this zone, we do not anticipate a deeper pullback into the fair value gap (FVG), thereby treating it as a potential breakaway gap.
Draw on Liquidity: The next probable target is the external liquidity pool resting in premium prices. The market appears poised to gravitate towards that area.
Trading Plan:
Entry Strategy: Monitor the lower timeframes for bullish confirmations within the RDRB array.
Targets: The primary target is the engineered liquidity pool in premium prices.
For a detailed analysis, please watch this weeks Forex Outlook:https://www.tradingview.com/chart/EURNZD/BZC9xW1L-July-21-Forex-Outlook-Don-t-Miss-These-High-Reward-Setups/
Remain patient, trust the structure, and execute with precision as the bullish narrative unfolds.
Kind Regards,
The Architect 🏛️📈
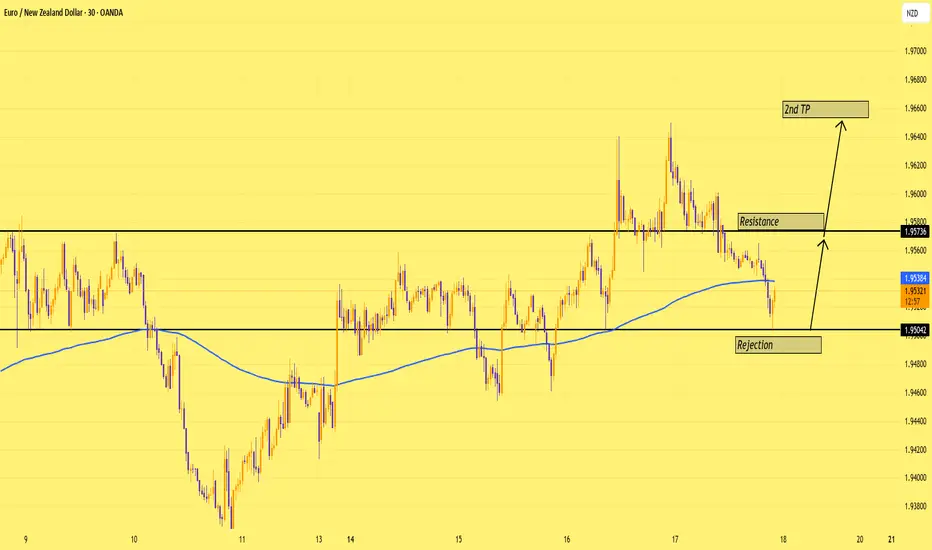
EURNZD: The Bounce Play Nobody’s WatchingWe just got a clean rejection at 1.9504—same zone price respected 3x before. If bulls step in here, next stop might be resistance at 1.9573. 1.9650 is the 2nd TP
Simple range, clean bounce setup. Let’s see if it delivers.
eurnzd sell signal. Don't forget about stop-loss.
Write in the comments all your questions and instruments analysis of which you want to see.
Friends, push the like button, write a comment, and share with your mates - that would be the best THANK YOU.
P.S. I personally will open entry if the price will show it according to my strategy.
Always make your analysis before a trade

EURNZD long setupBuying from fresh demand zone after bullish structure break.
Daily showing strong momentum, 1H confirms continuation with clean break and retest zone.
📍Entry: Demand zone
🎯 Target: 2R
🛑 SL: Below demand zone
Risk-Reward: Favorable setup aligning with higher timeframe bias.
#trading #forextrading #EURNZD #priceaction #smartmoney #demandzone #tradingsetup #forexanalysis
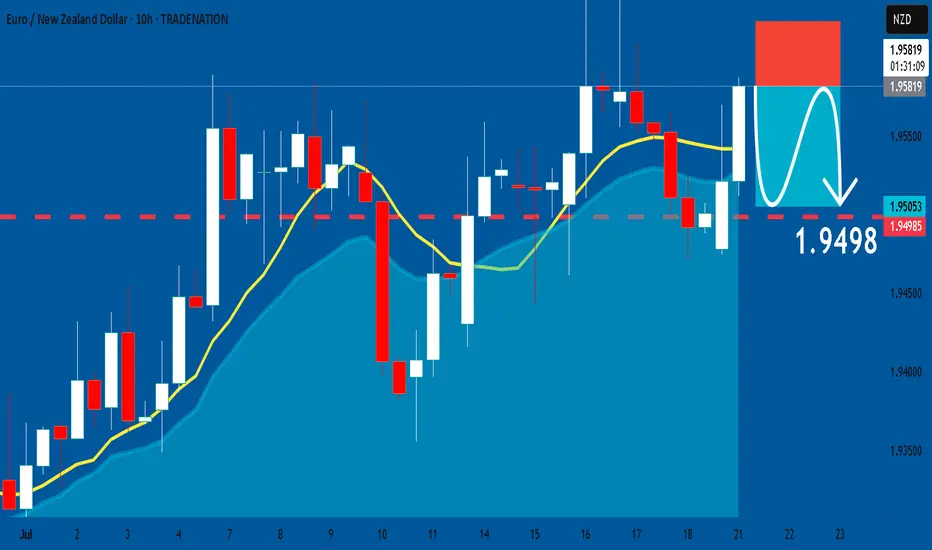
EURNZD: Short Signal with Entry/SL/TP
EURNZD
- Classic bearish formation
- Our team expects pullback
SUGGESTED TRADE:
Swing Trade
Short EURNZD
Entry - 1.9581
Sl - 1.9622
Tp - 1.9498
Our Risk - 1%
Start protection of your profits from lower levels
Disclosure: I am part of Trade Nation's Influencer program and receive a monthly fee for using their TradingView charts in my analysis.
❤️ Please, support our work with like & comment! ❤️
EURNZD continues to be in bullish trend as shown in the chart, the 4-hour tf trendline is acting as a strong support level since the price has tested it multiple times to continue the bullish trend therefore a buy trade idea has been given on the chart according to the price action
EURNZD ENTRY CHARTOn this Pair, we are BEARISH, the Trend is still BEARISH, the NEW ZEALAND DOLLAR is beginning to gain STRENGTH, the DAILY open gave us a Confluence with the H4 tf giving us a SELL FORMATION, on the H1, we got our Structure area, with a LTF entry confirmation + Inducement, So if this matches with your Trade Idea, you can look to join US, and Apply a Good risk Management.We will give Update in the UPDATE SECTION THANK YOU.
EURNZD Will Go Lower From Resistance! Sell!
Take a look at our analysis for EURNZD.
Time Frame: 15m
Current Trend: Bearish
Sentiment: Overbought (based on 7-period RSI)
Forecast: Bearish
The market is on a crucial zone of supply 1.945.
The above-mentioned technicals clearly indicate the dominance of sellers on the market. I recommend shorting the instrument, aiming at 1.943 level.
P.S
Overbought describes a period of time where there has been a significant and consistent upward move in price over a period of time without much pullback.
Disclosure: I am part of Trade Nation's Influencer program and receive a monthly fee for using their TradingView charts in my analysis.
Like and subscribe and comment my ideas if you enjoy them!

July 21, Forex Outlook : Don’t Miss These High-Reward Setups!Welcome back, traders!
In today’s video, we’ll be conducting a Forex Weekly Outlook, analyzing multiple currency pairs from a top-down perspective—starting from the higher timeframes and working our way down to the lower timeframes.
Pairs to focus on this Week:
EURUSD
USDJPY
AUDJPY
CADJPY
EURJPY
GBPCHF
USDCHF
NZDCHF
EURNZD
Our focus will be on identifying high-probability price action scenarios using clear market structure, institutional order flow, and key confirmation levels. This detailed breakdown is designed to give you a strategic edge and help you navigate this week’s trading opportunities with confidence.
📊 What to Expect in This Video:
1. Higher timeframe trend analysis
2. Key zones of interest and potential setups
3. High-precision confirmations on lower timeframes
4. Institutional insight into where price is likely to go next
Stay tuned, take notes, and be sure to like, comment, and subscribe so you don’t miss future trading insights!
Have a great week ahead, God bless you!
The Architect 🏛️📉

eurnzdeurnzd short idead.
please use sl for this idea.
sell to target. write something fot short description, i hope its to be usefull