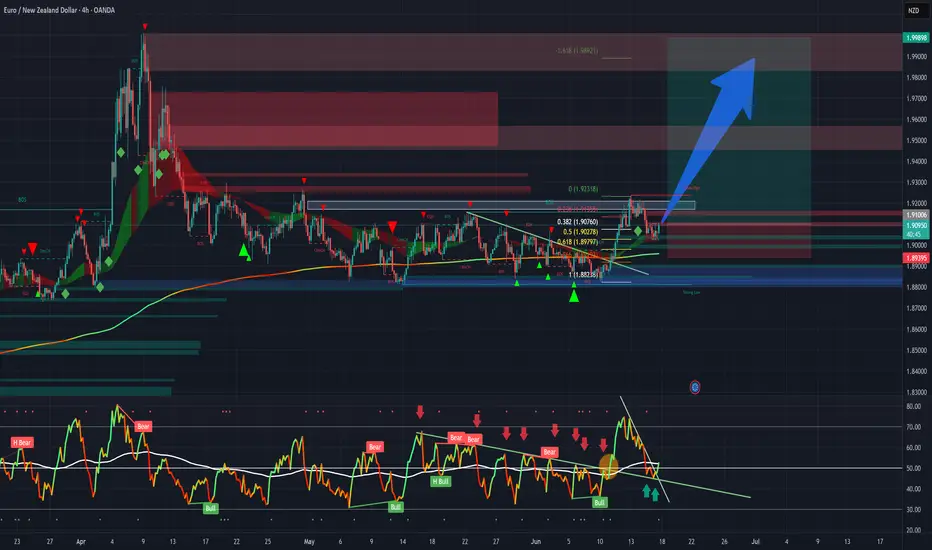
EURNZD Buy signal Area of Interest
pros
Bullish Daily structure + 4H
-50% Fib level
-possible support level
cons
- Price is rejecting Daily key resistance
- Price had already moved significantly and didn't show clear structure
For entry
limit order at 61.8% fib level
or wait to see bullish price action
e.g price rejecting 50 ema and support level
momentum loss as price created smaller candles
Bullish engulfing candles form to show buying presence.
EURNZD trade ideas

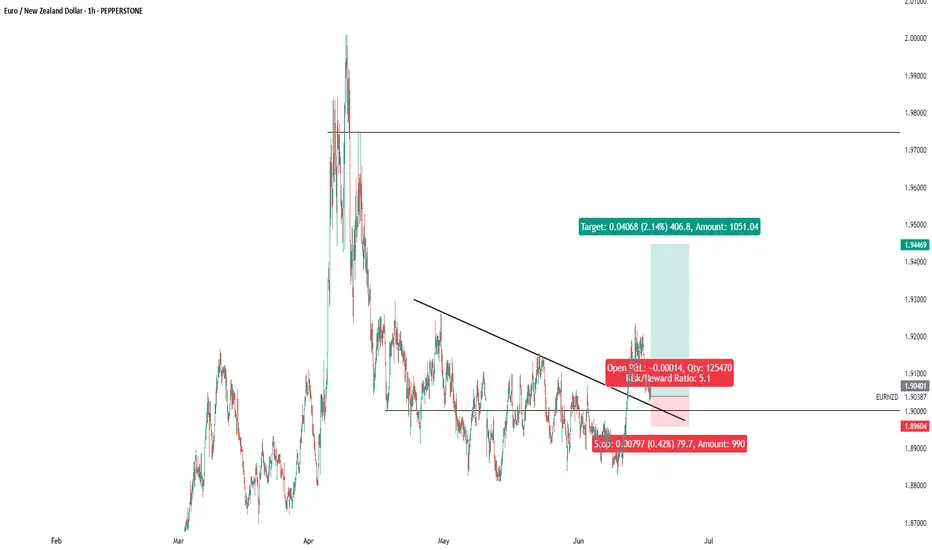
EURNZD Breakout Incoming? Watch This Zone Closely!The Euro has broken out of a long-standing bearish trendline, signaling a potential shift in momentum.
🔍 Key Levels to Watch:
Resistance: 2.0000 (psychological & technical level)
Support: 1.9042
Current Price: 1.9202
What I'm Seeing:
Price has broken the descending trendline and is consolidating above support.
A successful retest of the 1.9042 support zone could trigger a bullish wave toward 2.0000.
Two scenarios to watch:
Aggressive move: Price continues upwards from current consolidation.
Retest play: Price pulls back to support, forms a higher low, and then launches.
📊 Trade Idea (Not Financial Advice):
Buy zone: 1.9050–1.9100 (upon confirmation)
Target: 2.0000
Invalidation: Clean break below 1.9000
Momentum is building, and a rally toward 2.0000 could be on the horizon. Patience is key — wait for confirmation.
What are your thoughts on EUR/NZD? Bullish or bearish?

EUR-NZD Will Go Down! Sell!
Hello,Traders!
EUR-NZD made a retest
Of the horizontal resistance
Level of 1.9100 and made a
Nice pullback so we are bearish
Biased and we will be expecting
A further bearish move down
Sell!
Comment and subscribe to help us grow!
Check out other forecasts below too!
Disclosure: I am part of Trade Nation's Influencer program and receive a monthly fee for using their TradingView charts in my analysis.


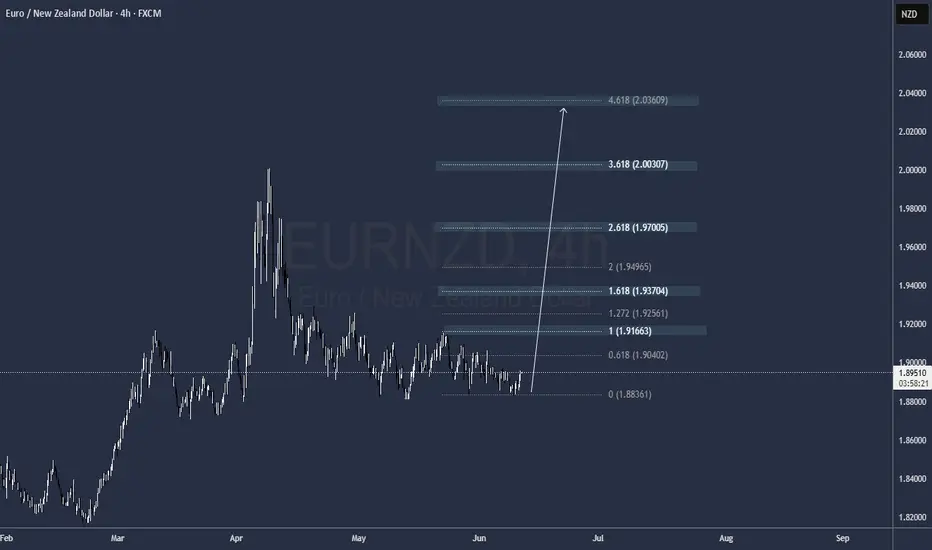
EURNZD Trend IdeaDaily time frame broke the descending channel, giving a possibility of bullish trend formation.
Awaiting for Retesting the AOI @ 1.9000 Psychological level with a bullish confirmation candlestick/pattern in order to take long, target @1.9500

eurnzd buy signal. Don't forget about stop-loss.
Write in the comments all your questions and instruments analysis of which you want to see.
Friends, push the like button, write a comment, and share with your mates - that would be the best THANK YOU.
P.S. I personally will open entry if the price will show it according to my strategy.
Always make your analysis before a trade
EURNZD Massive Short! SELL!
My dear subscribers,
EURNZD looks like it will make a good move, and here are the details:
The market is trading on 1.9194 pivot level.
Bias - Bearish
My Stop Loss - 1.9246
Technical Indicators: Both Super Trend & Pivot HL indicate a highly probable Bearish continuation.
Target - 1.9095
About Used Indicators:
The average true range (ATR) plays an important role in 'Supertrend' as the indicator uses ATR to calculate its value. The ATR indicator signals the degree of price volatility.
Disclosure: I am part of Trade Nation's Influencer program and receive a monthly fee for using their TradingView charts in my analysis.
———————————
WISH YOU ALL LUCK

EURNZD: Short Trading Opportunity
EURNZD
- Classic bearish setup
- Our team expects bearish continuation
SUGGESTED TRADE:
Swing Trade
Short EURNZD
Entry Point - 1.9088
Stop Loss - 1.9138
Take Profit - 1.8982
Our Risk - 1%
Start protection of your profits from lower levels
Disclosure: I am part of Trade Nation's Influencer program and receive a monthly fee for using their TradingView charts in my analysis.
❤️ Please, support our work with like & comment! ❤️

EURNZD Break & Retest of Double Bottom Neckline (BUY)(WEEKLY) - Price is in Strong Uptrend.
(WEEKLY) - Price formed Double Bottom Equal Lows at ( 1.88915 - 1.88078).
(WEEKLY) - Weekly Breakout Candle Closing above DB Neckline at (1.91570 - 1.91145).
(DAILY) - Double Bottom Neckline at (1.91570 - 1.91145).
(4H) - Price is forming rising higher lows inside DB Neckline.
Trade Management.
Stop loss - 1.91145
Take Profit - Previous Swing High at 1.95791.

EUR/NZD – Favoring the Sell Side on Euro Weakness
This week, EUR/NZD is fundamentally tilted toward the sell side. The eurozone features ZEW economic sentiment data and a speech from the Bundesbank president—events that could underscore ongoing economic weakness in Europe. Meanwhile, the New Zealand economic docket only includes sentiment and current account data, unlikely to produce major surprises.
If European data underwhelms or the Bundesbank takes a dovish tone, EUR is likely to remain soft. With the New Zealand dollar's fundamental backdrop stable and little in the way of local risk, the relative balance of scheduled events suggests downside potential for EUR/NZD.
**In summary:**
Macro and news-based factors both point to EUR/NZD favoring a sell bias this week, as the EUR faces more event-driven downside risk and NZD remains steady.

EUR/NZD Bullish Continuation Given this macro backdrop, EUR-crosses—especially EUR/NZD—are benefiting from increased upward pressure. Here's how I’m viewing the current market structure:
Key Technical Outlook:
📍 Scenario 1 – Intraday Momentum Entry:
Watch how the market opens and closes on Monday. If price respects current support and shows bullish intent on the lower timeframes (e.g., 1H or 15M), that could be an ideal entry point to ride the continuation of this bullish trend.
📍 Scenario 2 – Breakout & Retest Entry:
A more conservative but higher-probability setup involves waiting for a clear breakout above the major resistance level (marked by a red horizontal line on my chart). Once broken, monitor for a pullback and look to enter on the retest with a proper risk management strategy.

EUR-NZD Potential Short! Sell!
Hello,Traders!
EUR-NZD is going up
Just as we predicted but
The pair will soon hit a
Horizontal resistance
Of 1.9287 from where
We will be expecting a
Local pullback and a
Move down
Sell!
Comment and subscribe to help us grow!
Check out other forecasts below too!
Disclosure: I am part of Trade Nation's Influencer program and receive a monthly fee for using their TradingView charts in my analysis.

EURNZD: Short Signal with Entry/SL/TP
EURNZD
- Classic bearish formation
- Our team expects pullback
SUGGESTED TRADE:
Swing Trade
Short EURNZD
Entry - 1.9145
Sl - 1.9218
Tp - 1.9021
Our Risk - 1%
Start protection of your profits from lower levels
Disclosure: I am part of Trade Nation's Influencer program and receive a monthly fee for using their TradingView charts in my analysis.
❤️ Please, support our work with like & comment! ❤️

EUR/NZD BEARS ARE STRONG HERE|SHORT
EUR/NZD SIGNAL
Trade Direction: short
Entry Level: 1.914
Target Level: 1.903
Stop Loss: 1.921
RISK PROFILE
Risk level: medium
Suggested risk: 1%
Timeframe: 1h
Disclosure: I am part of Trade Nation's Influencer program and receive a monthly fee for using their TradingView charts in my analysis.
✅LIKE AND COMMENT MY IDEAS✅

EURNZD POTENTIAL BUY OPPORTUNITYEURNZD trading back into previous market structure. Expecting it to target internal highs

EURNZD SWING BUYtrend following trade to hold for a few weeks
Targets Highlighted
SL below last low
gg
eurnzd buy signal. Don't forget about stop-loss.
Write in the comments all your questions and instruments analysis of which you want to see.
Friends, push the like button, write a comment, and share with your mates - that would be the best THANK YOU.
P.S. I personally will open entry if the price will show it according to my strategy.
Always make your analysis before a trade

EUR_NZD WILL GO UP|LONG|
✅EUR_NZD fell down sharply
But a strong support level was hit at 1.8820
Thus as a rebound is already happening
A move up towards the target of 1.8923 shall follow
LONG🚀
✅Like and subscribe to never miss a new idea!✅
Disclosure: I am part of Trade Nation's Influencer program and receive a monthly fee for using their TradingView charts in my analysis.

EURNZD: Long Signal Explained
EURNZD
- Classic bullish formation
- Our team expects growth
SUGGESTED TRADE:
Swing Trade
Buy EURNZD
Entry Level - 1.8863
Sl - 1.8820
Tp - 1.8953
Our Risk - 1%
Start protection of your profits from lower levels
Disclosure: I am part of Trade Nation's Influencer program and receive a monthly fee for using their TradingView charts in my analysis.
❤️ Please, support our work with like & comment! ❤️

EURNZD Long From SupportHello Traders
In This Chart EURNZD 4 HOURLY Forex Forecast By FOREX PLANET
today EURNZD analysis 👆
🟢This Chart includes EURNZD market update)
🟢What is The Next Opportunity on EURNZD Market
🟢how to Enter to the Valid Entry With Assurance Profit
This CHART is For Trader's that Want to Improve Their Technical Analysis Skills and Their Trading By Understanding How To Analyze The Market Using Multiple Timeframes and Understanding The Bigger Picture on the Charts

EURNZD will bounce higherYesterday's daily candle closed with very long wick hint for buyer in control in my opinion.
today strategy:-
Wait at 1.89000~1.89150 zone for any reaction.
buy entry if have bullish price action in the lower timeframe.
good luck.
calculate your own risk & reward.
