euraud buy signal. Don't forget about stop-loss.
Write in the comments all your questions and instruments analysis of which you want to see.
Friends, push the like button, write a comment, and share with your mates - that would be the best THANK YOU.
P.S. I personally will open entry if the price will show it according to my strategy.
Always make your analysis before a trade
EURNZD trade ideas

eurnzd buy signal. Don't forget about stop-loss.
Write in the comments all your questions and instruments analysis of which you want to see.
Friends, push the like button, write a comment, and share with your mates - that would be the best THANK YOU.
P.S. I personally will open entry if the price will show it according to my strategy.
Always make your analysis before a trade

RESISTANCE RETESTED.i think the market might respect the resistance and dip down to the 1.81307 level at least, or retest the uptrendline.

EURNZD H2 Best Level to SHORT/HOLD +100/+200 pips🏆 EURNZD Market Update H2 chart
📊 Technical Outlook
🔸trading in well defined range
🔸trading mid range now
🔸range highs set at 9150
🔸range lows set at 8850
🔸strategy: SHORT SELL from resistance
🔸SL 40 pips TP1 +100 pips TP2 +200 pips
🔸swing trade setup for patient traders
📊Forex Market Update (June 3, 2025)
🇪🇺EUR/USD
📉Price:\~1.1410
Euro holds steady near 1.14 amid stable ECB policy and improving German sentiment. However, a drop in eurozone CPI to 2.0% from 2.2% may exert downward pressure
🔑Key Levels Support 1.1365|Resistance 1.1445
🇬🇧GBP/USD
📈Price:\~1.3530
Pound reaches a three-year high, trading around 1.3530, supported by a modest upward revision to May’s UK manufacturing PMI. Lack of UK economic data leaves Sterling influenced by global trends.
🔑Key Levels\:Support 1.3450|Resistance 1.3560
🇺🇸DXY (US Dollar Index)
📉Price:\~98.79
US dollar index falls to a six-week low amid persistent trade tensions and weak US manufacturing data for May. Investors await upcoming US nonfarm payrolls data, which could influence the Federal Reserve’s monetary stance.
🔑Key Levels\:Support 98.00|Resistance 100.00.00

EURNZDHello Traders! 👋
What are your thoughts on EURNZD?
The EURNZD pair is currently trading below a key resistance zone, showing signs of hesitation near this level.
We expect the price to consolidate briefly within this area, and then decline toward the specified support level if the resistance holds.
As long as the pair remains below resistance, the bearish bias remains intact, and a move lower is likely.
Don’t forget to like and share your thoughts in the comments! ❤️

EURNZD SELL/SHORTBy utilizing levels, historical patterns, , we can formulate a hypothesis that the market might follow a similar trajectory if bearish sentiment prevails.

EURNZD new bearish expected
OANDA:EURNZD in last period price is have upside-downsides moves, price is make again bounce on strong zone (1.91000), yesterday we are have and RBNZ, how looks from here we wil lcan expect higher bearish trend.
SUP zone: 1.91000
RES zone: 1.85000, 1.83500

EURNZD buy signal. Don't forget about stop-loss.
Write in the comments all your questions and instruments analysis of which you want to see.
Friends, push the like button, write a comment, and share with your mates - that would be the best THANK YOU.
P.S. I personally will open entry if the price will show it according to my strategy.
Always make your analysis before a trade

EURNZD: BUY IDEAThis satisfy all the elements of my trade system, I'm buying because I'll like see price push higher. A break of structure to the upside and an engineered liquidity before price broke structure. Price has returned to grab liquidity, we should see it push to our target.

EURNZD:RBNZ Rate Cut Sparks Volatility in NZDEURNZD: RBNZ Rate Cut Sparks Volatility in NZD
Today, the Reserve Bank of New Zealand (RBNZ) lowered interest rates by 25 basis points to 3.25%, down from 3.5% last month.
Initially, the New Zealand dollar (NZD) showed weakness, but the sentiment quickly shifted as the rate cut was accompanied by a surprisingly hawkish statement during the RBNZ Press Conference.
As a result, EURNZD plummeted by nearly 180 pips during the press conference, reaching a low of 1.8920.
This level triggered profit-taking, leading to a corrective move that retraced exactly 50% of the initial decline from 1.9100 to 1.8920.
Looking ahead, EURNZD may be poised for another bearish wave around this zone following a brief consolidation.
Targets:
🎯 1.8920 🎯 1.8850
You may find more details in the chart!
Thank you and Good Luck!
❤️PS: Please support with a like or comment if you find this analysis useful for your trading day❤️
Disclosure: I am part of Trade Nation's Influencer program and receive a monthly fee for using their TradingView charts in my analysis.

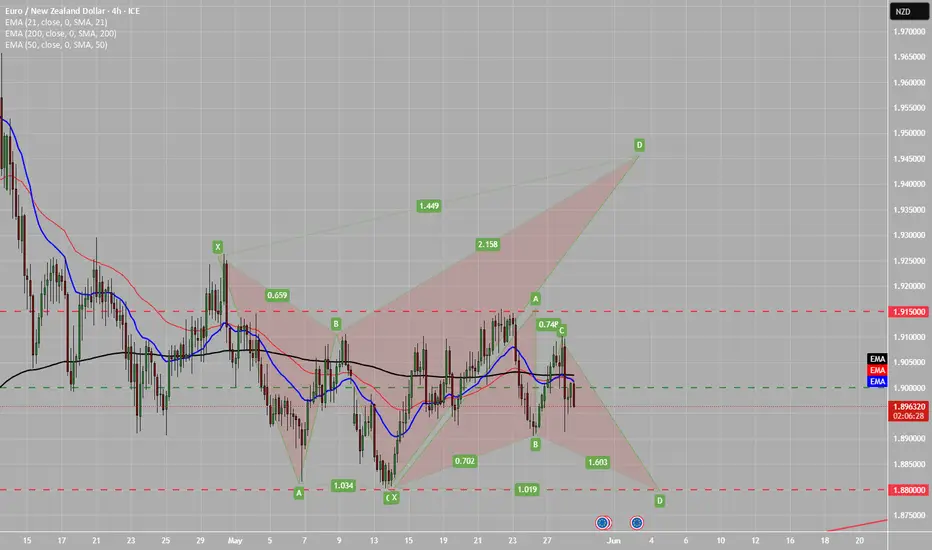
EZ HARMONIC C-D LEGSwe could see a move down before looking for the HH. Waiting on this one to see how it plays out.
EURNZD Set To Grow! BUY!
My dear subscribers,
EURNZD looks like it will make a good move, and here are the details:
The market is trading on 1.8983 pivot level.
Bias - Bullish
Technical Indicators: Both Super Trend & Pivot HL indicate a highly probable Bullish continuation.
Target - 1.9022
About Used Indicators:
The average true range (ATR) plays an important role in 'Supertrend' as the indicator uses ATR to calculate its value. The ATR indicator signals the degree of price volatility.
Disclosure: I am part of Trade Nation's Influencer program and receive a monthly fee for using their TradingView charts in my analysis.
———————————
WISH YOU ALL LUCK

EURNZD: Double Confluence with Fibonacci and Head & Shoulders
EURNZD shows a potential bearish reversal setup after hitting the resistance zone at 1.9100 . The price has rejected from the 0.786 Fibonacci retracement level , aligning closely with the psychological resistance at 1.9100 — forming a double confluence.
A potential short-term retracement is expected toward the 1.88300 zone, which is projected by the 1.618 Fibonacci extension and acts as a round figure support level .
🟩 Key Levels:
- Resistance: 1.9100 (also recent swing high)
- Expected Target: 1.88300
- Invalidation Above: A clean breakout and close above 1.9100
---------------------
📍 4H Chart Analysis
A Head and Shoulders pattern is clearly forming on the 4H timeframe. The price is currently testing the neckline zone , and if a breakdown occurs, it may confirm a deeper bearish movement , adding higher timeframe support to the bearish idea.
This structure further strengthens the bias that the recent bullish retracement might have ended, and the next leg could be downward toward the expected zone.
The confluence of Fibonacci levels on the 1H chart and the bearish Head & Shoulders formation on the 4H chart suggests that bears might take control below 1.9100 . As long as the price stays under this key resistance, the bearish outlook remains valid, targeting 1.88300.

EURNZD My Opinion! BUY!
My dear followers,
I analysed this chart on EURNZD and concluded the following:
The market is trading on 1.8990 pivot level.
Bias - Bullish
Technical Indicators: Both Super Trend & Pivot HL indicate a highly probable Bullish continuation.
Target - 1.9043
About Used Indicators:
A super-trend indicator is plotted on either above or below the closing price to signal a buy or sell. The indicator changes color, based on whether or not you should be buying. If the super-trend indicator moves below the closing price, the indicator turns green, and it signals an entry point or points to buy.
Disclosure: I am part of Trade Nation's Influencer program and receive a monthly fee for using their TradingView charts in my analysis.
———————————
WISH YOU ALL LUCK

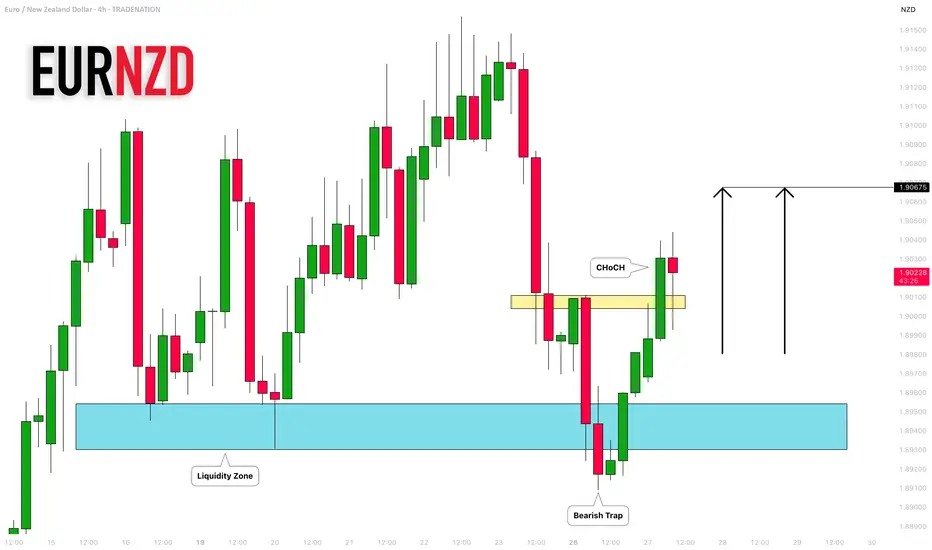
EURNZD: False Breakout & Bullish Movement 🇪🇺🇳🇿
I think that EURNZD may rise today after
a confirmed bearish trap and a bullish CHoCH.
Next resistance - 1.90675
❤️Please, support my work with like, thank you!❤️
I am part of Trade Nation's Influencer program and receive a monthly fee for using their TradingView charts in my analysis.
EURNZD: Bulls Will Push Higher
Looking at the chart of EURNZD right now we are seeing some interesting price action on the lower timeframes. Thus a local move up seems to be quite likely.
Disclosure: I am part of Trade Nation's Influencer program and receive a monthly fee for using their TradingView charts in my analysis.
❤️ Please, support our work with like & comment! ❤️

eurnzd buy signal. Don't forget about stop-loss.
Write in the comments all your questions and instruments analysis of which you want to see.
Friends, push the like button, write a comment, and share with your mates - that would be the best THANK YOU.
P.S. I personally will open entry if the price will show it according to my strategy.
Always make your analysis before a trade

EURNZD (BOS + DEMAND + 705 FIB LEVEL)Hello traders!
Description: Now we already in demand + check RSI)))
Entry: Confirmation on LTF in POI
Target: TILL problem zone.
P.S: check also previous idea.
Have a profitable day and don't forget to subscribe for more updates!
If you like this idea drop a like, leave a comment.

EURNZD BUYEURNZD price will rally from this support back to the recently created high. Two patterns can be seen on this chart; a double bottom and a bullish flag. The double bottom has broken out the neckline and retested. The same neckline serves as the broken resistance of the bullish flag.

EUR_NZD LOCAL LONG|
✅EUR_NZD is going down now
But a strong support level is ahead at 1.8940
Thus I am expecting a rebound
And a move up towards the target of 1.9022
LONG🚀
✅Like and subscribe to never miss a new idea!✅
Disclosure: I am part of Trade Nation's Influencer program and receive a monthly fee for using their TradingView charts in my analysis.

EURNZD Will Fall! Short!
Take a look at our analysis for EURNZD.
Time Frame: 8h
Current Trend: Bearish
Sentiment: Overbought (based on 7-period RSI)
Forecast: Bearish
The market is on a crucial zone of supply 1.899.
The above-mentioned technicals clearly indicate the dominance of sellers on the market. I recommend shorting the instrument, aiming at 1.880 level.
P.S
Overbought describes a period of time where there has been a significant and consistent upward move in price over a period of time without much pullback.
Disclosure: I am part of Trade Nation's Influencer program and receive a monthly fee for using their TradingView charts in my analysis.
Like and subscribe and comment my ideas if you enjoy them!

EUR/NZD "Euro vs Kiwi" Forex Bank Heist Plan (Scalping/Day)🌟Hi! Hola! Ola! Bonjour! Hallo! Marhaba!🌟
Dear Money Makers & Robbers, 🤑💰✈️
Based on 🔥Thief Trading style technical and fundamental analysis🔥, here is our master plan to heist the EUR/NZD "Euro vs Kiwi" Forex Market. Please adhere to the strategy I've outlined in the chart, which emphasizes short entry. Our aim is the high-risk Pink Zone. Risky level, oversold market, consolidation, trend reversal, trap at the level where traders and bullish robbers are stronger. 🏆💸"Take profit and treat yourself, traders. You deserve it!💪🏆🎉
Entry 📈 : "The heist is on! Wait for the Major Support breakout then make your move at (1.89500) - Bearish profits await!"
however I advise to Place sell stop orders above the Moving average (or) after the Support level Place sell limit orders within a 15 or 30 minute timeframe most NEAREST (or) SWING low or high level for Pullback entries.
📌I strongly advise you to set an "alert (Alarm)" on your chart so you can see when the breakout entry occurs.
Stop Loss 🛑: "🔊 Yo, listen up! 🗣️ If you're lookin' to get in on a sell stop order, don't even think about settin' that stop loss till after the breakout 🚀. You feel me? Now, if you're smart, you'll place that stop loss where I told you to 📍, but if you're a rebel, you can put it wherever you like 🤪 - just don't say I didn't warn you ⚠️. You're playin' with fire 🔥, and it's your risk, not mine 👊."
📌Thief SL placed at the nearest/swing High or Low level Using the 4H timeframe (1.91300) Day/Scalping trade basis.
📌SL is based on your risk of the trade, lot size and how many multiple orders you have to take.
Target 🎯: 1.87800 (or) Escape Before the Target
💰💵💸EUR/NZD "Euro vs Kiwi" Forex Market Heist Plan (Scalping/Day Trade) is currently experiencing a Bearish trend.., driven by several key factors.👇👇👇
📰🗞️Get & Read the Fundamental, Macro, COT Report, Quantitative Analysis, Sentimental Outlook, Intermarket Analysis, Future trend targets with Overall outlook score... go ahead to check 👉👉👉🔗🔗
⚠️Trading Alert : News Releases and Position Management 📰 🗞️ 🚫🚏
As a reminder, news releases can have a significant impact on market prices and volatility. To minimize potential losses and protect your running positions,
we recommend the following:
Avoid taking new trades during news releases
Use trailing stop-loss orders to protect your running positions and lock in profits
💖Supporting our robbery plan 💥Hit the Boost Button💥 will enable us to effortlessly make and steal money 💰💵. Boost the strength of our robbery team. Every day in this market make money with ease by using the Thief Trading Style.🏆💪🤝❤️🎉🚀
I'll see you soon with another heist plan, so stay tuned 🤑🐱👤🤗🤩

EURNZD "Euro vs Kiwi" Forex Bank Money Heist Plan (Bearish)🌟Hi! Hola! Ola! Bonjour! Hallo! Marhaba!🌟
Dear Money Makers & Robbers, 🤑💰✈️
Based on 🔥Thief Trading style technical and fundamental analysis🔥, here is our master plan to heist the EURNZD "Euro vs Kiwi" Forex Market. Please adhere to the strategy I've outlined in the chart, which emphasizes short entry. Our aim is the high-risk GREEN Zone. Risky level, oversold market, consolidation, trend reversal, trap at the level where traders and bullish robbers are stronger. 🏆💸"Take profit and treat yourself, traders. You deserve it!💪🏆🎉
Entry 📈 : "The vault is wide open! Swipe the Bearish loot at any price - the heist is on!
however I advise to Place sell limit orders within a 15 or 30 minute timeframe most nearest or swing, low or high level for Pullback Entries.
Stop Loss 🛑:
📌Thief SL placed at the nearest/swing High or Low level Using the 4H timeframe (1.92500) Day trade basis.
📌SL is based on your risk of the trade, lot size and how many multiple orders you have to take.
Target 🎯: 1.88000
💰💵💸EURNZD "Euro vs Kiwi" Forex Market Heist Plan (Scalping/Day Trade) is currently experiencing a Bearish trend.., driven by several key factors.👇👇👇
⚠️Trading Alert : News Releases and Position Management 📰 🗞️ 🚫🚏
As a reminder, news releases can have a significant impact on market prices and volatility. To minimize potential losses and protect your running positions,
we recommend the following:
Avoid taking new trades during news releases
Use trailing stop-loss orders to protect your running positions and lock in profits
💖Supporting our robbery plan 💥Hit the Boost Button💥 will enable us to effortlessly make and steal money 💰💵. Boost the strength of our robbery team. Every day in this market make money with ease by using the Thief Trading Style.🏆💪🤝❤️🎉🚀
I'll see you soon with another heist plan, so stay tuned 🤑🐱👤🤗🤩
