Key stats
About ISHARES AEX UCITS ETF EUR (ACC)
Home page
Structure
Irish VCIC
Replication method
Physical
Dividend treatment
Capitalizes
Primary advisor
BlackRock Asset Management Ireland Ltd.
ISIN
IE00BMTX2B82
The Fund seeks to track the performance of an index composed of 25 of the largest Dutch companies listed on NYSE Euronext Amsterdam.
Related funds
Classification
What's in the fund
Exposure type
Consumer Non-Durables
Commercial Services
Electronic Technology
Energy Minerals
Finance
Technology Services
Stock breakdown by region
Top 10 holdings


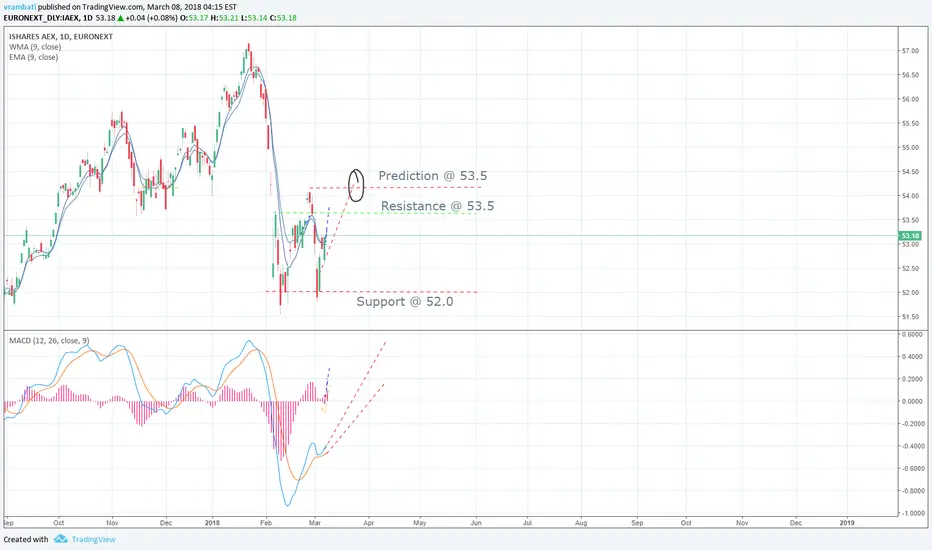


AEX technical analysis, time to prepare for index breakout?IAEX CFD-version. Look at the tracements. tracements are based on Fibonacci because markets has given some corrections wich also relate to volatile markets (difficult to use quantitve technical analysis)

Time to get out?Nikkei already dropped
Oldtimehighs
Buy-and-hold till the closelevel is reached
(correlation between AEX and NIKKEI)

What will happen in the Netherlands and deflation or inflation?CHARTDESCRIPTION
If the (ETF) AEX will break this level i only prefer to go long if the RSI, MACDI,(Slow) Stochastic and Bollinger Bands
will give me a positive signal.
I'm on this moment concernd about the level we have reached,
because there are many signs that the current stockmarkets are over

What is happening with the stockmarkets right now?If we look at the indexchart of the AEX (dutch25) we are seeing high consolidation. This means that markets are on this moment unpredictable and are waiting for more information.
Why can't we predict the markets?
Because we saw at the past that markets dind't react as expected on politics and econo

See all ideas
Summarizing what the indicators are suggesting.
Oscillators
Neutral
SellBuy
Strong sellStrong buy
Strong sellSellNeutralBuyStrong buy
Oscillators
Neutral
SellBuy
Strong sellStrong buy
Strong sellSellNeutralBuyStrong buy
Summary
Neutral
SellBuy
Strong sellStrong buy
Strong sellSellNeutralBuyStrong buy
Summary
Neutral
SellBuy
Strong sellStrong buy
Strong sellSellNeutralBuyStrong buy
Summary
Neutral
SellBuy
Strong sellStrong buy
Strong sellSellNeutralBuyStrong buy
Moving Averages
Neutral
SellBuy
Strong sellStrong buy
Strong sellSellNeutralBuyStrong buy
Moving Averages
Neutral
SellBuy
Strong sellStrong buy
Strong sellSellNeutralBuyStrong buy
Displays a symbol's price movements over previous years to identify recurring trends.
Frequently Asked Questions
An exchange-traded fund (ETF) is a collection of assets (stocks, bonds, commodities, etc.) that track an underlying index and can be bought on an exchange like individual stocks.
IAEA trades at 8.884 EUR today, its price has fallen −0.13% in the past 24 hours. Track more dynamics on IAEA price chart.
IAEA net asset value is 8.89 today — it's fallen 2.20% over the past month. NAV represents the total value of the fund's assets less liabilities and serves as a gauge of the fund's performance.
IAEA assets under management is 49.27 M EUR. AUM is an important metric as it reflects the fund's size and can serve as a gauge of how successful the fund is in attracting investors, which, in its turn, can influence decision-making.
IAEA price has fallen by −2.31% over the last month, and its yearly performance shows a 0.20% increase. See more dynamics on IAEA price chart.
NAV returns, another gauge of an ETF dynamics, have risen by −2.20% over the last month, have fallen by −2.20% over the last month, showed a 0.46% increase in three-month performance and has increased by 0.10% in a year.
NAV returns, another gauge of an ETF dynamics, have risen by −2.20% over the last month, have fallen by −2.20% over the last month, showed a 0.46% increase in three-month performance and has increased by 0.10% in a year.
IAEA fund flows account for −6.54 M EUR (1 year). Many traders use this metric to get insight into investors' sentiment and evaluate whether it's time to buy or sell the fund.
Since ETFs work like an individual stock, they can be bought and sold on exchanges (e.g. NASDAQ, NYSE, EURONEXT). As it happens with stocks, you need to select a brokerage to access trading. Explore our list of available brokers to find the one to help execute your strategies. Don't forget to do your research before getting to trading. Explore ETFs metrics in our ETF screener to find a reliable opportunity.
IAEA invests in stocks. See more details in our Analysis section.
IAEA expense ratio is 0.30%. It's an important metric for helping traders understand the fund's operating costs relative to assets and how expensive it would be to hold the fund.
No, IAEA isn't leveraged, meaning it doesn't use borrowings or financial derivatives to magnify the performance of the underlying assets or index it follows.
In some ways, ETFs are safe investments, but in a broader sense, they're not safer than any other asset, so it's crucial to analyze a fund before investing. But if your research gives a vague answer, you can always refer to technical analysis.
Today, IAEA technical analysis shows the neutral rating and its 1-week rating is buy. Since market conditions are prone to changes, it's worth looking a bit further into the future — according to the 1-month rating IAEA shows the buy signal. See more of IAEA technicals for a more comprehensive analysis.
Today, IAEA technical analysis shows the neutral rating and its 1-week rating is buy. Since market conditions are prone to changes, it's worth looking a bit further into the future — according to the 1-month rating IAEA shows the buy signal. See more of IAEA technicals for a more comprehensive analysis.
No, IAEA doesn't pay dividends to its holders.
IAEA trades at a premium (0.10%).
Premium/discount to NAV expresses the difference between the ETF’s price and its NAV value. A positive percentage indicates a premium, meaning the ETF trades at a higher price than the calculated NAV. Conversely, a negative percentage indicates a discount, suggesting the ETF trades at a lower price than NAV.
Premium/discount to NAV expresses the difference between the ETF’s price and its NAV value. A positive percentage indicates a premium, meaning the ETF trades at a higher price than the calculated NAV. Conversely, a negative percentage indicates a discount, suggesting the ETF trades at a lower price than NAV.
IAEA shares are issued by BlackRock, Inc.
IAEA follows the Netherlands AEX. ETFs usually track some benchmark seeking to replicate its performance and guide asset selection and objectives.
The fund's management style is passive, meaning it's aiming to replicate the performance of the underlying index by holding assets in the same proportions as the index. The goal is to match the index's returns.