PX1 trade ideas

Elliott Wave Targets (sample 1)This would explain most major moves. Perform similar analysis for your lower targets.
Pay attention to those price patterns (353 points).

It's worse than what I expected. Short on a pullback at 4896I need more confirmation before I know for sure we are entering into my 3rd proprietary cycle. This could lead to a huge downturn to 4200-4250 very quickly.


Closing the gap on Cac40Cac40 has been opening with quite a gap today just like most other indices.
Price has made a lower low on the m5 and I will be trading it down to close the gap.
If price moves down I will add aggressively so I max my profits.
Watch the other indices closely as they are not there yet and a reversal might still be possible.
Trade safely...
*** If you like my ideas, please don't forget to give me a "like" ***


CAC40 - Possible descending triangleNot confirmed yet. If it is, it would be an opportunity for some shorts/longs inside the triangle and at the end we should see a bearish continuation to find a support around 4600.
Any thoughts on this idea? Let me know!


CAC 40 - Daily - Watch today's closeTrade Alert
Together with the other indices, the French CAC 40 was also hit by heavy selling, but it managed to find support near the October low of 4896.
But what's interesting here is that the daily chart could be forming a harami candlestick pattern, hence why we recommend to observe today's close and act on it either tomorrow or Friday. The only issue with this potential harami formation is that it wouldn't be your typical textbook one, where in this scenario, the smaller candle would be of the opposite color. that's why we will be very cautious of the idea of a potential reversal, as the books suggest. Instead, we could keep a close eye on the highlighted areas, a break of which could open the path in the direction of their break.
As always, don't forget your SL.

CAC40 - Long-Term triangle breakout retest ?Do we reteste the breakout of the triangle related to CAC40 ?
A rejection of the 4900 upside would be ultra bullish
If we close monthly above -> would be very interesting


Cac 40 Short approachWe reached a current top for the cac 40, lower then the 2 before. Distribution top leading to a bearish retracement. Unfavorable markets context.
What are your thoughts ?

France40 forming a head and shouldern pattern?FRANCE index is forming a H&S pattern? Looking for opening a long position.

Kick The CACThe French stock market is painting an inverted triangle formation. Though not yet confirmed, this can portend lower prices ahead. We are currently rounding over. A weekly close above the prior weeks' high would negate bearishness for now, whilst a weekly closing below the last swing low would confirm the pattern and target the purple area.
While pundits claim the US stock market rally, it is far more prudent to short markets that are seeing material capital outflows, especially in failed states such as France.

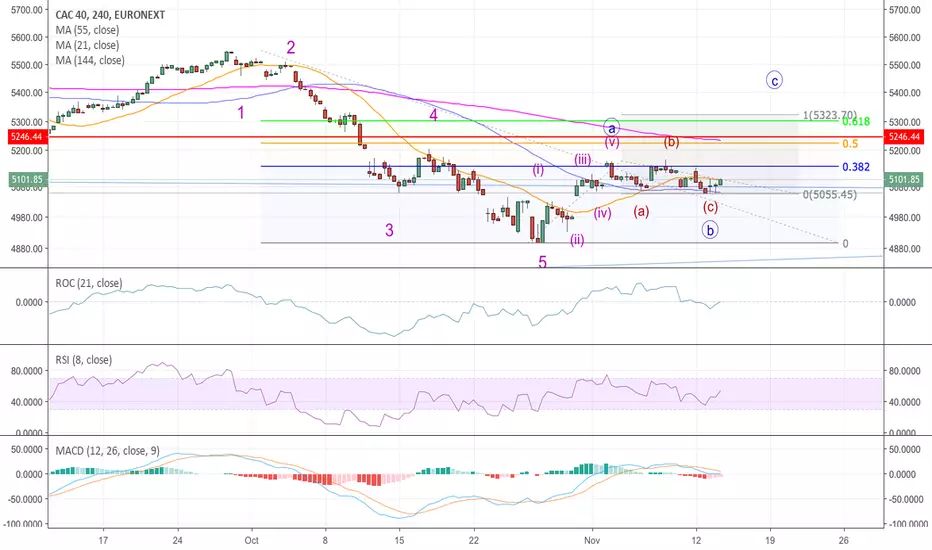
CAC40 - c wave rally?Same pattern, most obvious in CAC. Prices should move to a=c, just above 0.618 retracement.
Cac is making a complex correctionThe bounce in Cac after the big October stock rout has pretty much run out of the energy. It has traded back into the 5080 - 5180 area before the last down leg. Now there is a sign that it might be breaking down from this trading range. However, the break looks lacking conviction and absence of follow through. It is possible that it gains down side momentum during the NY session together with the US equity. However, there is another possibility that the break is merely a false break and it is going to rip back to take out the upper resistance line and turn this pattern into an inverted head shoulder pattern.


CAC 40 trading plan updateThis is an update of the previous plan on CAC40 if the market conditions holds like what they are at the moment there is still good opportunity to extract nice profit from it.
You can check trade full fundamental and technical analyses in YouTube.
