AAPL: Update - Key Levels to Watch for Price DevelopmentAAPL: Update - Key Levels to Watch for Price Development
Overall nothing changed and AAPL remains a valuable and strong structure
Apple's stock (AAPL) has been range-bound between $193 and $212.50 for the past two months, repeatedly testing support near $193 on three occasions.
Each time, the price has rebounded strongly, pushing back toward $212.50—the upper boundary of this trading range.
Given this pattern, the likelihood of another move toward $212.50 remains high.
If AAPL successfully breaches $212.50, it could signal a larger bullish breakout, with upside targets at $224.50 and $240, as highlighted in the chart.
You may find more details in the chart!
Thank you and Good Luck!
❤️PS: Please support with a like or comment if you find this analysis useful for your trading day❤️
4AAPL trade ideas

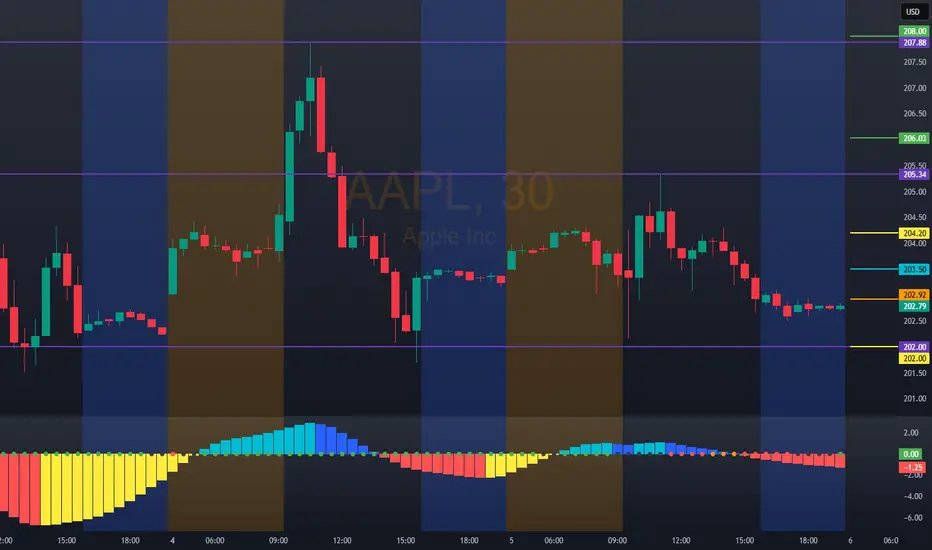
AAPL: 202.92Bullish Entry: Level: 206.00 / 208.00 Target 210.00 Stop 206.00 Bearish Entry: 200.00/198.00 Stop 201.00 Target 196.00
Watching AAPL closely here !!!Not financial advice – just sharing my outlook. 📉📈
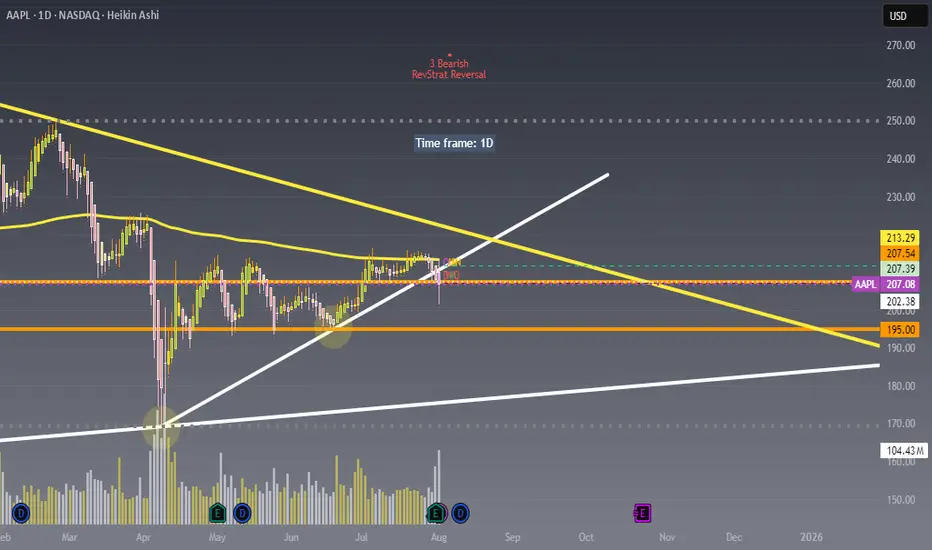
Price is currently rejecting the upper trendline resistance around $213 and struggling to hold above the $207-$208 zone.
Looking for potential puts as long as price remains under this key resistance area.
Will be buying the dip near the $195 or $185 zone where strong demand and trendline support intersect.
Key levels :
Resistance: $213.29 / $207.54
Support: $202.38 / $195.00
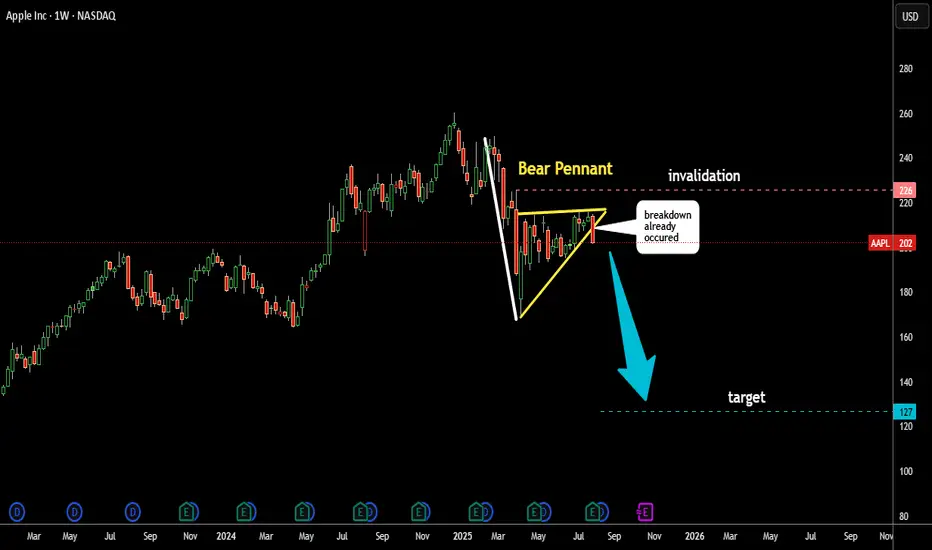
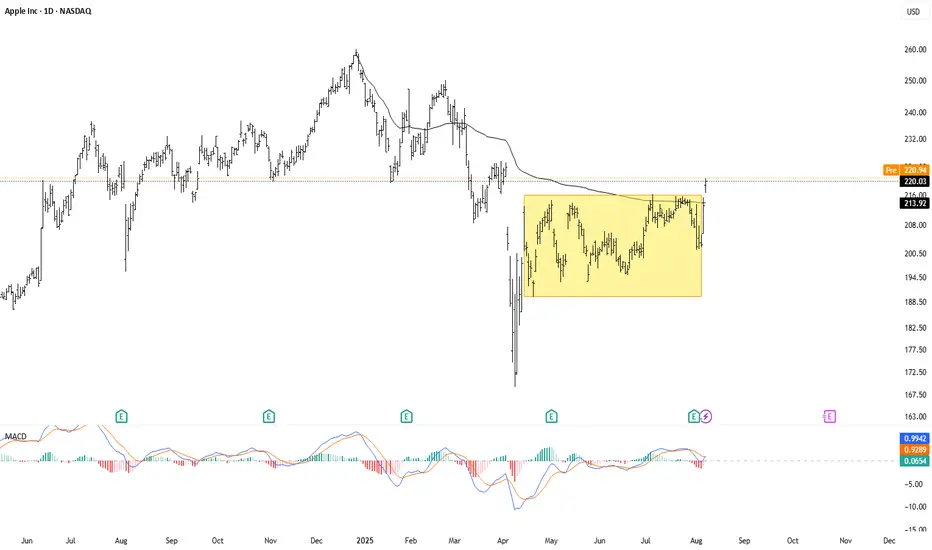
Apple (AAPL): Collapse Is Imminent? Bearish Pennant patternAAPL has already been affected by a Bearish Head & Shoulders reversal pattern earlier this year (see related).
Now, another bearish pattern has formed — a Pennant (highlighted in yellow).
The price has broken below the Pennant’s support, triggering a potential bearish move.
The target is calculated by subtracting the length of the Pole (in white) from the support level of the pattern.
This target is marked with a blue dashed line at $127.
Is Apple melting down again?
I’d love to read your thoughts.
APPLE My Opinion! SELL!
My dear friends,
Please, find my technical outlook for APPLE below:
The price is coiling around a solid key level - 229.36
Bias - Bearish
Technical Indicators: Pivot Points Low anticipates a potential price reversal.
Super trend shows a clear sell, giving a perfect indicators' convergence.
Goal - 221.47
About Used Indicators:
The pivot point itself is simply the average of the high, low and closing prices from the previous trading day.
Disclosure: I am part of Trade Nation's Influencer program and receive a monthly fee for using their TradingView charts in my analysis.
———————————
WISH YOU ALL LUCK

Why Apple Could Be Entering a Structural Correction🍎📉 Why Apple Could Be Entering a Structural Correction ⚠️🔍
After scanning major tech names today, one stock stood out— for all the wrong reasons : NASDAQ:AAPL .
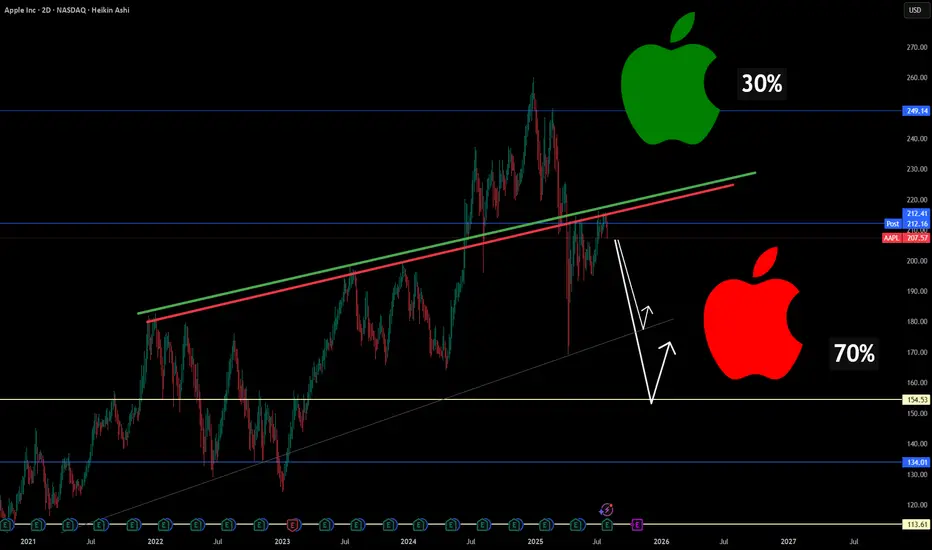
Technically, Apple has broken below long-standing trendline support , and my chart now assigns a 70% probability(roughly guys...roughly and rounded) of further downside vs only 30% upside . But it's not just about the chart...
Here’s the macro storm Apple is walking into:
🧭 1. Trade War Revival
New tariffs on Chinese electronics could cost Apple up to $1.1B/quarter , even as it tries to diversify production. India and Vietnam are promising, but not mature enough to offset risk.
🤖 2. Lagging in the AI Arms Race
While Nvidia, Google, and Microsoft pour $30B+ into AI, Apple is spending less than half that. Analysts weren’t impressed with “Apple Intelligence.” Siri still isn’t leading.
🇨🇳 3. China: Flatlining Growth, Rising Risk
~18% of Apple’s revenue still comes from China. With Huawei resurging and tightening regulations, Apple’s dominance is being chipped away.
🛑 4. Innovation Pipeline: Empty?
There’s no iPhone super-cycle ahead. Vision Pro remains niche. Apple now looks like a mature tech stock without a breakout catalyst —risky when valuation is still premium.
⚖️ 5. Legal Pressure on Both Sides of the Atlantic
The DOJ and EU are targeting Apple’s App Store dominance. If changes are enforced, the service revenue moat weakens.
🔽 Summary: This Isn’t Panic. It’s Repricing.
The market is re-rating Apple based on real structural risks.
Downside levels I’m watching:
📉 177.65 (first support)
📉 154.53 (next key level)
❗️134–113 zone if macro pressure escalates
Chart = structure. Narrative = pressure. Both are aligned.
Let me know your thoughts—still long NASDAQ:AAPL , or hedging this weakness?
One Love,
The FXPROFESSOR 💙
Disclosure: I am happy to be part of the Trade Nation's Influencer program and receive a monthly fee for using their TradingView charts in my analysis. Awesome broker, where the trader really comes first! 🌟🤝📈
Apple (AAPL) Shares Surge to Four-Month HighApple (AAPL) Shares Surge to Four-Month High
According to the AAPL price chart, the stock rose to the $220 level yesterday – marking its highest point since early April.
The rally was fuelled by several bullish factors:
→ Trade developments: President Trump announced an additional 25% tariff on goods from India, but notably excluded smartphones – a key point, as a significant portion of iPhones are manufactured there.
→ Seasonal momentum: Apple is approaching its historically strong period. A new iPhone model is traditionally unveiled in September, followed by the start of the holiday shopping season and strong retail demand.
Technical Analysis of Apple (AAPL) Shares
In our previous analysis, we identified an ascending channel (marked in blue) formed by price fluctuations following the April 2025 correction. A bullish reversal (highlighted with an arrow) has provided a basis to update the channel’s slope. In this configuration, the price is now in the upper half of the channel, moving towards its upper boundary.
From a price action standpoint, AAPL's rally is characterised by aggressive upward movement, accompanied by bullish gaps. This is a notable observation, suggesting that while sellers attempted to regain control during a consolidation phase in late July, they lacked conviction – with momentum now favouring the bulls.
This resembles a failed Rounding Top bearish pattern – bulls were able to push the price higher, signalling strong demand.
Potential resistance levels:
→ Near-term: The upper boundary of the channel, reinforced by the $225 level – a price point that has previously acted as a reversal zone.
→ Longer-term: A descending trendline (marked in red), drawn across key highs from recent months.
Bulls might find support at the channel median, which is further reinforced by the former resistance level of $214.
Having risen more than 8% since the start of the week, AAPL now appears overbought in the short term. However, given the strong fundamental backdrop, any potential pullbacks might prove to be shallow.
This article represents the opinion of the Companies operating under the FXOpen brand only. It is not to be construed as an offer, solicitation, or recommendation with respect to products and services provided by the Companies operating under the FXOpen brand, nor is it to be considered financial advice.
AAPL - Breakout in Apple After ConsolidationApple's stock appears to be breaking out of its three months trading range between 216 and 190, potentially opening the way for more upside from here. Not only did the pair break above the previous highs, it has also broken above the VWAP line from last year's highs.
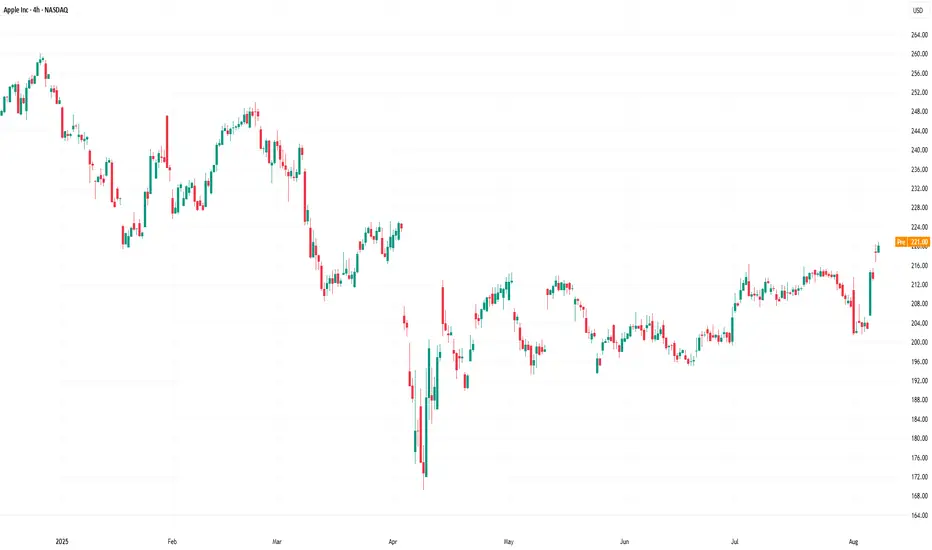
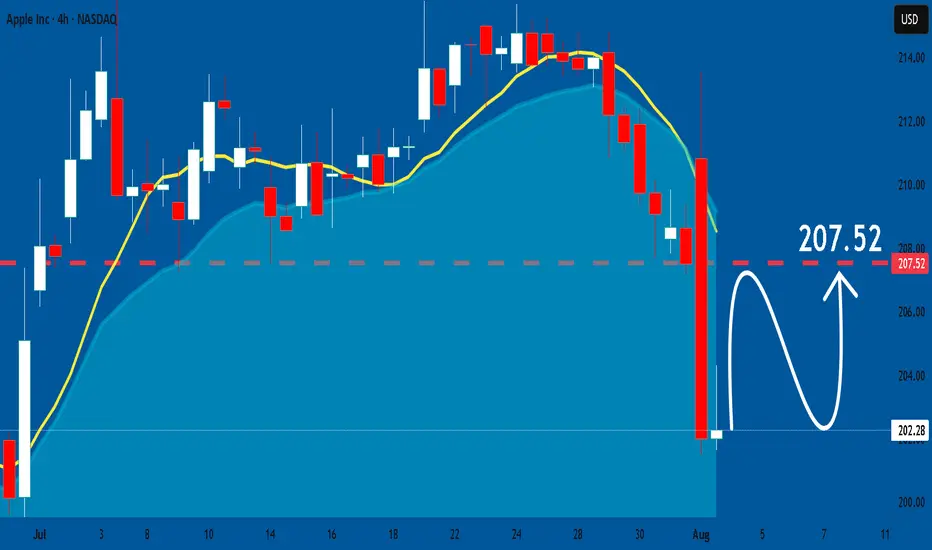
APPLE INC. STOCK FORMING BEARISH TREND MARKET STRUCTUREApple Inc. (AAPL) Stock Developing Bearish Structure in 4-Hour Chart - Key Levels to Watch
Technical analysis of Apple Inc.'s (AAPL) 4-hour chart reveals a concerning bearish trend formation that traders should monitor closely. The recent price action has shown strong selling pressure, confirmed by multiple large bearish candlesticks that indicate aggressive seller participation. This pattern suggests the stock is likely to maintain its downward trajectory in the near term unless significant buying pressure emerges.
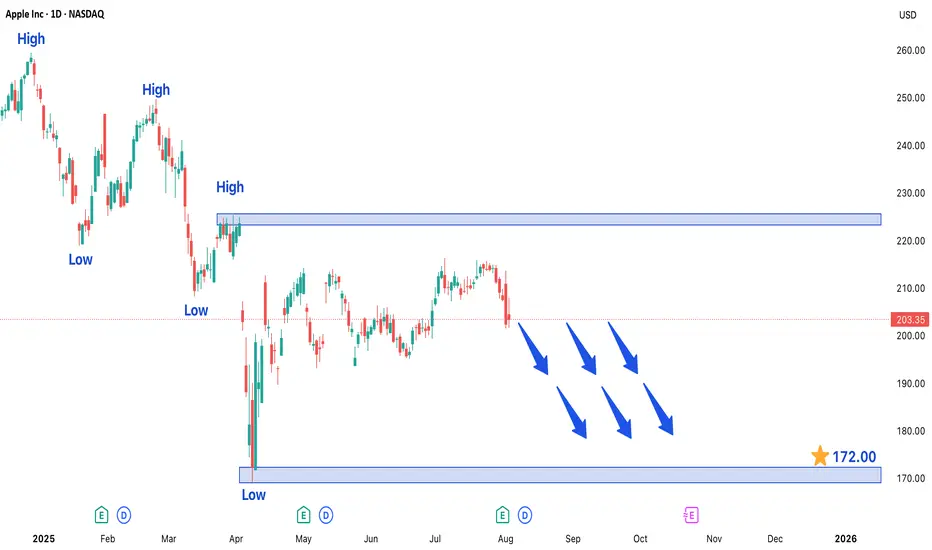
Critical Price Levels and Market Structure
The current technical setup presents two crucial reference points for traders:
1. Downside Target at 172.00 - This level represents the next major support zone where we might see either:
- A potential pause in the downtrend
- Acceleration of selling if broken decisively
2. Upper Resistance at 226.00 - This price level now serves as a key ceiling for any bullish recovery attempts. A sustained move above this resistance would be required to invalidate the current bearish outlook.
Trading Dynamics and Key Observations
- The formation of consecutive lower highs and lower lows confirms the bearish structure
- Volume analysis shows increasing activity during down moves, supporting the bearish case
- Momentum indicators (RSI, MACD) are favoring sellers in the current market environment
Strategic Considerations for Traders
For those considering short positions:
- Ideal entry points would be on pullbacks toward recent resistance levels
- Conservative traders may wait for confirmation of rejection at 226.00 before entering
- Protective stops should be placed above key resistance levels
For potential buyers:
- Caution is advised until clear reversal signals appear
- The 172.00 level may offer a potential bounce opportunity if supported by volume
Risk Management Notes
Traders should remain vigilant for:
- Unexpected fundamental developments (earnings reports, product announcements)
- Sudden shifts in broader market sentiment
- Potential support at psychological levels (175.00, 170.00 round numbers)
The current technical picture suggests maintaining a bearish bias unless price action shows convincing signs of reversal, particularly through a sustained break above the 226.00 resistance level. As always, proper position sizing and risk management remain crucial in navigating this potentially volatile setup.
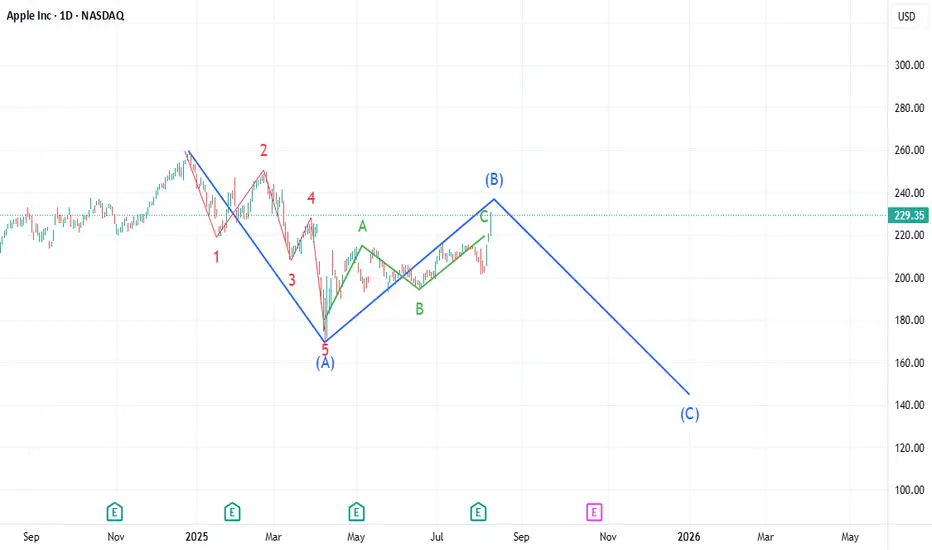
AAPL: End of B Wave in ABC CorrectionApple blasted upwards Wednesday through Friday for what likely is a blowoff of wave C ov Wave B. AAPL could potentially reach 232, but that is as high as I am anticipating. The next wave down will likely be more violent than Wave A and could bring AAPL down to as low as $143 over the next 3 - 5 months.
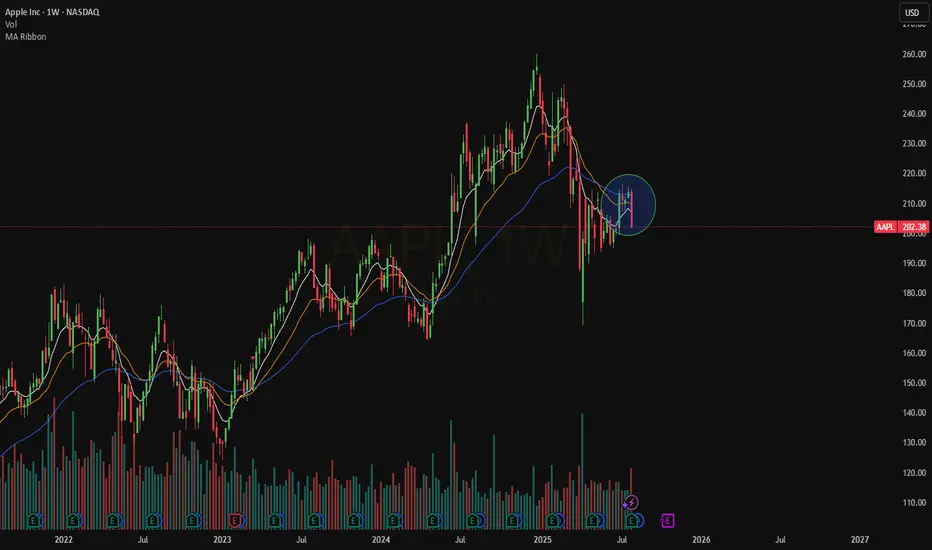
Weekly $AAPLNASDAQ:AAPL on the Weekly is still bearish. The price is trading below our EMAs that are even in a bearish order.
We need a stable move above $217 right now.
Not sure will come soon
Apple (AAPL) Shares Jump Following Earnings ReportApple (AAPL) Shares Jump Following Earnings Report
Yesterday, after the close of the regular trading session, Apple released its earnings report, which surpassed analysts’ expectations:
→ Earnings per share: actual = $1.57, forecast = $1.43;
→ Revenue: actual = $94.04 billion, forecast = $89.35 billion.
As a result, AAPL shares surged in the post-market, rising from $207.57 to $212.51.
Media Commentary:
→ The company reported a 13% year-on-year increase in iPhone sales.
→ However, according to Tim Cook, tariffs have already cost the company $800 million and this figure could exceed $1 billion in the next quarter.
Technical Analysis of the Apple (AAPL) Stock Chart
Following the volatility in April 2025, price action has justified the construction of an ascending channel (marked in blue). The $216 level, which has acted as a key reference point since March, remains a significant resistance area, because:
→ It has consistently prevented AAPL from reaching the upper boundary of the channel;
→ Even in the wake of a strong earnings report, the price failed to break through this level in post-market trading.
If the $216 level continues to cap gains in the coming days – despite the positive report – the stock might pull back towards the median line of the blue channel (following the post-market rally). This zone often reflects a balance between supply and demand. While such a retracement would appear technically justified, it may raise concerns among shareholders, particularly when compared to the more aggressive price rallies seen in the shares of other tech giants, such as Microsoft (MSFT), as we discussed yesterday.
From a more pessimistic perspective, peak A may turn out to be yet another lower high within a broader bearish structure that has been forming on the AAPL chart since December 2024, when the stock reached its all-time high around the $260 level.
This article represents the opinion of the Companies operating under the FXOpen brand only. It is not to be construed as an offer, solicitation, or recommendation with respect to products and services provided by the Companies operating under the FXOpen brand, nor is it to be considered financial advice.

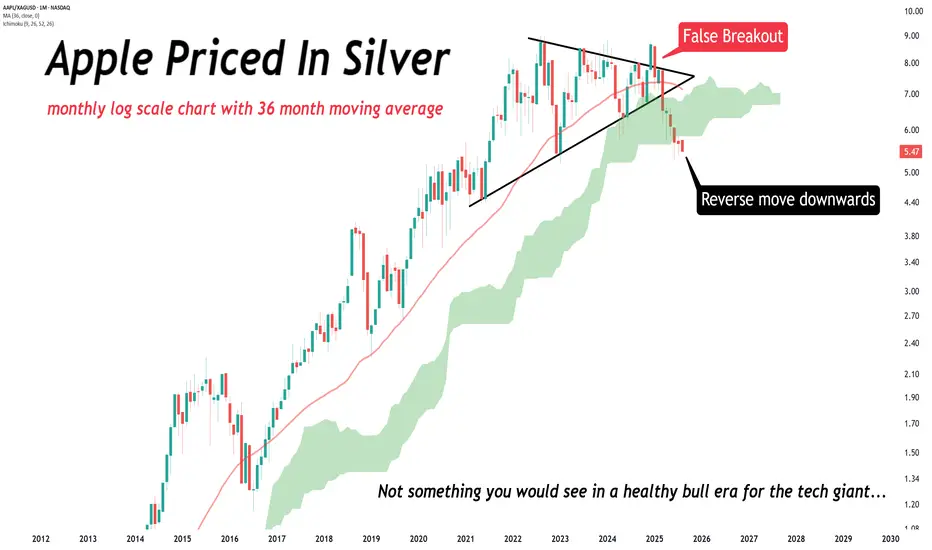
Since December, Apple LOST 37% of its value (priced in silver).Since December, Apple LOST 37% of its value (priced in silver).
You should NOT be seeing this happen in a bull era for the tech giant.
Time to buy? Too much negative press. Buy in Fear- Updated 28/7Apple has been making steady gains since April 8th. Trading volume has been consistently strong, increasing intermittently, with sell pressure exhausted at the 200 USD mark. The price point is now sitting above the 200 daily EMA support, which indicates strong potential for continued upward movement. Apple's earnings are in focus this week, with predictions that they will exceed expectations, but the extent of that exceedance is the question.
Regardless of the competition from Chinese-made phones or Samsung, once you are in the Apple ecosystem, it is rare to leave. Even if buying cycles slow down, Apple often provides innovative solutions to problems that no other provider can. The focus on Apple regarding AI appears slightly biased and carries some elements of fear, uncertainty, and doubt (FUD). It would be foolish to bet against Apple in the long term, even if the necessary technology is obtained through acquisition. With a strong cash position, this should not be an obstacle.
So far, the charts have shown us two positive moves after flag patterns, with resistance just below and around the EMA 200 level, which is now acting as support. The RSI is in the upper regions but is far from overbought, indicating we have a good level of momentum. The accumulation distribution chart also suggests strong support for Apple from institutions. No clear pattern is yet forming on the charts, except for a possible ascending triangle on the weekly, which would be very bullish.
The 50-day EMA is likely to cross the 200 EMA in mid-August, drawing a lot of attention as this would create a Golden Cross. This event would occur just prior to the Apple launch in September, which is rumored to introduce significant updates and advancements. Considering all these factors, I anticipate that Apple will continue its upward momentum for the next six weeks, with some substantial moves followed by pullbacks to support levels. The launch events will likely propel Apple to reach an all-time high (ATH). NFA
Target price is >260
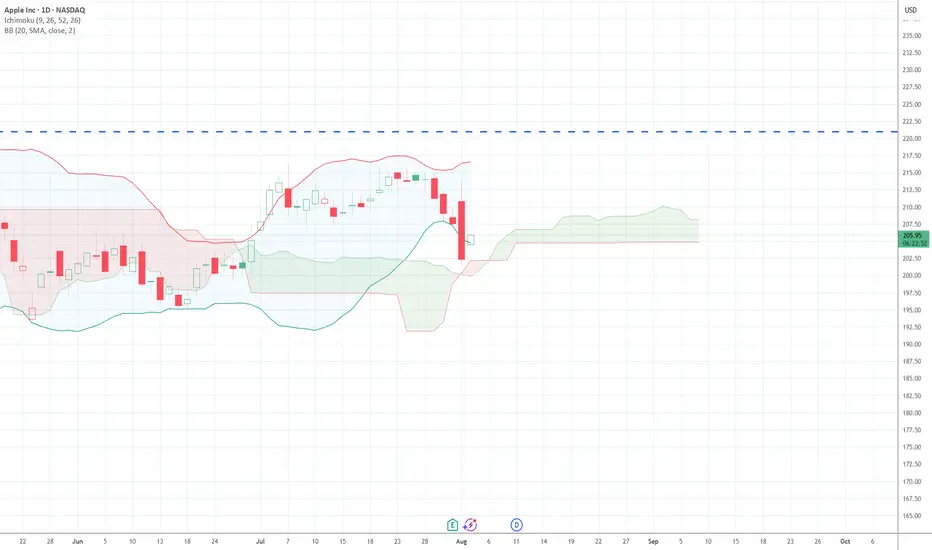
$AAPL LongNASDAQ:AAPL sold off hard after earnings and fell outside of the bands and still holding the cloud. Could have a nice bounce here.
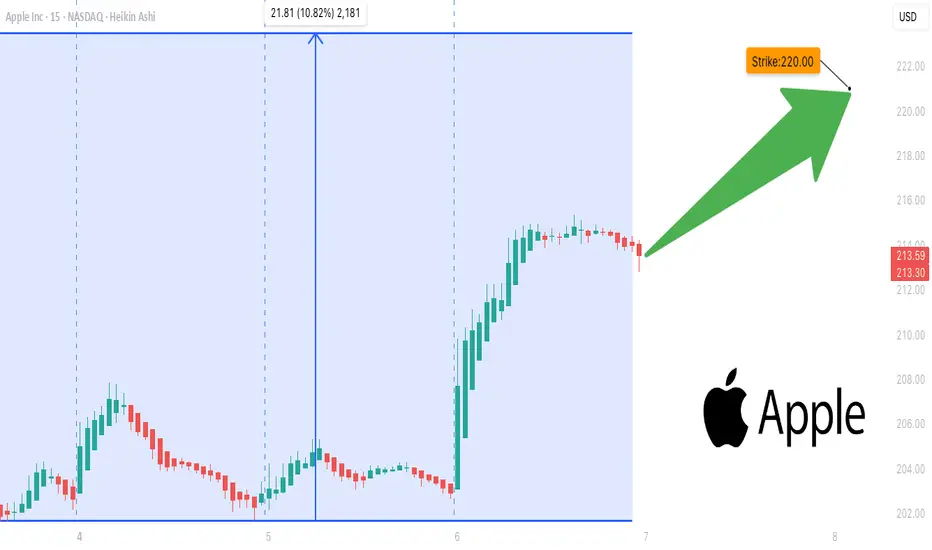
AAPL Bulls Ready to Strike## 🍎 AAPL Bulls Ready to Strike? 🚨 Weekly Options Loading...
**Call at \$220 → Entry \$0.66 → Target \$1.32 💰💰**
---
**🧠 AI Consensus Highlights:**
✔️ Strong Options Flow 📈
✔️ Institutional Volume Spike
⚠️ Caution: Bearish Daily RSI
🔀 Mixed Sentiment = Selective Entries Only
---
**🔥 Featured Trade Setup:**
* 📍 **Strike:** \$220 Call
* 💵 **Entry:** \$0.66
* 🎯 **Target:** \$1.32
* 🛑 **Stop:** \$0.33
* 📅 **Expiry:** Aug 8
* 📈 **Confidence:** 65%
* ⏰ **Entry Timing:** Open
---
**⚔️ Model Breakdown (AI Models):**
* **Grok & Claude:** Bullish → Call Recommended
* **DeepSeek & Gemini:** Cautious → No Entry
* **Meta:** Mixed → Watch RSI & Gamma Sensitivity
---
**🧠 Strategy:**
Scalp the weekly upside using a tight stop-loss + profit lock. Timing is key with high gamma volatility expected post-earnings.
---
**📛 Tags for TradingView Post:**
\#AAPL #OptionsAlert #AppleStock #EarningsPlay #CallOptions #WeeklySetup #TradingStrategy #OptionsFlow #BullishSetup #TechStocks #AITrading #InstitutionalFlow #MarketAnalysis
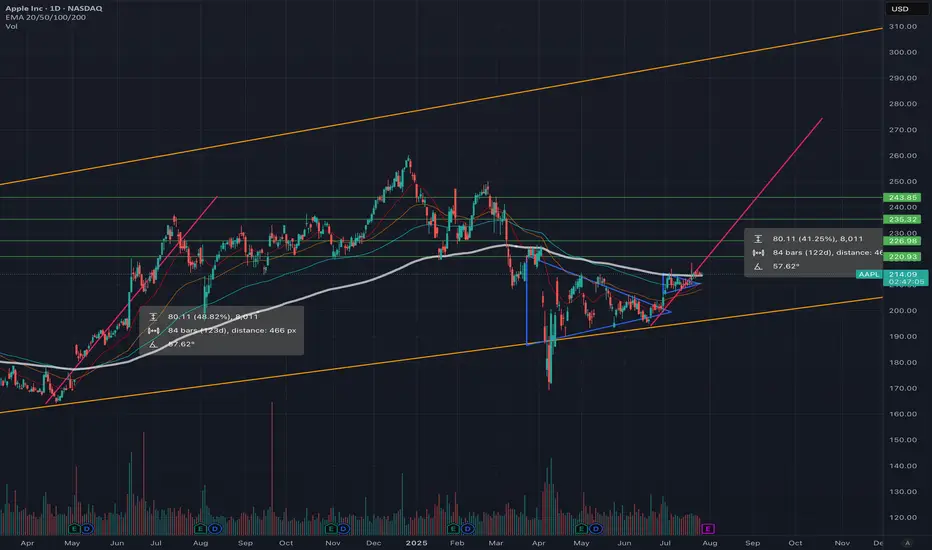
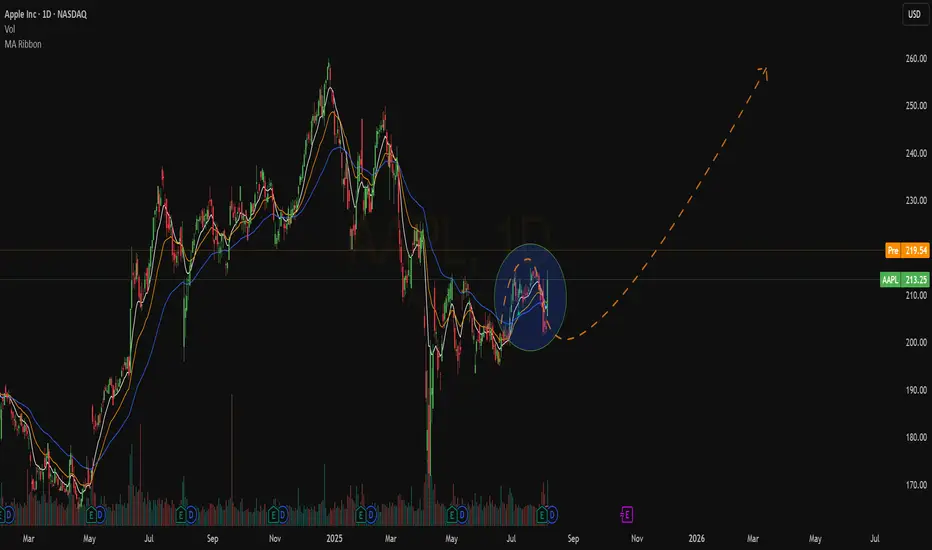
AAPL LONGApple is breaking out, supported by bullish accumulation volume patterns indicating strong buying pressure. Key bullish points:
$100B U.S. investment strengthens domestic operations and tariff protection.
Strategic supply chain shifts to U.S. and India reduce geopolitical risks.
Leading tech sector rally amid AI growth potential.
With momentum building, $275 is the next target.

Apple Stock Falls Despite Strong EarningsApple stock is down more than 4% in the final session of the week, following the company’s earnings release yesterday. Apple reported earnings per share of $1.57, beating expectations of $1.43, while total revenue reached $94.04 billion, surpassing the $89.53 billion forecasted by the market.
However, despite the strong results, the stock is once again facing a notable short-term bearish bias as investor concerns grow. The primary issue is the perception that Apple is falling behind in the race for artificial intelligence, especially compared to its main competitors. In addition, shortly after the earnings announcement, it was noted that the company may face challenges in sustaining growth throughout the remainder of 2025, which has fueled additional downward pressure on the stock.
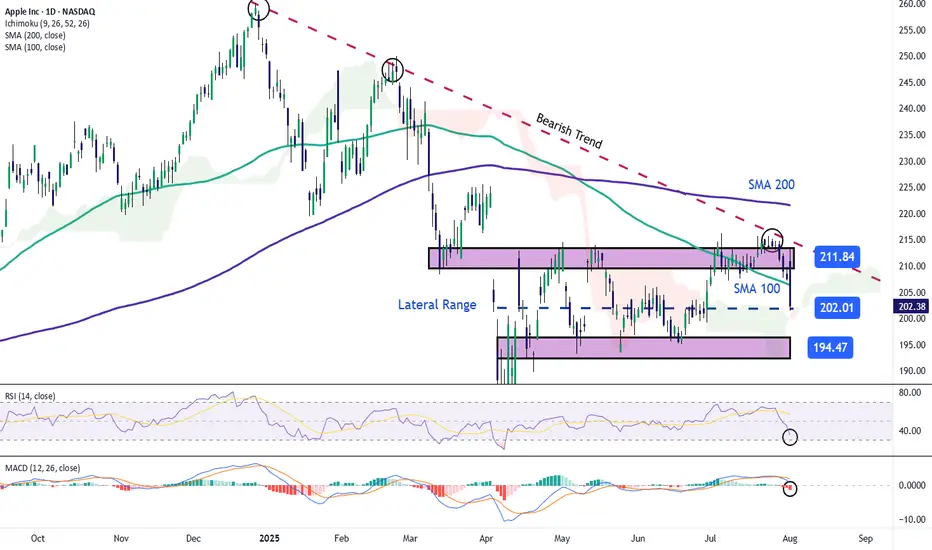
Sideways Range Emerges
In recent weeks, Apple’s price action has consolidated within a clear lateral range, with resistance around $211 and support near $194. So far, price fluctuations have not been strong enough to break this structure, and the latest bearish candlestick has reinforced the validity of the channel. For now, this sideways range remains the most relevant technical formation to watch in the upcoming sessions.
Technical Indicators
RSI:
The RSI line is falling rapidly and is now approaching the oversold zone at the 30 level. If the indicator reaches that threshold, it could suggest a technical imbalance, opening the door to a short-term bullish correction.
MACD:
The MACD histogram has moved into negative territory in recent sessions, suggesting a clear dominance of bearish momentum in the moving average structure. If this persists, selling pressure may continue to build in the near term.
Key Levels to Watch:
$211 – Main Resistance: Upper boundary of the current range. A breakout above this level could trigger a stronger bullish trend.
$200 – Psychological Support: Round number zone, a breakdown here could activate an immediate bearish bias for the next sessions.
$194 – Key Support: Corresponds to recent weekly lows. A move below this level would likely confirm a more extended bearish trend.
Written by Julian Pineda, CFA – Market Analyst
APPLE: Bullish Forecast & Bullish Scenario
The charts are full of distraction, disturbance and are a graveyard of fear and greed which shall not cloud our judgement on the current state of affairs in the APPLE pair price action which suggests a high likelihood of a coming move up.
Disclosure: I am part of Trade Nation's Influencer program and receive a monthly fee for using their TradingView charts in my analysis.
❤️ Please, support our work with like & comment! ❤️
New Setup : $AAPLThe daily chart sees a bullish ATR Break together with a bullish crossover and a pullback on the ema50.
There is even a strong rejection to that level. We are still waiting for the confirmation but it looks great !
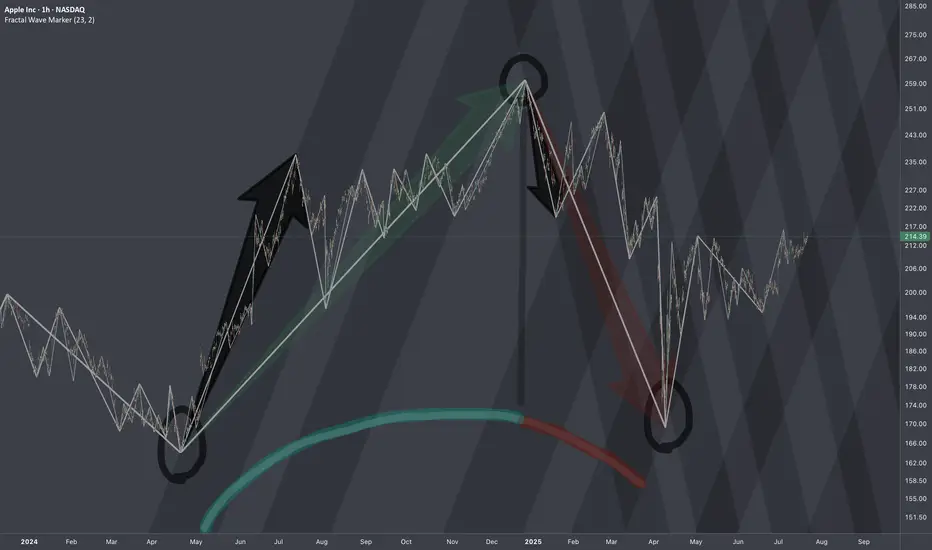
$AAPL: Structure SurgeryResearch Notes
Original Structure:
Altering structure for experimental purposes
Angle of fib channels that rises from cycle low, has been pushed into the past to the top of first major reaction. blue area resembles the change
Reason
The the angle of Fibonacci channels which cover the general decline (from perspective of ATH to end of cycle), are adjusted to the angle of the first bear wave of smaller scale.
Therefore, when it comes to measurements of opposing forces for working out interference pattern, having this symmetric approach of mapping interconnections is fair.
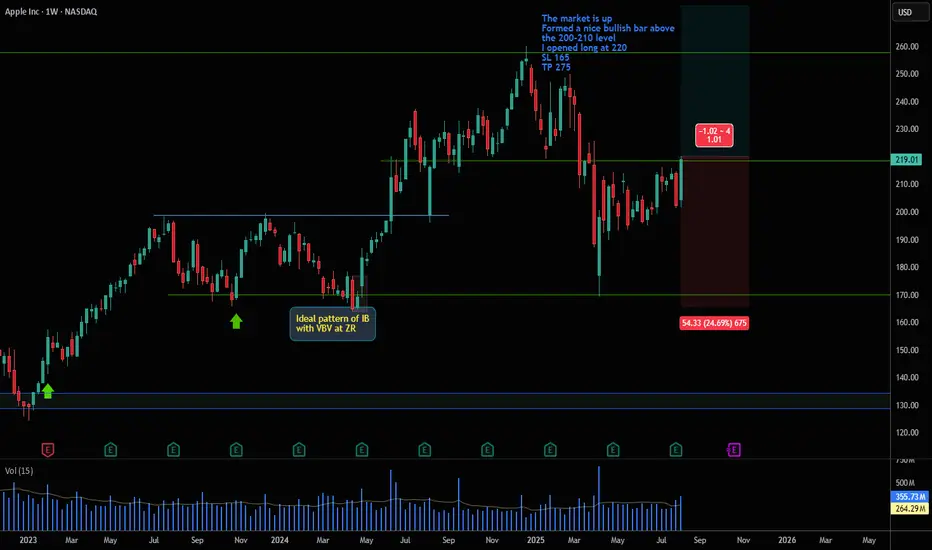
Buy Apple at the break of 200-210 levelI opened long at the BRO the level 200-210
by a strong bullish bar
with a very good Volume and after the EPS
this market is in up trend
Long at 220
SL 165
TO 275
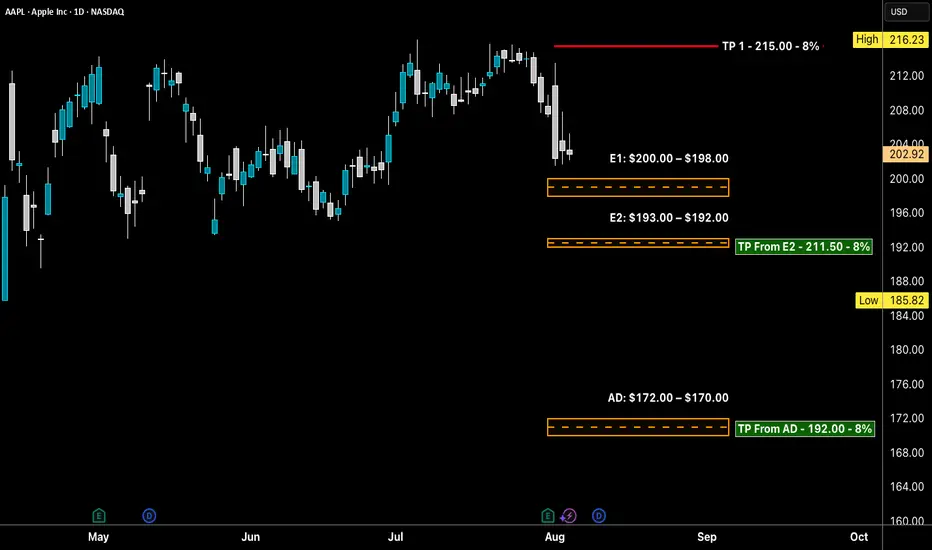
AAPL LONG Swing Entry PlanNASDAQ:AAPL LONG Swing Entry Plan
E1: $200.00 – $198.00
→ Open initial position targeting +8% from entry level.
E2: $193.00 – $192.00
→ If price dips further, average down with a second equal-sized entry.
→ New target becomes +8% from the average of Entry 1 and Entry 2.
AD: $172.00 – $170.00
→ If reached, enter with double the initial size to lower the overall cost basis.
→ Profit target remains +8% from the new average across all three entries.
Risk Management:
Stop Loss:
Risk is capped at 12% below the average entry price (calculated across all executed positions including the Edit Zone).
Position Sizing Approach:
Entry 1: 1x
Entry 2: 1x
AD Zone: 2x
→ Total exposure: 4x
→ Weighted average determines final TP and SL calculations.
______________________________________
Legal Disclaimer
The information provided in this content is intended for educational and informational purposes only and does not constitute financial, investment, or legal advice or recommendations of any kind. The provider of this content assumes no legal or financial responsibility for any investment decisions made based on this information. Users are strongly advised to conduct their own due diligence and consult with licensed financial advisors before making any financial or investment decisions.
Sharia Compliance Disclaimer: The provider makes no guarantees that the stocks or financial instruments mentioned herein comply with Islamic (Sharia) principles. It is the user’s responsibility to verify Sharia compliance, and consultation with a qualified Sharia advisor is strongly recommended before making any investment decisions