QuickView : AKAMOn the daily Chart the price is trying to make a move higher without success. Bears are still in control and a new bearish crossover is coming.
4AKAM trade ideas

AKAM heads up at $84: Major Resistance should cause a Dip AKAM recovering nicely but just hit a resistance at $83.76-84.25
Second attempt to break, see if it gets above and Retest for buy.
If we get a dip bulls need to hold the Golden Covid fib at $81.88.

1/3/25 - $akam - taking another look. dead $ in '251/3/25 :: VROCKSTAR :: NASDAQ:AKAM
taking another look. dead $ in '25
- wrote about NYSE:S earlier today, it's not "obvious" and there's some hair there but it's interesting. more of a trade.
- got me looking to refresh my "cyber pandemic" list of about 20 names to see what's changed in the last 6 months as we turn the leaf into '25 as i think this sector could become hawt once again
- rn NASDAQ:PANW is the NASDAQ:NVDA , but it's quite expensive (for good reason), other names like NYSE:NET are HQ and would be great dip-buys but the bar is simply too high when i compare to stuff in semis (like NYSE:TSM and NASDAQ:NVDA that are cash monster moats and trade a helluva lot cheaper). and next in line are probably NASDAQ:ZS which i'd eye perhaps at curr levels and should write up shortly and NASDAQ:OKTA (but where in okta's case, growth is a bit more meh, but nonetheless think they've got a lock on identity going fwd). i digress...
- so back to $akam. first.. when we look v. QQQ pair (type "AKAM/QQQ" in trading view), you can see over the long-term (look at monthly bars) this thing has simply faded. it's not been good money esp on a single-name basis when u could have just owned Q's. same when you compare w/ the panw, net, zs complex from above. and there's no real stabilization here either in the trend. tough.
- on a fundamentals basis, there are a lot of factors to watch for in the coming results, but none in particular that will immediately re-rate the stock and send it popping beyond M&A (which IMO is a nice kicker, but not worth buying a stonk for unless it's trading below liquidation value - which this one is not). they've made a lot of M&A in the past years, have some interesting solutions... but ultimately seems like they're trying to find their footing still in a difficult CDN go-forward and where their cyber offer is not a leader.
- so when you consider MSD++ growth (top line/ EPS), net debt (and not a small amount - nearly 3 bn on a 14 bn mkt cap name... means any "down" moves does little to really improve the valuation (like a bit net cash company would be). in other words, FCF yield here with mediocre growth is ~6% which is "fine" maybe cash+, but even 15% lower only takes you almost to 7% and you'd need -25% off on equity to get closer to 8%. even still... if stonk goes -25%... beyond trading the dip, would we want to own it? and if stonk rips with cyber maybe 10-15% from here... are we keeping it or trading for the faster horses?
- pt is, this isn't a biz that has clear catalysts, valuation is in no man's land w/ not so great cap structure (which usually hurts tech businesses that aren't big growers, all else equal), so i don't see the pt of owning it vs. some of the alternatives.
gl to the holders, but this one has a trigger for me to re-evaluate at $70 and even still, whatever brings us there... might mean there are better deals elsewhere (likely).
V


Akamai Technologies, Inc. | Chart & Forecast SummaryKey Indicators on Trade Set Up in General
1. Push Set Up
2. Range Set up
3. Break & Retest Set Up
Chart Set Up:
* Bullish Head & Shoulders
* Bearish Head & Shoulders
* Channel 1
* Channel 2
* Wave 12345
Conclusion | Trade Plan Execution & Risk Management on Demand;
Overall Consensus | Sell

AKAM - Getting ready for an explosive moveAKAM - I dont trade much, this often trades in a range. Now it's in uptrend.
Long anywhere here
Stop loss - 92
Target 1 - 112
Target 2 - 120

Speculative long entryAs shown on the chart, a speculative long order has been placed. The price is currently still below the resistance zone, but I anticipate a break, as this zone has been tested multiple times. Additionally, this stock has been in a consistent bullish trend since early July, supported by the 30- and 50-day SMAs.

5/9/24 - $akam - careful. i'd avoid this one for now...5/9/24 - vrockstar - burning a post to simply ask if 15x EPS for 10% growth is "good" in this tape for you to punt? the issue here is 5% fcf yield with 10% growth is better had in a number of better mgn B2B names, and all of these have gotten hacked hard this Q. also consider AKAM's performance since last Q - the reset simply puts us to the place we were heading into the 3Q print. i'd argue any beat here is a. not going to smash b. or guidance can't rerate a stock (mind the debt too- it's a toxic factor in this tape). and finally, if there is a miss- you will struggle to figure out where the dead money zone becomes worth buying. two gaps below us are quite possibly addressable (at least the one near low 90s is low hanging fruit all else equal). a small or modest beat sees a pop that gets retraced immediately. and that's where i'd probably short all else equal (ex post in the >$110 zone). gl to all. careful.

Akamai Technologies (AKAM: NASDAQ)Impressive 25% revenue increase in cybersecurity, reaching $325 million, contributing 38% of total revenue. Robust content delivery network (CDN) and strategic acquisition of Guardicore highlight growth potential.
Bullish outlook for #AKAM, with potential upward movement above $96.00-$97.00, targeting $148.00-$150.00.
#AkamaiTechnologies #StockMarket


Updated 10 Stock Pick in my PortfolioIntroduction:
I'm excited to share my trading journey on TradingView, where I'll be posting a carefully curated list of 10 stocks every trading day, and sometimes even multiple times a day. Through this endeavor, I aim to foster a dynamic environment where market enthusiasts can stay informed and engaged with real-time insights.
Why 10 Stocks?
The selection of these stocks is driven by a comprehensive analysis that takes into account various factors such as historical performance, price movements, and market trends. My algorithm examines a wide range of data points to identify stocks that show promising potential for growth or strategic value.
The Art of Stock Selection:
The stock tickers that make it to the list go through a rigorous evaluation process. I utilize a combination of quantitative metrics and qualitative insights to ensure that the stocks chosen have a strong foundation for potential profitability. This approach not only factors in financial indicators but also considers broader market dynamics.
Intermittent Updates:
To keep readers well-informed and engaged, I'll be posting these stock tickers intermittently throughout the trading day. This approach allows me to capture shifts in the market and share insights in real-time. By doing so, I aim to provide a valuable resource that helps traders and investors navigate the complexities of the stock market.
Your Feedback Matters:
As I embark on this journey, I wholeheartedly welcome feedback, discussions, and collaborations from fellow traders and investors. Your insights and perspectives are invaluable, and together, we can enhance our understanding of the market and refine our strategies.
Algorithm Overview:
In my script, I've developed an automated trading algorithm that utilizes the Alpaca API to manage a stock portfolio. The algorithm employs a systematic approach, leveraging historical price data and predefined criteria for buying and selling decisions.
Key Steps:
Setting Up:
I import the required libraries, configure Alpaca API credentials, and define the API's base URL for either paper or live trading.
Analyzing Account:
I fetch and display essential account details like equity, available cash, margin maintenance, day trading buying power, account status, and market open status.
Portfolio Evaluation:
I retrieve the existing portfolio positions and calculate their cost, market value, and profit/loss.
Using a DataFrame, I analyze this position data and perform calculations such as the sum of market values and costs.
Portfolio Sizing:
I determine the portfolio size based on a specified percentage of your account equity.
I set a condition to check if the market is open.
Data Retrieval:
I gather the list of stock tickers from the S&P500 index.
I obtain historical price data for these stocks within a defined date range.
Data Analysis and Selection:
I compute price changes, cumulative returns, and rank stocks based on recent performance.
From this analysis, I choose the top-performing stocks for potential inclusion in your portfolio.
Managing Positions:
I evaluate the current positions in your portfolio, decide which to retain, and identify new positions based on the analysis.
I calculate the necessary investment and quantity for each selected stock, considering portfolio sizing.
Order Execution:
I compare the existing portfolio with the new selections to determine which positions need buying or selling.
I place market orders to execute the necessary trades based on the earlier determined quantities.
Monitoring and Adjusting:
I introduce a delay (10 seconds in the code) before querying positions again.
This pause ensures that your portfolio reflects the recent trading activities.
Additional Note:
It's worth mentioning that I sometimes adjust the portfolio daily or multiple times a day, depending on market movements and volatility. I welcome any feedback on this experiment, as it's designed to gauge the interest of market participants. Please keep in mind that this initiative aims to better understand the dynamics of trading. As with any trading strategy, it's crucial to be cautious and thoroughly test the algorithm in a controlled environment before considering live trading. Remember that the success of trading algorithms hinges on various factors, including strategy quality, data accuracy, market conditions, and unforeseen events.

Updated 10 Stock Picks in my PortfolioIntroduction:
I'm excited to share my trading journey on TradingView, where I'll be posting a carefully curated list of 10 stocks every trading day, and sometimes even multiple times a day. Through this endeavor, I aim to foster a dynamic environment where market enthusiasts can stay informed and engaged with real-time insights.
Why 10 Stocks?
The selection of these stocks is driven by a comprehensive analysis that takes into account various factors such as historical performance, price movements, and market trends. My algorithm examines a wide range of data points to identify stocks that show promising potential for growth or strategic value.
The Art of Stock Selection:
The stock tickers that make it to the list go through a rigorous evaluation process. I utilize a combination of quantitative metrics and qualitative insights to ensure that the stocks chosen have a strong foundation for potential profitability. This approach not only factors in financial indicators but also considers broader market dynamics.
Intermittent Updates:
To keep readers well-informed and engaged, I'll be posting these stock tickers intermittently throughout the trading day. This approach allows me to capture shifts in the market and share insights in real-time. By doing so, I aim to provide a valuable resource that helps traders and investors navigate the complexities of the stock market.
Your Feedback Matters:
As I embark on this journey, I wholeheartedly welcome feedback, discussions, and collaborations from fellow traders and investors. Your insights and perspectives are invaluable, and together, we can enhance our understanding of the market and refine our strategies.
Algorithm Overview:
In my script, I've developed an automated trading algorithm that utilizes the Alpaca API to manage a stock portfolio. The algorithm employs a systematic approach, leveraging historical price data and predefined criteria for buying and selling decisions.
Key Steps:
Setting Up:
I import the required libraries, configure Alpaca API credentials, and define the API's base URL for either paper or live trading.
Analyzing Account:
I fetch and display essential account details like equity, available cash, margin maintenance, day trading buying power, account status, and market open status.
Portfolio Evaluation:
I retrieve the existing portfolio positions and calculate their cost, market value, and profit/loss.
Using a DataFrame, I analyze this position data and perform calculations such as the sum of market values and costs.
Portfolio Sizing:
I determine the portfolio size based on a specified percentage of your account equity.
I set a condition to check if the market is open.
Data Retrieval:
I gather the list of stock tickers from the S&P500 index.
I obtain historical price data for these stocks within a defined date range.
Data Analysis and Selection:
I compute price changes, cumulative returns, and rank stocks based on recent performance.
From this analysis, I choose the top-performing stocks for potential inclusion in your portfolio.
Managing Positions:
I evaluate the current positions in your portfolio, decide which to retain, and identify new positions based on the analysis.
I calculate the necessary investment and quantity for each selected stock, considering portfolio sizing.
Order Execution:
I compare the existing portfolio with the new selections to determine which positions need buying or selling.
I place market orders to execute the necessary trades based on the earlier determined quantities.
Monitoring and Adjusting:
I introduce a delay (10 seconds in the code) before querying positions again.
This pause ensures that your portfolio reflects the recent trading activities.
Additional Note:
It's worth mentioning that I sometimes adjust the portfolio daily or multiple times a day, depending on market movements and volatility. I welcome any feedback on this experiment, as it's designed to gauge the interest of market participants. Please keep in mind that this initiative aims to better understand the dynamics of trading. As with any trading strategy, it's crucial to be cautious and thoroughly test the algorithm in a controlled environment before considering live trading. Remember that the success of trading algorithms hinges on various factors, including strategy quality, data accuracy, market conditions, and unforeseen events.

Akamai Technologies On WatchClear downtrend.
Beat Earnings with an upbeat guidance. Trading at a very reasonable ~13-14 PE
On close watch for breakout where I will buy.
Additional lines are existing gaps to the upside.
Entry to be posted.
1st PT would be the closest gap fill.

AKAM - Updated View (Bear)Bear view showing a rising wedge
However I suspect the downsides will be small of this roll over top that has formed and price will stabilise at the horizontal white line
This is different to my previous Analysis of AKAM here
www.tradingview.com

Symmetrical TriangleThis one has broken to the downside.
It has not quite made it to T1 but it does appear to be finding support.
Red spinning top noted.
Time will tell.
No recommendation/Price is below the bands exhibiting strong selling pressure.

$AKAM with a Neutral outlook following its earnings #Stocks The PEAD projected a Neutral outlook for $AKAM after a Negative over reaction following its earnings release placing the stock in drift C with an expected accuracy of 87.5%.
AKAM - Found Support Above Channel AKAM has found support above a major channel on this non-long chart
Similar price areas or comparison points can be seen in green rectangles, however the most recent one is considered more bullish to me as it is perched above the upper channel
Regardless I find this very bullish long term

$AKAM with a Neutral outlook following its earnings #Stocks The PEAD projected a Neutral outlook for $AKAM after a Negative over reaction following its earnings release placing the stock in drift C with an expected accuracy of 85.71%.
akam vol increase in demand!long term buyers love this area where they keep to DCA (dollar cost average) as we can see this huge influx in vol i will look to long to take it back to top of range with profit taking levels at 104 and 113.99

AKAM New All Time Highs Soon?*AKAM Getting closer to a New All Time High after a long consolidation
*9 Month Long Base
*Price above 200 DMA
*One concern is volume is very low in last few days
*Want to see higher volume on breakout
*Over 95% institutional ownership

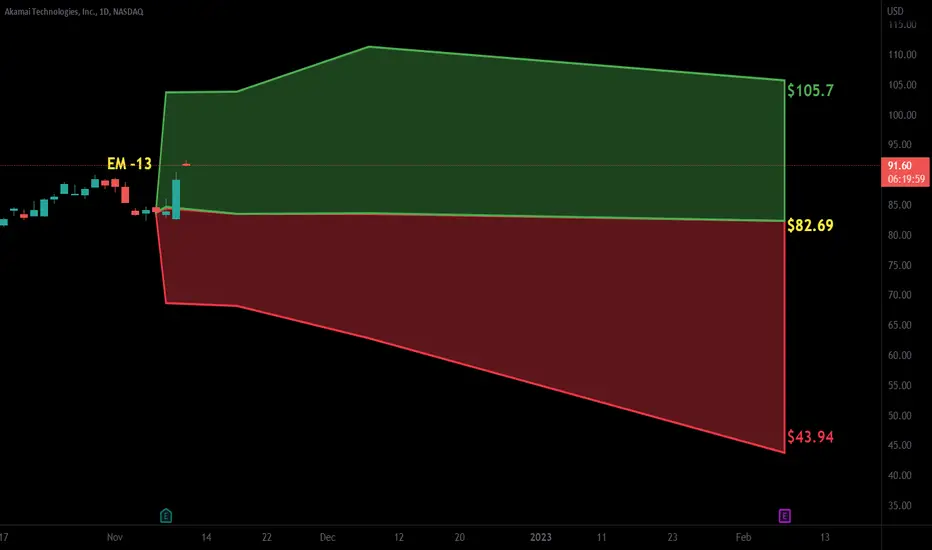
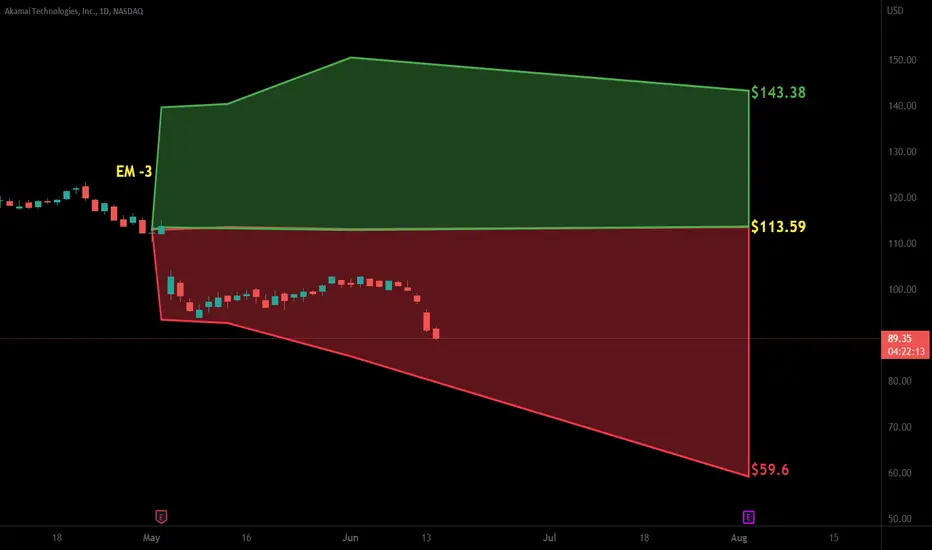
Will AKAM retest February lows?Based on historical movement, the peak could occur anywhere in the larger red box. The final targets are in the green boxes. The pending bottom should occur within the larger green box as has been the historical case. Half of all movement has ended in the smaller green box. In this instance, the signal indicated SELL on March 18, 2022 with a closing price of 116.2.
If this instance is successful, that means the stock should decline to at least 115.23 which is the top of the larger green box. Three-quarters of all successful signals have the stock decline 3.488% from the signal closing price. This percentage is the top of the smaller green box. Half of all successful signals have the stock decline 5.983% which is the end point of the black dotted arrow. One-quarter of all successful signals have the stock decline 11.105% from the signal closing price which is the bottom of the smaller green box. The maximum decline on record would see a move to the bottom of the larger green box. These are the same concepts for the levels in the red boxes as well.
The ends/vertical sides of the boxes are determined in a similar fashion. The trough of the decline can occur as soon as the next trading bar after signal close, while the max decline occurs within the limit of study at 40 trading bars after the signal. A 0.75% decline must occur over the next 40 trading bars in order to be considered a success. Three-quarters of successful movement occur after at least 9 trading bars; half occur within 17 trading bars, and one-quarter require at least 26 trading bars.
The black dotted arrow represents median historical movement. Medians are a good metric, but they are just one of many I use when forecasting future movement.
As always, the stock could decline the very next bar after the signal without looking back (therefore the red boxes would not come into play) or the stock may never decline (and the green boxes may never come into play).

Akamai Technologies AKAM - Interesting Short SetupFrom a price action perspective, this looks like a textbook short setup. Earnings pump off a lower low into area of heavy resistance. Risk/reward looks good here on a short.

AKMAI is in a distribution zone wait before sellingAkamai Technologies, Inc. is an American content delivery network (CDN), cybersecurity, and cloud service company, providing web and Internet security services
