AMD IS A MUST BUY 12 MARCH 2025Amd at current price is a mist buy for investment. It is technically looking super strong. I have ready explained the price action on AMD ontrading view.
4AMD trade ideas

AMD - 16RLast AMD trade was just stopped out, re-entering here with a 1:16RR.
Probability 8/10
Risk to reward 7/10
Overall rating 7.5/10

AMD at a Critical Level! Will the Downtrend Continue or Reverse?Market Structure & Key Levels
* AMD is currently trading within a downtrend channel, struggling to break through the resistance zone around $100–$102.
* A key support zone is forming around $95–$96, where buyers have been stepping in.
* The broader trend is bearish, with AMD rejecting from the upper boundary of its trend channel.
Support & Resistance
* Immediate Resistance: $100.25, $103.14, $104.00
* Immediate Support: $95.91, $94.73, $90.00 (PUT Wall)
📊 Indicator Analysis
MACD & Momentum
* MACD is slightly bullish, but the momentum is still weak, suggesting uncertainty.
* If the MACD crosses bullishly with volume, we could see a short-term relief rally toward $100+.
Stochastic RSI
* The Stoch RSI is oversold and curling upward, hinting at potential upside.
* However, without strong volume confirmation, this could be a weak bounce.
📈 GEX & Options Insights
* IVR: 52.9, suggesting moderate implied volatility.
* IVX avg: 56.5, showing that the stock is near average volatility levels.
* GEX Sentiment: Bearish
* PUT Support Wall at $95 (Highest negative NETGEX level).
* CALL Resistance at $102–$105 (Heavy gamma exposure).
* A break below $95 could trigger more downside pressure toward $90.
💡 Trade Scenarios
🟢 Bullish Play (Breakout Above $100)
* Entry: Above $100.25 with strong volume.
* Target: $103.14 → $104.00.
* Stop Loss: $97.50 (Below rejection point).
🔴 Bearish Play (Continuation to Downside)
* Entry: Below $95.50.
* Target: $94.73 → $90.00 (PUT Support Wall).
* Stop Loss: $97 (Above consolidation zone).
Final Thoughts
* Bearish Bias Unless AMD Breaks Above $100–$102.
* Watch for a rejection at resistance or a breakdown of $95 for further downside.
* Implied Volatility suggests a strong move could be coming.
🚨 This analysis is for educational purposes only. Always trade with proper risk management! 🚨

AMD What a confluence of trendlines and timing ??? A strong Buy.Do you see what I see?? The chart says it all no need for words. Alost exactly (363 days) since last peak. How worst can it get from here?

Strong Buying Support for AMDAMD has been in a bearish market for almost a year. Now, the Y downtrend cycle is nearly complete, making it a good place to look for a buying opportunity. In my view, the market will reject at S2 and form a bullish candle. However, if the support doesn't hold, the price may continue downward to complete cycle X. The good indicate to know if market on bullish trend is price can break LH on Daily Time Frame.
Support
S1@105.58, S2@102.44
RSI
b)RSI TF H4 is indicate overbought
c)RSI TF Daily almost touching 30
This is not a buy call. Just sharing Idea, Thanks

$AMD yieahhhWeekly chart
this is for those of you who appreciate abstract art, directly coming from Pablito Picasso.
1. ABC down, current C is 61% fib from first leg.
2. Bunch of confluences here
- High volume area, would be better if price closed above it though and within the upward channel
- RSI on a wedge going from the previous lows we had at end of 2023. (This makes me think we are expecting a strooong break)
- 2 parallel channels, downward and upward. If you are able to see the upward one, we broke it which could have helped the selloff and is what worries me, along with being below the heaviest volume shelf we need to recover this quick this month to continue our hypothesis. The downward channel can act as a support, which is same channel price broke up in 2023 and will now test it at $103. If it holds we can be up to the races to $185.
- Still need a good week to turn that MACD.
Will throw my dice on for that recovery this month after the huge earnings selloff!

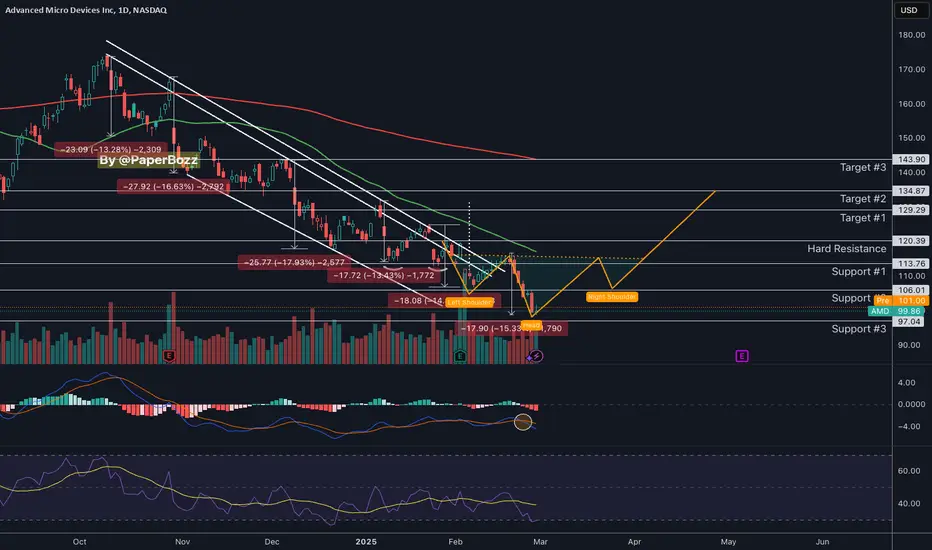
AMD - ReversalNASDAQ:AMD AMD has been in a strong downtrend for the last 5 months staying within a defined channel. It has reached a key support level at $100 from the end of 2023 and is down over 50% from all-time highs. I believe we will see a little bit of consolidation here over the next week or two then a breakout of the channel. I have started a long position at this level and will add to the position when it breaks out of the channel as a confirmation of the move. Target is the overhead resistance at the $128-$130 level and the Stop Loss is set at $86.6 for a roughly 1:2 R/R on the trade.

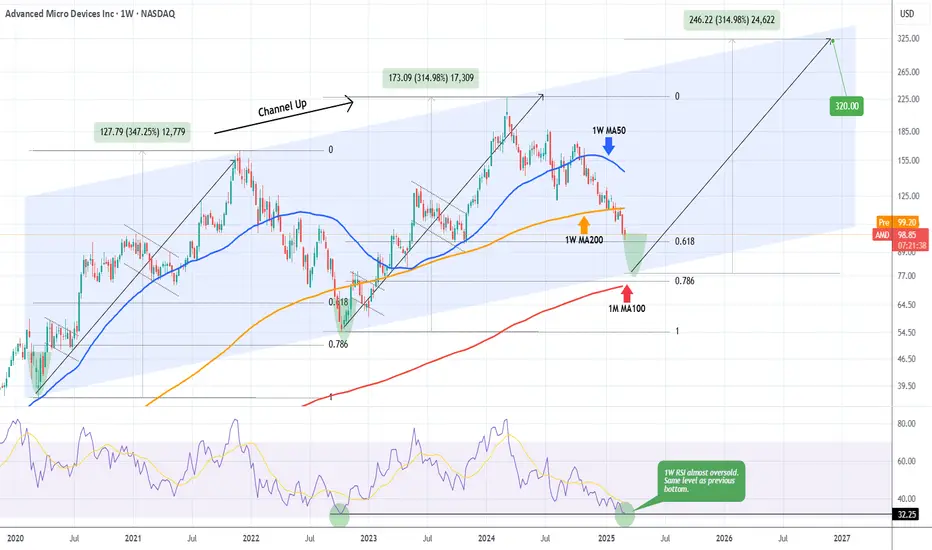
AMD Bottom pricing inside 3 weeks. MASSIVE BUY.Advanced Micro Devices (AMD) have been on a downtrend for exactly 1 year, every since the March 04 2024 Top. That was a technical Higher High on the 5-year Channel Up.
With the price trading below even its 1W MA200 (orange trend-line), there is a massive underlying buy opportunity on the stock for the long-term. That's because this 1-year downtrend is the technical Bearish Leg of this Channel Up, whose previous one bottomed 2 weeks after breaking below the 0.618 Fibonacci retracement level, contained at the same time above the 0.786 Fib.
As you can see, the price is just above the current 0.618 Fib and the 0.786 Fib is just below the Channel Up, where the ultimate macro Support of the 1M MA100 (red trend-line) is headed.
With the 1W RSI almost oversold and on the exact level where the previous Channel Up bottom (October 10 2022) was formed, the stock is technically entering its long-term buy opportunity zone.
Based on this pattern, the R/R is already on excellent levels for a buy and we expect the bottom to be formed within the next 3 weeks. If the new Bullish Leg imitates the previous one and rises by +315%, we can expect AMD to have its next Top at $320.
-------------------------------------------------------------------------------
** Please LIKE 👍, FOLLOW ✅, SHARE 🙌 and COMMENT ✍ if you enjoy this idea! Also share your ideas and charts in the comments section below! This is best way to keep it relevant, support us, keep the content here free and allow the idea to reach as many people as possible. **
-------------------------------------------------------------------------------
💸💸💸💸💸💸
👇 👇 👇 👇 👇 👇
Long AMD finallyI'm optimistic about AMD's stock for several reasons. The company's 2024 Annual Report indicates a strong financial performance, with significant revenue growth and profitability.
Additionally, AMD's strategic acquisitions and expansions into high-growth markets like data centers and artificial intelligence position the company for sustained growth. The stock has found support around the $100 level, suggesting strong investor interest. With these factors in mind, I anticipate positive earnings in the upcoming reports, reinforcing my decision to go long on AMD.

AMD 45RAMD is now at a key demand (support) zone.
There are two very clear patterns hearing into it which makes this a great trading setup.
Probability rating: 5/10
Risk to reward rating: 10/10
Overall rating 7.5/10

AMD - Interesting chart! Advanced Micro Devices (AMD) is an American multinational company specializing in semiconductors, microprocessors, and graphics cards. Headquartered in Santa Clara, California, AMD was founded in 1969 and has become a key player in high-performance computing, competing with companies like Intel and Nvidia.
Financial Results 2024:
In 2024, AMD achieved record financial results. The company reported an annual revenue of $25.8 billion, with a gross margin of 49%. Operating income was $1.9 billion, while net income stood at $1.6 billion. On a non-GAAP basis, the gross margin was 53%, operating income reached $6.1 billion, and net income was $5.4 billion, with diluted earnings per share of $3.31. (amd.com)
Outlook for 2025:
For the first quarter of 2025, AMD forecasts revenue of approximately $7.1 billion, representing a 30% year-over-year increase. However, a sequential decline of 7% is expected due to seasonal factors. (digitimes.com)
Future Projects:
AMD is focusing on several key innovations:
Zen 6 Architecture: Expected in 2026, the Zen 6 ("Morpheus") architecture will be built using TSMC’s 3nm and 2nm processes. The desktop processors, codenamed "Medusa," and server chips, named "Venice," will represent the next generation of high-performance CPUs. (en.wikipedia.org)
RDNA 4 Graphics Cards: AMD has confirmed the launch of its next-generation RDNA 4-based GPUs in early 2025. These cards will bring significant improvements in gaming performance, ray tracing, and AI capabilities. (theverge.com)
Artificial Intelligence: AMD is heavily investing in AI, recently launching the MI300 chip, which is rapidly becoming one of its fastest-growing products. AMD’s AI strategy spans from personal computing to large-scale cloud data centers, with collaborations involving Microsoft, Meta, and Oracle. (time.com)
With a strong financial foundation and a clear vision for the future, AMD continues to drive innovation in the semiconductor industry, strengthening its position in the global market.

$160+ END OF YEAR PRICE! GET READY FOR BIG UPWARD MOVE!🚀 AMD TO $160+ BY YEAR-END 🚀 The AI chip king is set to dominate with MASSIVE growth and unmatched innovation 🌟🔥 Buckle up for the rocket ride! 📈💰

$AMD HUGE UPSIDE POTENTIAL! AMD is down 48% from its all-time highs, yet its fundamentals and prospects remain stronger than ever. With a market cap of $190B, it’s currently valued at only ~6% of NVDA ($3T). This massive valuation gap presents a huge opportunity for long-term investors.
🔴 AI Growth is Just Getting Started – AMD’s MI300 series is gaining traction in AI data centers, with major cloud providers adopting its chips. The AI boom is still in its early innings, and AMD is positioned to capitalize.
🔴 Server Market Expansion – EPYC chips continuously gain share against Intel in the data center space. As enterprises shift workloads to more efficient solutions, AMD benefits.
🔴 Console & Gaming Strength – AMD powers the PS5, Xbox Series X, and upcoming handhelds like the ROG Ally & Steam Deck. Gaming demand remains strong, providing a solid revenue base.
🔴 Valuation is a Bargain – At current levels, AMD trades at a fraction of NVDA’s valuation. As AI demand grows and AMD executes, this discount won’t last forever.
The Setup is Clear
AMD is one of the best risk-reward plays in the market today. With AI, gaming, and data centers fueling growth, the current price is a steal for long-term believers. 🚀
Will AMD be the next to skyrocket? Let me know your thoughts! 👇🔥 #AMD #AI #Semiconductors #Investing

AMD: Possible Up Bullish Divergence (60% Upside)Observed AMD official touch the multi-year Support zone and looking for a reversal good news. RSI was broken and forming bullish divergence. Possible up trend emerge from here and may be earlier than you thought.

AMD Testing Resistance! Will Bulls Push Through or Will Bears?📊 Technical Analysis (TA):
1. Trend & Structure:
* AMD has shown Break of Structure (BOS), confirming its previous downtrend.
* Change of Character (ChoCH) signals a potential reversal, and buyers are stepping in.
* Key Resistance: ~102-105 (supply zone & call wall)
* Support Zone: ~95-100 (recent demand zone)
2. Indicators Suggesting Strength:
* MACD: Bullish crossover confirms increasing momentum.
* Stochastic RSI: Moving out of oversold territory, supporting further upside.
* Volume Surge: High buying volume indicates accumulation near support.
🔹 GEX & Options Flow:
1. Call Walls (Resistance) 🚧
* 105-107: Strong resistance, where gamma resistance intensifies.
* Above 107: A breakout could lead to further upside.
2. Put Walls (Support) 🛑
* 100: Highest negative NETGEX, acting as a strong bounce level.
* 95-90: Deeper support areas if AMD pulls back.
3. IV Rank & Skew:
* IVR 38, suggesting moderate implied volatility.
* Call positioning at 15%, indicating a shift toward bullish sentiment.
* Put walls remain strong at lower levels, meaning downside hedging is present.
📌 Trading Plan & Suggestions:
* Bullish Breakout Scenario:
* If AMD holds above 100-102, a breakout toward 105-107 is likely.
* Ideal trade: April 105C or 107C, targeting a continuation move.
* Bearish Rejection Scenario:
* If AMD fails to hold 102, expect a retest of 100-95.
* Ideal Put Play: Buy March-April 100P or 95P, targeting a retest of the lows.
⚠️ Key Warning: A strong breakout above 105 could trigger a gamma squeeze to 107+.
🔥 Conclusion: AMD at a Make-or-Break Level – Can Bulls Maintain Momentum?
AMD is testing key resistance, with strong buying volume and bullish indicators forming. If 102-105 holds, we could see further upside, but failure to break could lead to a rejection back toward 95-100. Watch the reaction near 102-105 carefully! 🚀📉
🚨 Disclaimer:
This analysis is for educational purposes only and does not constitute financial advice. Always do your own research and trade responsibly.

Long $AMD into May earningsNASDAQ:AMD is catching a bounce at a familiar level and I have added shares at the 100 area with stops of 11%, also looking at April calls. I think Trump has shown he wants USA semi's to do well so should outperform while everything else is suffering from tariffs and other policies.


AMD TSX LONGTERM TRADE SETUP.Would love to hear thoughts on this idea based on macd , volume profile and solely based on a confirmation of reversal.
Not financial advice but I think there's opportunity here.

$AMD - False breakoutNASDAQ:AMD false breakout. I was wrong. AMD tends to recover after a 14% to 16% drawdown. So, we could expect a recovery, even if it’s brief.
It’s way too early, but it might be starting to form an inverse head-and-shoulders bottom.👀
AMD: getting close to invalidating the macro uptrend since 2022AMD has not been able to keep up with NVDIA for about a year. The year long decline is about to approach a critical support area. $93.12 is the line in the sand to invalidate the expanding diagonal structure to complete minor wave 5. If this level breaks that will mean AMD is still on minor degree wave 4 and is in an expanding ABC correction. Unless this turns into a running flat scenario, expanding correction would take the C wave below the A wave, which was $54.57. That will not be pretty for AMD, given the chip market overall is getting very messy with the trade war situations.
With RSI braking below 30, we should expect a bounce soon. If that bounce starts to look like a V shape recovery, then there might be some hope to see higher high again. Earnings are still a few weeks away. In the meantime, price needs to head back above $130 to have any reason to long this ticker!

Quick draw upI did quick and simple T/A and in my opinion seems to be the likely outcome. EMA lines are about to cross, it has made a lower low, which has now flipped the Fibonacci and likely to get rejected at the 61.80% - 50% range. The path lines aren't placed specific to the timeframes so ignore that it stretches way into 2025.

Advanced Micro Devices, Inc. - Short - long failed upward candleAs of 10 April 2024, AMD PE ratio is at 334. It had a long failed upward candle on 8 March 2024.
Downside till 95 dollars.

Top 5 Weekly Trade Ideas #5 - AMD Major Trend BreakMy personal sentiment for the market overall right now is bullish for the shorter term, which you can probably see in my ideas the last few weeks. CPI is tomorrow and there's strong potential for downside, so I'll make one bearish idea for the top 5 this week.
AMD has been the red headed step child of semis this year, kind of sad to see. Now it has a major trend break here, with this trendline starting back in 2022. Not a good look at all. This is a longer term chart, final downside target would be all the way down near $74, but there's plenty of potential supports along the way.
I think this will be a good name to short if the market turns bearish and if we rally, it could be a good short in the near future on a retest of this trendline. If it rallies back up for a retest that would be the first one and this is a major one so I'd say the probability of a fail on the first retest would be very high.
